
As we continue our analysis of household mortgage debt, and having described the ratios we are using (Loan to Value (LVR), Loan to Income (LTI) and Debt Servicing Ratio (DSR)) we can drill into the more specific data slices. Today we look across the top ten locations by DSR.
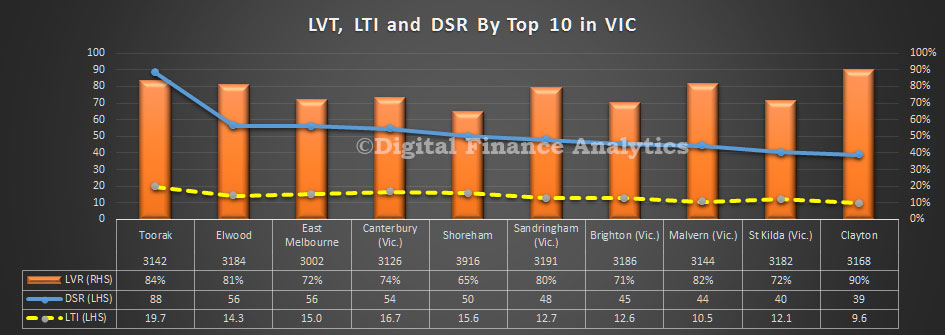
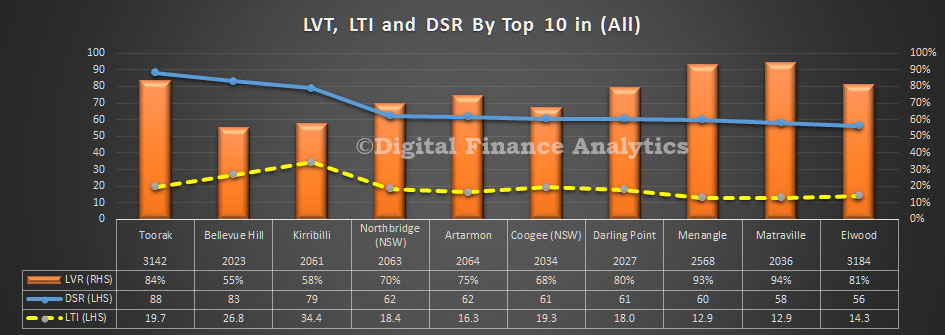 We see at once that some of the highest DSR ratios are found in some of the more affluent suburbs – such as Torak (VIC) and the lower north shore in NSW. In these locations, home prices are very high, and as a result households have extended their borrowings – with high LVRs, DSRs and DTIs. This suggests that those will more ability to borrow and service large mortgages are most in debt.
We can then look at each state in more detail. For example, here is NSW.
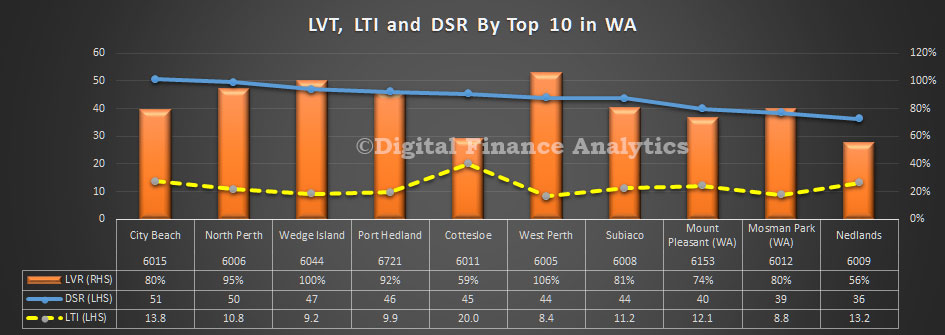
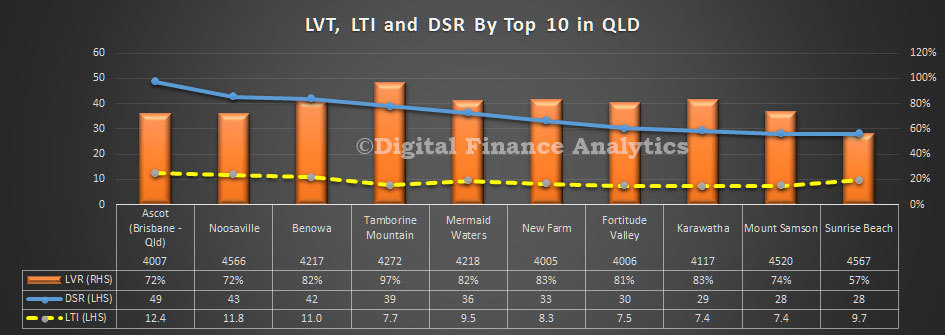
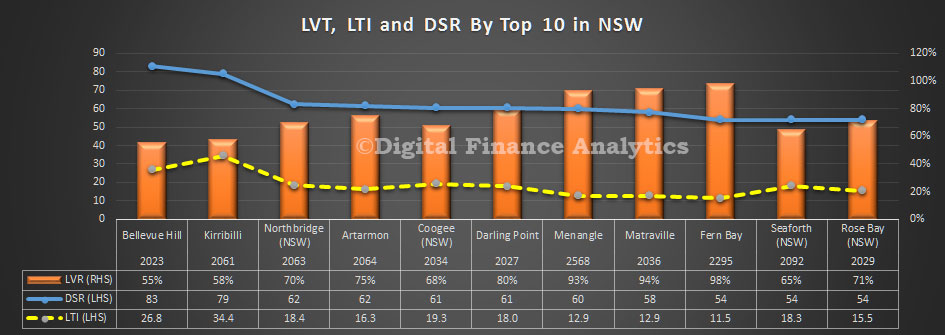 As we go down the list we begin to see a more mixed set of locations figuring in the top 10, though generally still closer to the CBD. We see somewhat similar pictures in WA, QLD and VIC.
 Of course averages can be misleading, as we see a small number of mortgages well above $1m. We also see a high penetration of interest only loans, and recent refinancing events. Provided interest rates remain low, and incomes are solid, the risks are probably relatively well contained. It would be a different matter if home prices slipped significantly.
As we go into more detail in later posts, we will identify some other factors are creating more risks within the portfolio.
One thought on “So Where Are DSR’s Highest?”