
There are at least three key ratios we consider when examining households and their mortgage commitments. Today we discuses these in the light of data from our surveys, which follows on from yesterdays post.
Loan to Value (LVR) calculations tell us about the proportion of a property owner by the home owner, versus the bank.
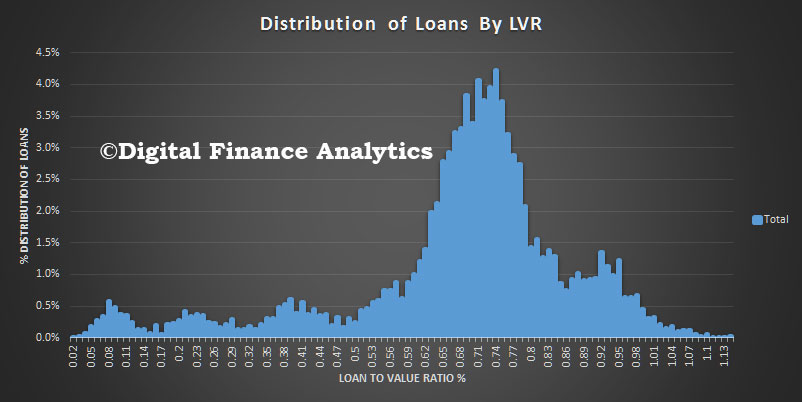 Higher loan to value ratios are a sign of potential financial instability, because if prices were to fall the borrower could be left with a mortgage bigger than the value of the property. In Australia, LVR’s higher than 80% will normally require extra lender mortgage insurance, and this in turn has changed the shape of the market. The average marked to market LVR is 68%. Many lenders rely on the LVR at loan inception and use this data in their risk models.
Of course in Australia, home prices have been rising strongly in some states, though we have seen some falls in value in WA recently. Some regulators have imposed specific loan to value limits on lenders, for example the Reserve Bank of New Zealand. However, LVR ratios have limitations, because as the value of the property rises, the LVR falls. In a strongly rising market, this may mask issues within the portfolio. Recently the proportion of high LVR loans being written has been falling as regulators turn up the heat. However APRA only reports scanty aggregated data.
Loan to income (LTI) ratios tell us about the households borrowing footprint. The higher the income ratio, the higher the risk.
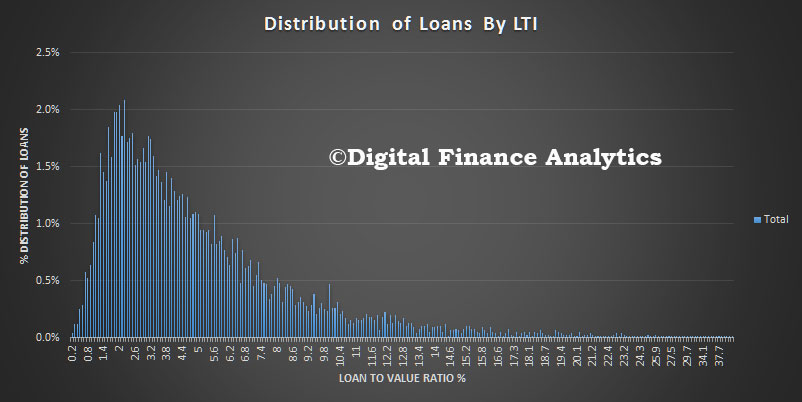 Over time the average LTI has risen from around three times income to more than five times income. This illustrates the extra leverage households have been able to create in response to strongly rising prices as lending standards have been relaxed. Some regulators have started to limit high LTI loans. For example the Bank of England. LTI is sensitive to rising property prices and larger mortgages as well as static or falling incomes. There is no regular LTI reporting in Australia.
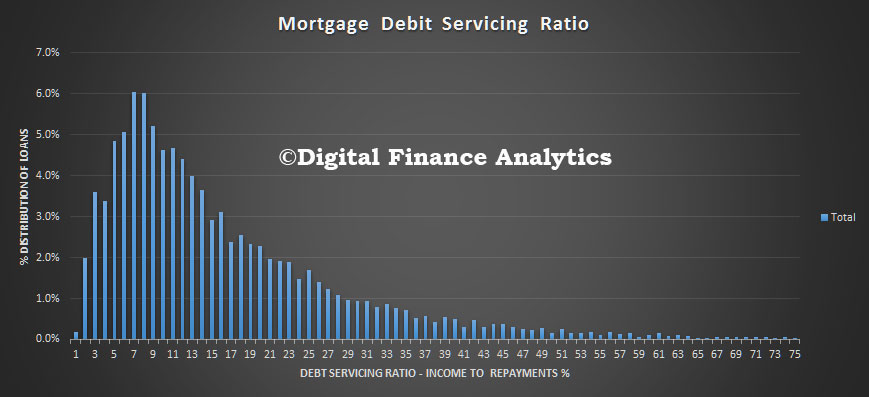
The third is the debt servicing ratio (DSR). This is the ratio between gross household income and the amount paid on the mortgage. The DSR is defined as the ratio of interest payments plus amortisations to income. As such, the DSR provides a flow-to-flow comparison – the flow of debt service payments divided by the flow of income. We think the DSR is an important lens to look at households debt footprint, but the ratio is highly sensitive to interest rates because as interest rates fall, the ratio improves. Current DSR ratios are often seen as reasonable because of the current ultra low rates, but of course that tells us nothing about the impact of rising rates later. The average DSR is 16.8, but there is a very wide spread. In 2015 the BIS published some relative benchmarks and found that Australia was at around 16 one of the highest in the developed world. DSR is the recommended macroprudential measure. There is no regular DSR reporting in Australia.
 The Bank of Canada has recently been looking at DSR. Here is an example of their findings in their home market.
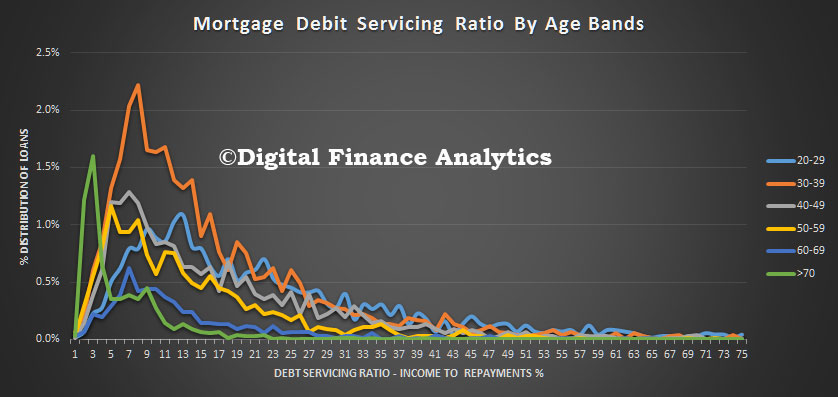
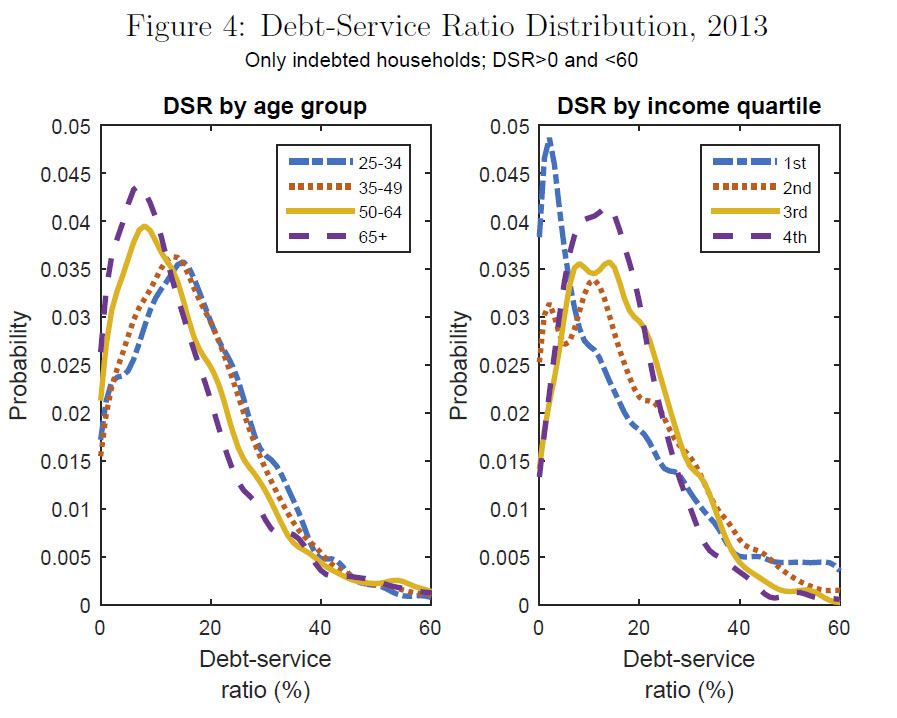 We can look at age and income distribution in Australia.We see that a significant proportion of younger households have a DSR in excess of 20. Older households have on average lower DSR’s.
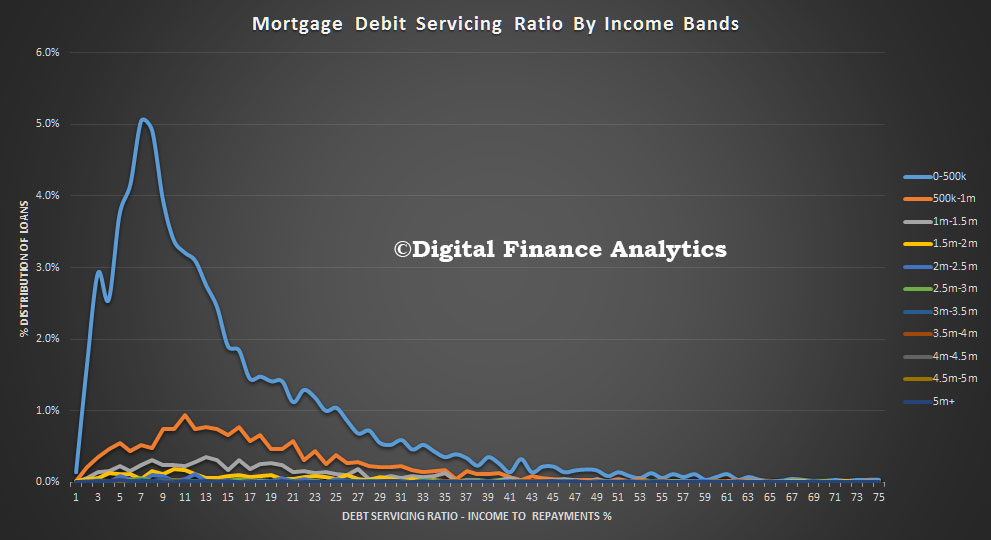
 Like Canada, lower income households tend to have higher DSR’s.
 One important point to consider is whether the ratio should take account of other repayments – such as credit cards – or other living expenses. Most DSR calculations do not factor in other elements, although thanks to regulatory pressure, lenders are now more conservative in their underwriting criteria when it comes to assessing true income.
Next time we will dive further into these metrics by looking across our household segments. The results are surprising.