
We have updated our savings intentions data, using results from our latest household surveys. Today we outline the main findings from the research. Using the DFA property segmentation, we can compare the relative value of savings across the segments, and compare this distribution with last year. In addition, we expect savings rates to be cut further next year.
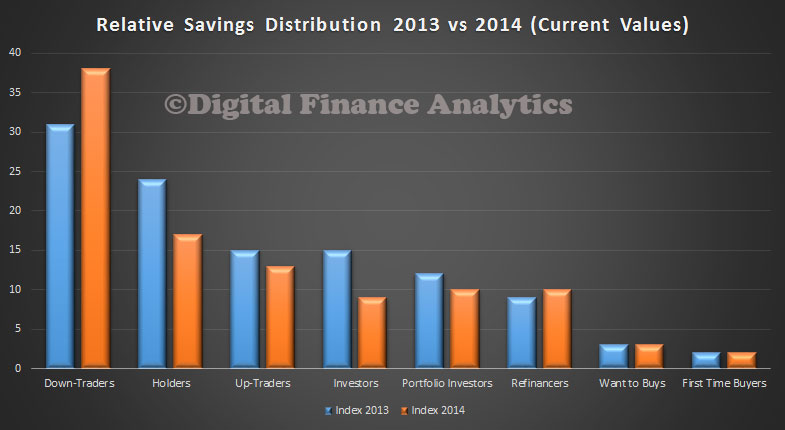 We see that Down-Traders hold the largest relative share of savings, up from 32% last year to 38% this year. All other segments are at the same relative values as last year, or at lower levels. This highlights that people looking to sell and move to smaller properties are hold the most significant savings.
In this analysis, savings includes balances in current accounts, call and term deposit accounts, and other liquid savings vehicles, but excludes property, shares are superannuation.
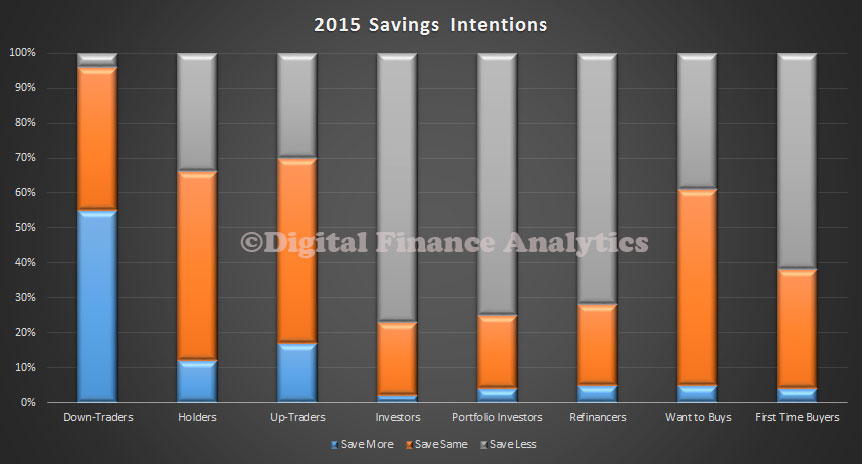
Looking at savings intentions, we see that Down-Traders are expecting to save more next year (55%), and only 5% are expecting to be savings smaller amounts. Investors, Portfolio Investors and Refinancers are more likely to be saving less next year. Want to Buys and First Time Buyers are also quite likely to do the same next year.
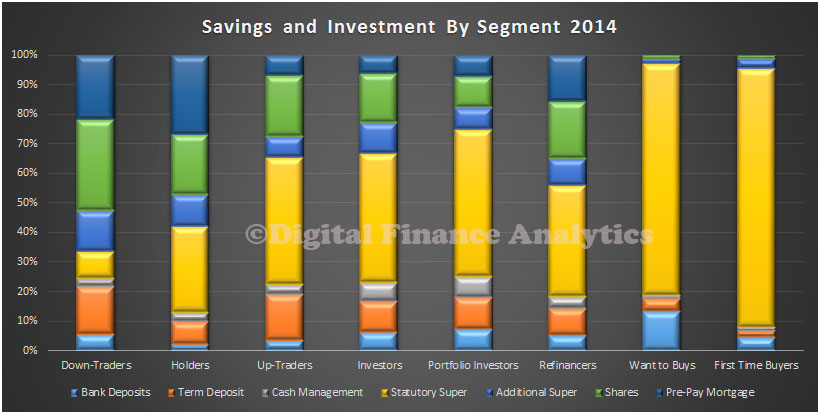
 We can also look at the relative distribution of saving and investment vehicles by type. For some, the main vehicle is statutory superannuation, whereas for some other groups, bank deposits and cash management accounts are more significant. We also highlight the importance of pre-paying the mortgage for some segments.
 At this point, we introduce our master household segments, and show the relative savings distribution across these segments. By far the largest balances are held by the Exclusive segment, followed by Self-Funded Retirees. The chart shows the relative distribution, with the yellow box showing the 50% distribution bounding.
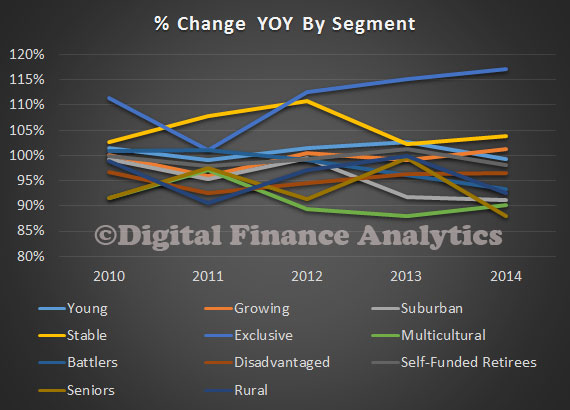
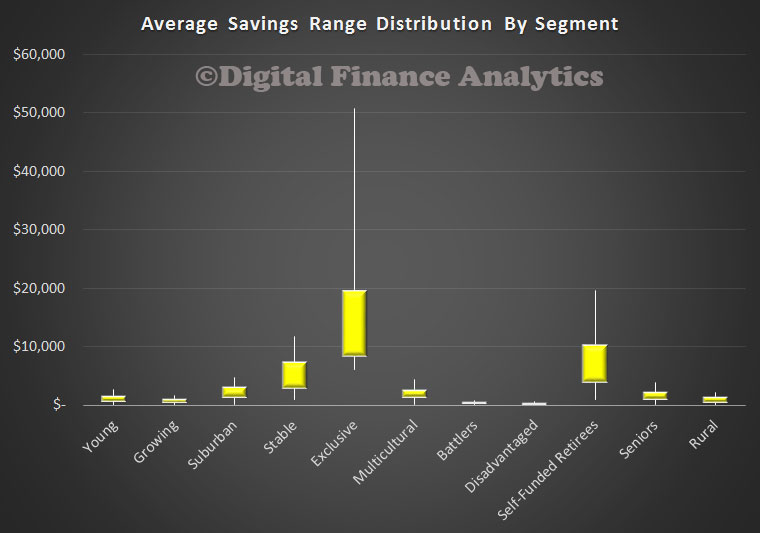 We also see some trends by looking across segments over time. Exclusive and Stables household segments are seeing balances increasing, whereas Seniors and Self-Funded Retirees are seeing balances falling. In our analysis we saw that these older groups are especially feeling the impact of lower savings rates.
 Another way to look at the savings scene, is to examine the motivations for savings. The chart below shows the relative distribution by age bands. Significantly, many households in the 20-30 and 30-40 age ranges are not saving at all. Older households are more likely to be saving for growth, whereas the oldest households are most likely to be saving for income.
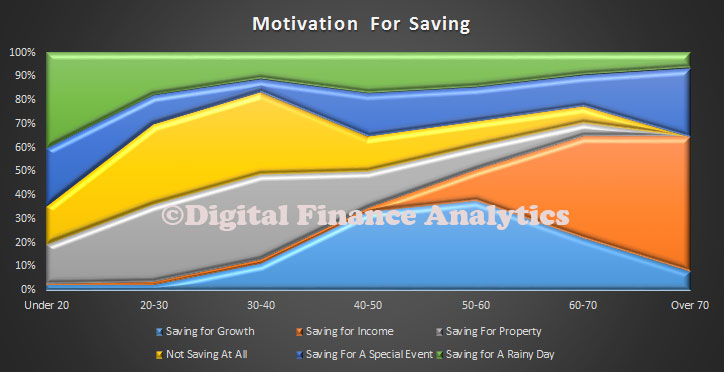 65% of younger households are most likely saving for a specific event (e.g. holiday, car, wedding) or for a rainy day. We see that saving for property purchase peaks in the 30-40 years age group.
We believe that households will continue to be cautious in 2015, and that will savings rates continuing to fall, we will see many saving more, not less. The RBA remains keen to encourage households to spend more, but the research shows that saving remains important for those with the largest balances, and many are stress by costs of living rising, savings rates falling, and therefore are expecting to save less.
This is the last post for 2014. Thanks to all those who follow, read and comment on the DFA Blog. We will be back early in 2015, with fresh insight and updated surveys. Meantime happy holidays.