Westpac Group has announced First Half results for 2016. Whilst statutory net profit was $3,701 million, up 3% over the prior corresponding period it was 16% down from 2H15. Cash earnings were $3,904 million, up 3% from 1H15, but down 3% from 2H15. Cash earnings per share was 118.2 cents, down 2% on 1H15 and down 7% on 1H16. Cash return on equity (ROE) was down 166 basis points from 1H15. and down 172 basis points from 2H15, to 14.2%. The interim, fully franked dividend was 94 cents per share (cps), up 1% on the 2015 interim dividend and in line with the 2015 final dividend. They lifted the payout ratio to around 80%.
The bank is having to work hard to maintain momentum, with the lower rates on deposits, the main lever. Tighter lending standards are showing in the Australian mortgage book, as are rising delinquencies. There are headwinds in the Institutional Bank and New Zealand. The question becomes, is it sustainable to pay current dividend rates into the future? Will 2H16 impairment charges be lower as the bank suggests? What will the next capital lifting initiatives be (they were silent on this, indicating they were in the top quartile of banks globally), given we expect ratios will be going higher.
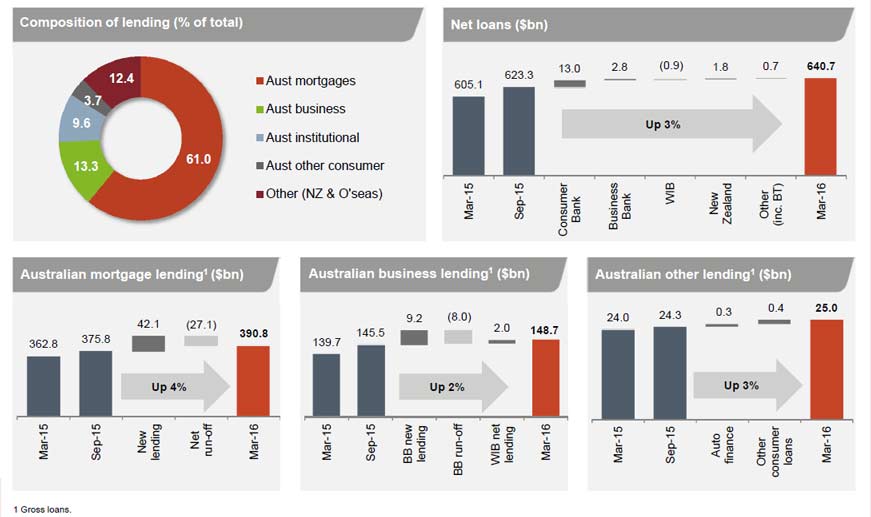
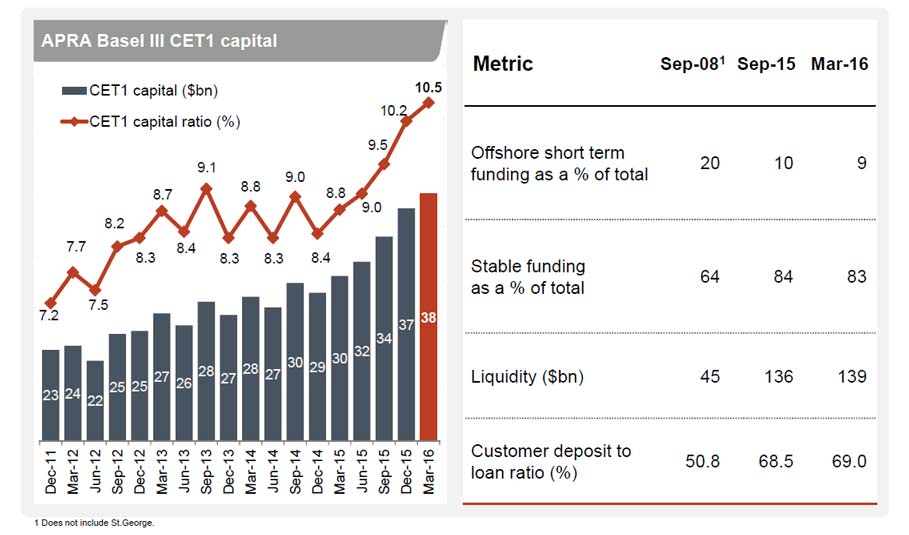
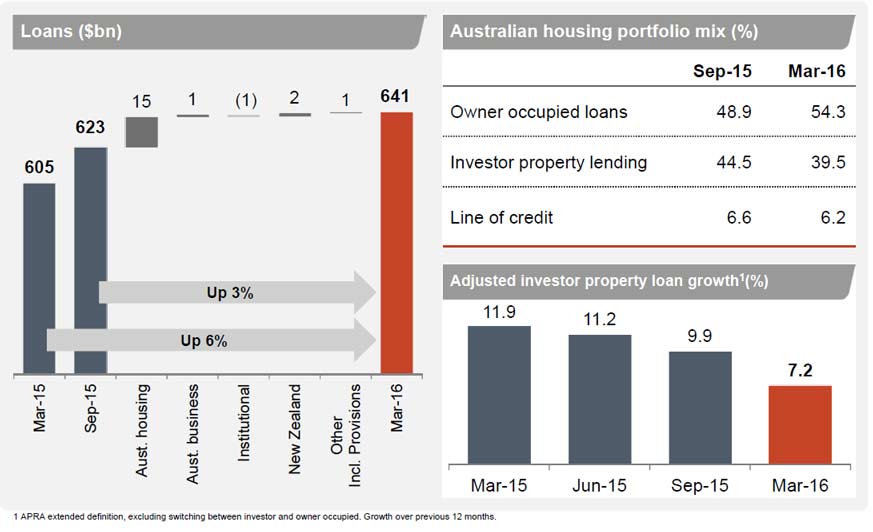
Lending and customer deposit growth of 6% and 5% respectively. Net interest income was $7,653 million, up 10%, with net interest margin up 9 basis points. Total lending rose 6% from March 2015, with above system growth in Australian mortgages, up 8%, and Australian business lending rising 6%. Lending in New Zealand increased 7% in NZ dollars. The bank is heavily reliant on the performance of its mortgage book in Australia. Customer deposits increased $21.7 billion, or 5%, with the deposit to loan ratio at 69%.
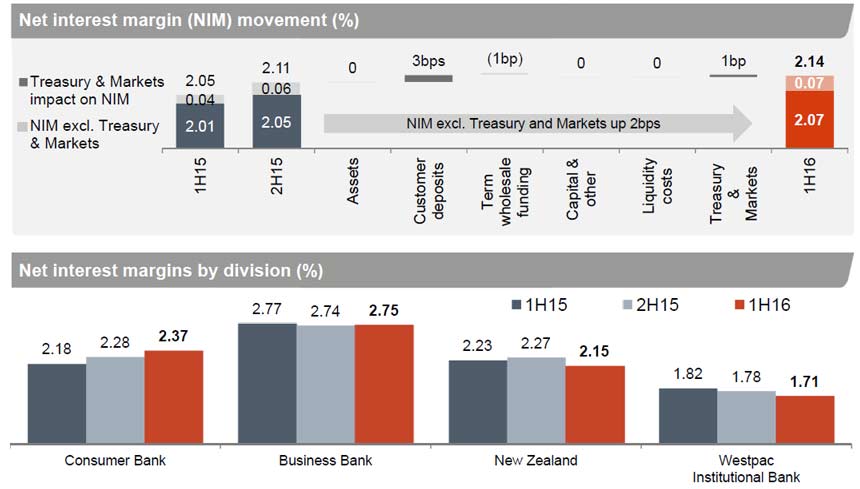
 Excluding Treasury and Markets, net interest margins were up 6 basis points. But NIM in New Zealand and Institutional Bank fell. Actually the biggest contribution was from reducing interest rates on deposits.
 Non-interest income of $2,966 million was down 4%. Excluding infrequent and volatile items, most of the decline was due to lower Australian credit card interchange income and lower institutional fee income in line with more subdued debt origination
An improved expense to income ratio of 41.6%, down 3 basis points from 2H15, with expenses up 4%, mostly related to higher investment including increased technology and professional services costs
Stressed assets to total committed exposures falling 9 basis points to 1.03%. But impairment charges increased $326 million due to lower write-backs, increased provisions for a small number of larger institutional facilities, and from a modest rise in consumer delinquencies. An increase in the stressed exposures ratio of 4 basis points over Second Half 2015 principally reflects a rise in consumer delinquencies, including in geographies more affected by the slowdown in mining. We see mortgage deliquencies rising in WA and QLD (but a rise shows in all states, from a low base).
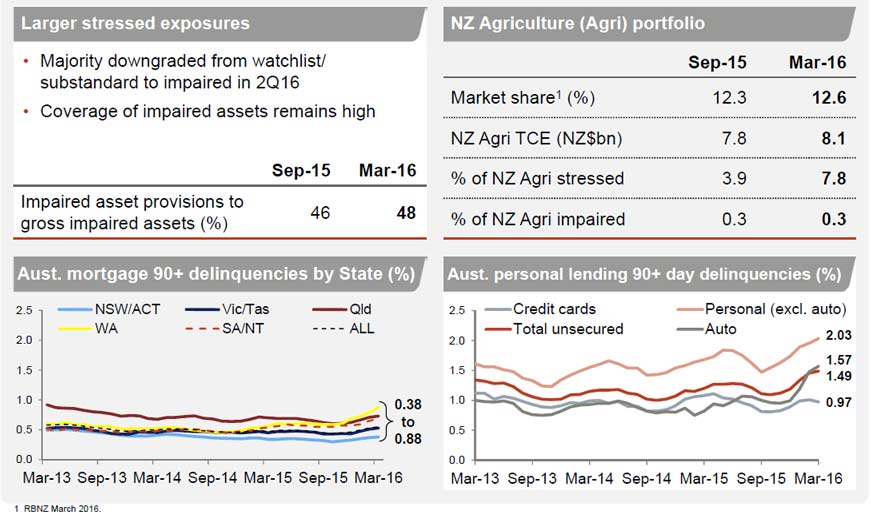 The credit quality of the Group’s portfolio was little changed since First Half 2015 with stressed exposures to total committed exposures of 1.03%, down from 1.12%. But Westpac Institutional Bank (WIB) was affected by lower net interest margins and significantly higher impairment charges related principally to four large exposures which added $252 million to provisions. Impaired assets remained low at 0.26% of total committed exposures, but was up 2 basis points over the year, while the provision coverage of impaired assets has remained high at 48%.
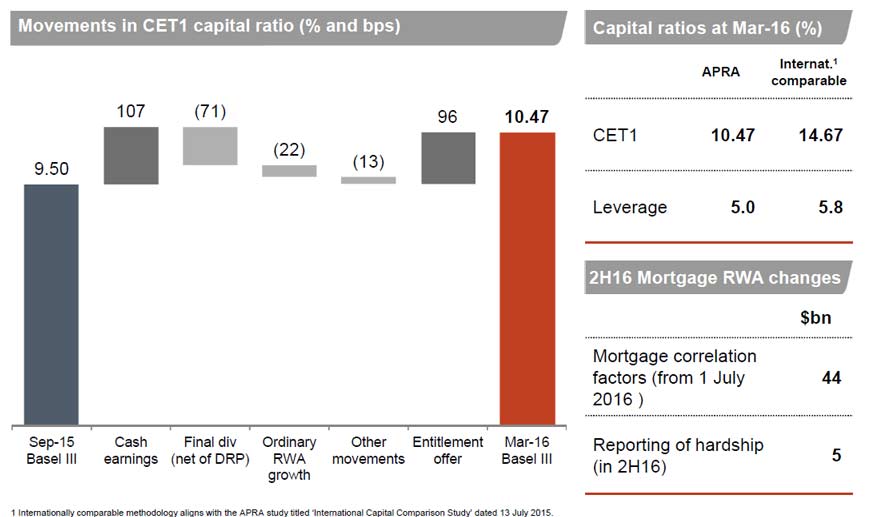
The Group raised around $6 billion in equity over calendar 2015, lifting the Group’s common equity Tier 1 ratio to 10.5%, up 171 basis points. On an internationally comparable basis, Westpac’s CET1 ratio was 14.7% and comfortably in the top quartile of banks globally.
 There were no new capital raising initiatives announced this time, but the impact of the earlier entitlement offer can be seen in the results – lifting the capital ratio by 96 basis points.
 Looking at the segmentals:
- Consumer Bank continued to grow the value of the franchise, with more customers and above system lending growth contributing to a 15% rise in core earnings and a 16% rise in cash earnings. However, the impact of higher capital for mortgages reduced returns in this business. The business has continued to invest in improving service by transforming the network through the upgrade of 22 branches over the half, enhancements to self-serve options including more Smart ATMs, and increasing the functionality of its online platforms. We discuss the Australian mortgage book below.
- Business Bank grew core earnings by 5%, with good growth in lending. Non-interest income grew 3%, mostly through higher merchant revenue supported by the roll-out of new state-of-the-art payment terminals. Cash earnings were lower, down 3%, due to higher impairment charges. While asset quality has improved, a reduction in write-backs and an increase in auto delinquencies contributed to a $118 million increase in impairments.
- BT Financial Group continues to be a leading provider of wealth solutions in Australia, with a Funds Under Administration (FUA) share of 19.6%. BTFG saw cash earnings little changed over the year with business growth offset by a reduction in Funds Management earnings mostly due to lower markets and the partial sale of BTIM in Second Half 2015. The business continued to benefit from good flows into FUM and FUA, while continued success in Private Wealth has seen lending increase 8%. Insurance has also continued to expand with Life in-force premiums up 12%.
- Westpac Institutional Bank delivered cash earnings of $517 million, down $136 million. The lower result was driven by a $201 million increase in impairment charges, a reduction in fund performance fees, and lower margins. The division maintained its leading market position, growing customer numbers and generating good flows in FX. However, the more challenging market conditions from high levels of global liquidity continues to place pressure on margins. While asset quality was maintained, including a further reduction in stressed assets, downgrades to a small number of exposures was the main contributor to the higher impairment charge.
- Westpac New Zealand’s cash earnings were up 2% to NZ$445 million. The business has continued to grow broadly in line with system while steadily expanding its wealth and insurance business. However, intense competition for new lending and a shift to lower spread fixed rate mortgages has compressed margins. Notwithstanding deteriorating financial conditions in the dairy sector, asset quality has remained sound and consumer delinquencies remain near historic lows, contributing to continued low impairment charges.
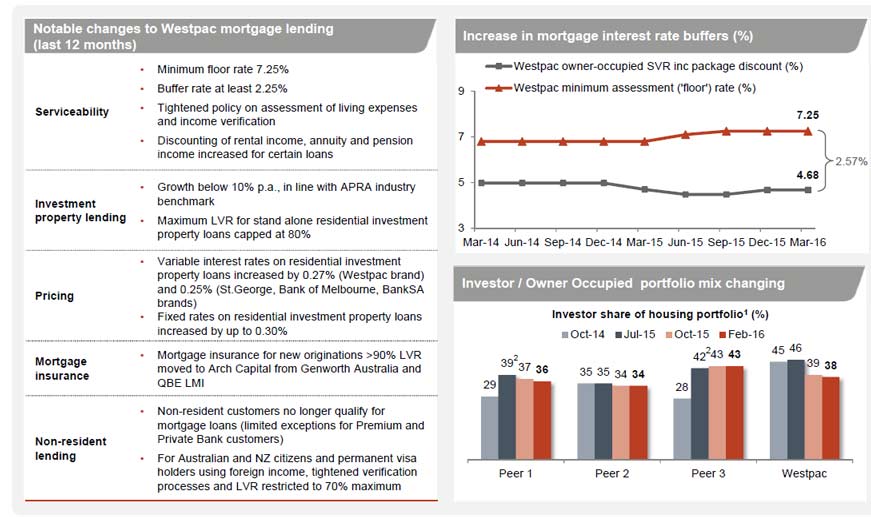
Finally, we look at the Australian mortgage book, because this is such a large part of the banks business. Lending standards have been tightened. We see considerable growth, with a reduction in investment loans – after adjustments to 7.2% from 9.9% in September 2015.
 They provided some detail in the portfolio, with 94% of the portfolio with a dynamic LVR of below 80% and 72% of borrowers ahead with repayments (many because they have an offset account). A greater flow of mortgages are coming via the broker channel ~50%. The average loan size is still rising and the average LVR falling a little. Actual mortgage losses are stilling at 2 basis points.
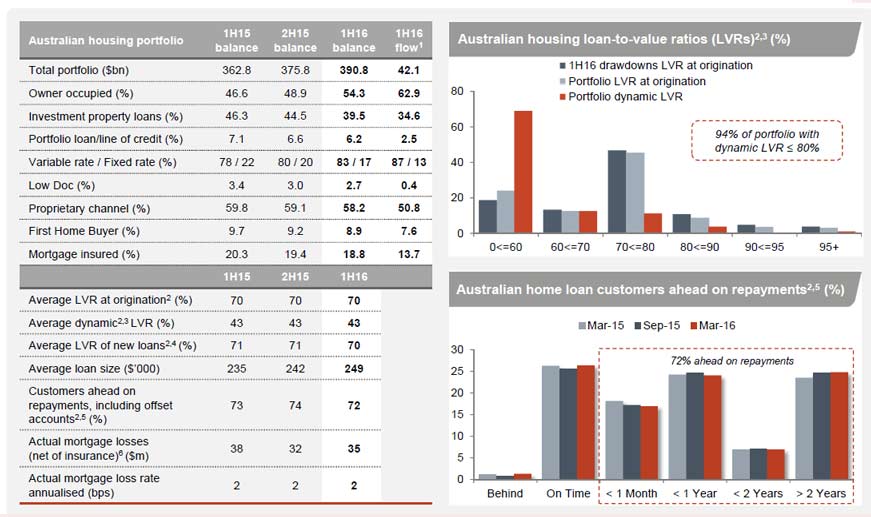 Looking at the investment portfolio, the average LVR of new loans is now 67%, down from 70% 1H15. The +90 day delinquency rates are at 38 basis points, compared with 31 basis points in 2H15. 62% of households are ahead with repayments (including offsets), down from 65% in 2H15.
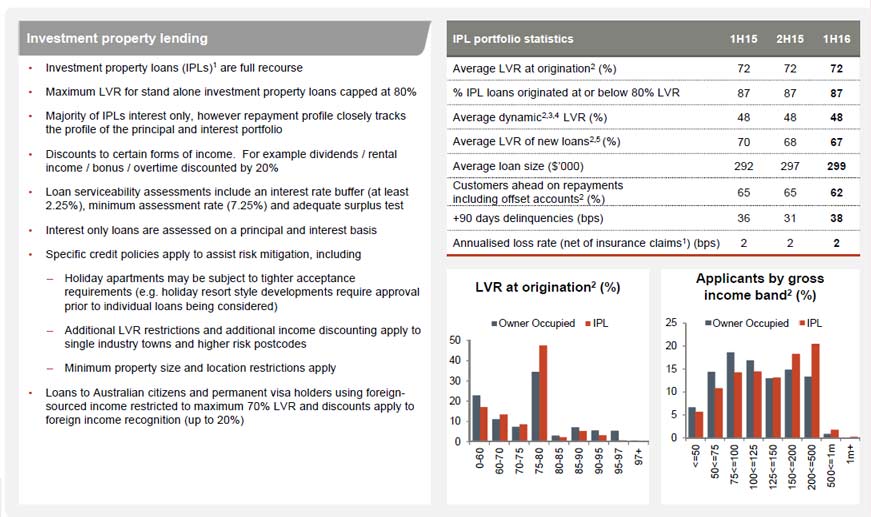 Westpac is now working on a minimum floor rate of 7.25% and they have tightened serviceability criteria and have stopped lending to most non-resident customers.