Modest Decline in March New Home Sales

The HIA New Homes Sales Report – a survey of Australia’s largest home builders – shows a modest decline in total new home sales during March 2017.

Amongst the jurisdictions surveyed, NSW was the only state to record an increase in detached house sales in March, posting a 10.4 per cent rebound after a soft result in February. Detached house sales fell by 4.6 per cent in Victoria, by 5.4 per cent in Queensland and fell in South Australia and Western Australia fell by 1.7 per cent and 1.2 per cent respectively.

“New home sales across the country eased by around 1.1 per cent in March 2017,” said HIA Economist, Geordan Murray. “The decline was more evident in detached house sales which were down by 1.4 per cent in March. Sales of ‘multi-units’ eased by only 0.1 per cent in the month.

“With residential building activity having peaked at a record level in 2016, industry spectators are watching leading indicators closely to assess where activity may be headed in the next phase of the cycle.

“In particular, there has been a high degree of speculation about the trajectory of activity in the multi-unit market given the unprecedentedly large role it has played throughout the upside of the cycle. The new home sales survey shows that sales have been sustained at a relatively high level though to March this year.

“Similarly, detached house sales are indicating only a slight downward trend. This is consistent with other data on building approvals and dwelling commencements,” concluded Geordan Murray.

Short Supply Forces Land Prices to Rise Again – HIA

Australia’s residential land market showed signs of increased supply pressures during the closing quarter of 2016 according to the latest HIA-CoreLogic Residential Land Report published today by the Housing Industry Association and CoreLogic.

According to the latest HIA-CoreLogic Residential Land Report, the weighted median land lot price rose by 4.8 per cent to $254,406 during the December 2016 quarter – 9.3 per cent higher than a year earlier. Today’s report also indicates that the estimated number of land lot sales across Australia totalled 10,756 during the final quarter of 2016 – down by 22.7 per cent compared with the previous quarter and 39.5 per cent lower than a year earlier.

Based on land transactions during the December 2016 quarter, the annual pace of residential land price growth was strongest in Melbourne (+16.3 per cent), followed by Sydney (+10.7 per cent) and Adelaide (+10.3 per cent). Over the same period, Perth’s residential land market experienced the weakest price growth (+0.9 per cent) with modest land price increases affecting Brisbane (+5.4 per cent) and Hobart (+3.1 per cent).

“The volume of residential lot transactions appears to have dipped sharply during the December 2016 quarter, placing pressure on land prices,” remarked HIA Senior Economist, Shane Garrett.

“With land being such a crucial ingredient in new home supply more challenging cost conditions in the market for residential land in 2017 will make the battle to improve housing affordability more difficult.

“We need to make it easier and less costly to deliver additional stocks of shovel-ready residential land to market. This can only be done by tackling planning delays in zoning and subdivision, releasing government-held land and improving funding mechanisms for housing infrastructure,” concluded Shane Garrett.

According to Eliza Owen, CoreLogic’sCommercial Research Analyst, “The continued fall of sales volumes against sustained value increases suggests demand is outstripping the available supply of vacant residential lots. This is particularly evident in Melbourne, where the value of lots experienced the highest growth of all capital cities in the year to December (16.3 per cent). Sales volumes in the city fell 15.2 per cent in the six months to December 2016.

“The median lot value in Melbourne is still lower than Sydney, which has consistently maintained the highest median lot price of the capital city markets. With a median vacant lot price of $455,000 this accounts for approximately 45 per cent of the median Sydney house price at the December quarter, assuming the median house was on the median lot. This median lot value has increased a staggering 65 per cent over the last five years.

“With housing affordability high on all government’s agenda, and an increasing concern for households, particularly in Sydney and Melbourne, more attention must be paid to how increased supply of residential land could help ease demand,” concluded Eliza Owen.

The Answer to our Housing Affordability Challenge is Housing Supply – HIA

The HIA makes some good points about the need for a credible land planning body to provide national monitoring and forecasting of future land release and housing requirements to address housing affordability; but ignores the important point that supply is actually NOT the key issue, because average number of people per property has remained the same as the mortgage loan growth and house prices have risen. Other factors are at work.

Australia needs supply not demand focused solutions to address our national affordability challenges, said the Housing Industry Association.

“Attempts to remove demand for new housing will reduce supply, affordability and jobs,” said HIA’s Deputy Managing Director, Graham Wolfe.

“While several measures announced today by Labor to address Australia’s housing affordability challenges provide a sensible approach to increasing supply of new homes, others targeting demand will have an adverse impact on affordability now and into the future,” said Mr Wolfe.

“We can’t address housing affordability nationally with both eyes solely on Sydney and Melbourne,” said Mr Wolfe. “Sydney house price increases have been driven by many factors, including significant population growth, a ten-year supply recession, low interest rates and the impact of extremely high stamp duty costs on sales in the established housing market.”
“The dynamics in Perth, Adelaide, Northern Queensland and Darwin are very different. Foreign investors and self-managed superannuation fund investors cannot be blamed for the recent fall in house prices in Perth and Darwin, or the slower level of new housing activity in Adelaide. Inflicting demand side measures on these capital cities ignores the significant negative impact on housing supply, jobs and economic growth in these economies.

“Right now, if foreign capital investment in Australia helped bring significant residential development projects to commencement in Perth, creating jobs and production, the Western Australian economy would be much better for it.
“Australia needs a credible land planning body to provide national monitoring and forecasting of future land release and housing requirements. The body would help to inform government policy on financing, infrastructure and demographics.

“Other policies to address housing affordability must include a reduction in the imbedded taxation on new housing, government funding to support infrastructure and reforms to address unnecessary planning delays in bringing new residential developments to market.

“Our national housing affordability challenge is complex, and necessitates a national ‘cost of housing’ inquiry to identify impediments to the supply of new housing. Such an inquiry would bring together the overlapping impact of regulations, taxes and barriers imposed by all three levels of government, and importantly, inform governments in developing cohesive, integrated and responsible housing reforms, measures and programs,” concluded Mr Wolfe.

HIA Housing Affordability

Turning falling home prices into good news is quite an art, but one which HIA managed in their release today!

The latest HIA Affordability Report indicates that there has been a steady improvement in housing affordability during the opening months of 2017.

The largest improvement in housing affordability during the March 2017 quarter occurred in Perth (+5.6 per cent), followed by Hobart (+5.3 per cent) and Sydney (+5.0 per cent). Smaller gains in affordability affected the markets of Brisbane (+0.6 per cent) and Melbourne (+0.4 per cent). Of the capitals where affordability declined, the biggest fall was in Canberra (-7.2 per cent) followed by Adelaide (-4.0 per cent) and Darwin (-0.1 per cent).

The HIA Affordability Index results for the March 2017 quarter indicate that conditions are most challenging in Sydney, which has the lowest score (57.5), followed by Melbourne (70.7) and Canberra (78.5). The fourth most difficult capital city for affordability is Brisbane (86.8) with Darwin in fifth place (89.5) and Adelaide in sixth (90.5). By a wide margin, Hobart (113.9) remains the most affordable capital city in Australia followed by Perth (99.5).

“During the March 2017 quarter, the HIA Affordability Index improved by 1.9 per cent – and is 1.2 per cent better than this time last year,” commented HIA Senior Economist, Shane Garrett.

“The improvement in affordability is mostly due to a reduction in the national median dwelling price during the March 2017 quarter,” said Shane Garrett.

“Despite these latest results, housing affordability remains a significant challenge. There are good ways to improve affordability – and bad ways. The right approach to tackling affordability is through continuing
to secure the delivery of an appropriate supply of new homes and to reduce the barriers and costs involved in doing this,” explained Shane Garrett.

“With respect to delivering better housing affordability outcomes over the longer term, this week’s comments by the Treasurer in relation to leveraging private investment for affordable housing stock are very welcome,” concluded Shane Garrett.

Static New Home Sales in February

There was little movement in total New Home Sales in February, but Western Australia and Victoria enjoyed positive results, said the Housing Industry Association.

Detached house sales increased in two out of five mainland states in February 2017 – Western Australia and Victoria. Detached house sales in WA increased by 11.3 per cent in February 2017 following a rise of 12.1 per cent in January. Note that these rates of growth are exaggerated by the extremely low base for detached house sales. Detached house sales in Victoria posted a monthly gain of 5.1 per cent in February. Elsewhere for the mainland states, in February detached house sales fell by 12.6 per cent in New South Wales and were down by 5.7 per cent in Queensland and 0.2 per cent in South Australia.

“The HIA New Homes Sales Report – a survey of Australia’s largest home builders – reveals a bare movement of only +0.2 per cent in February 2017,” said HIA Chief Economist, Dr Harley Dale. “There was also very little movement in the two sub-series with detached house sales ticking down by 0.1 per cent in February and the sales of ‘multi-units’ growing by 1.0 per cent.”

“The profiles for HIA detached house sales and ABS detached house building approvals are very similar. In the case of detached house sales, over the three months to February this year the volume fell by 2.2 per cent to a level 5.2 per cent lower than achieved over the three months to February last year,” noted Harley Dale.

“The updates that we are receiving for these two key leading indicators of new home building activity are consistent with a modest reduction in national new detached house commencements in 2016/17. We are forecasting a decline of 2 per cent in detached house commencements in Australia in 2016/17 following a similar-sized fall of 1 per cent in 2015/16.”

“As with all aspects of the current housing cycle there are large differences in conditions for detached housing between states and territories. HIA’s detached house sales series for the five mainland states has been consistently highlighting this point for some years now,” concluded Harley Dale. “In 2017 we expect the profile for leading indicators such as detached house sales to slowly improve for Western Australia and South Australia. At the same time the volume of detached house sales on the eastern seaboard is expected to trend lower.”

Home Renovations: Australia’s Next Building Boom?

The latest edition of the HIA Renovations Roundup report predicts that home renovations will become an increasingly important part of the residential building industry over the next few years.

According to the March 2017 edition of the HIA Renovations Roundup report, renovations activity grew by 2.7 per cent in 2016 to $33.06 billion. The pace of growth is projected to slow to just 0.3 per cent in 2017, before reaching 3.2 per cent in 2018. Further growth in 2019 (+2.4 per cent) and 2020 (+2.5 per cent) is expected to bring the value of home renovations activity in Australia to $35.94 billion.

“2016 marked the strongest year since WWII for new home building starts in Australia but our forecasts indicate that activity is set to decline on this front over the next three years,” commented HIA Senior Economist, Shane Garrett.

“In this context, our industry will become more dependent on work related to home renovations activity. Many are surprised to learn that renovations currently account for about one third of all residential building work. By the end of the decade, renovations activity is likely to represent some 42 per cent of all residential building activity.”

“Detached house building in Australia reached very high levels between 1985 and 1995. This large stock of homes is becoming increasingly ripe for major renovations work. Added to the mix are remarkably low interest rates and the big home equity windfalls in Sydney and Melbourne – pretty ideal conditions for renovations demand.”

“At the moment, the one key difficulty for the renovations market is the fact that turnover in the established house market is falling. This is an important driver of demand, and prospects for renovations growth would be even stronger if transactions on this side of the market started to increase again,” concluded Shane Garrett.

We would make the point that with incomes static, and mortgage rates on the rise, household incomes will be under more pressure. As a result some may choose not to move but renovate, but will they have the means to pay for it?

ABS Confirms Property Price Rises

From The HIA.

ABS data released today confirms acceleration in the rate of growth in residential property prices in late 2016, said the Housing Industry Association.

In the year to the December 2016 quarter, dwelling price growth remained fastest in Melbourne (+10.8 per cent), followed by Sydney (+10.3 per cent). Dwelling prices also grew over the year to the December 2016 quarter in: Tasmania (+8.8 per cent); the Australian Capital Territory (+5.5 per cent); and Queensland (+3.8 per cent). Dwelling prices continued to decline in Western Australia (-4.1 per cent) and the Northern Territory (-7.0 per cent).

“This result for the December 2016 quarter shouldn’t surprise anybody. Nor should the large divergence in growth rates between Australia’s eight capital cities,” said HIA Chief Economist, Dr Harley Dale.

“The growth rate for attached dwelling prices is far slower than for existing houses, while Sydney and Melbourne price growth is way of ahead of other markets,” noted Harley Dale. “Sydney and Melbourne represent 40 percent of Australia’s population and some concern regarding the trajectory of house price growth in these two markets is warranted. Elsewhere, people still scratch their heads when it comes to a supposed housing price ‘boom’ because that simply hasn’t been their experience this cycle, even allowing for some recovery in prices in recent times.

“On the same day as we have received an update on dwelling prices there has also been speculation regarding some tension between members of Australia’s Council of Regulators, plus an (appropriate) questioning of banks’ out of cycle interest rate hikes.”

“People can make of that what they will, but let’s not lose sight of the main goal. Yes, there is some need to tighten lending conditions for some Australian housing markets in terms of geographical areas and dwelling types,” concluded Harley Dale. “However, a blanket tightening of lending conditions – as now seems to be emerging again – is the wrong policy and risks damaging Australia’s financial stability. That is the very opposite to the ideal outcome authorities want to achieve.”

New Home Lending falls back in January

Figures released today by the ABS indicate that the volume of loans for new homes eased back during January, said the Housing Industry Association.

During January 2017, the total number of owner occupier loans for the purchase or construction of new homes fell by 1.0 per cent and was 0.4 per cent lower than a year earlier. The volume of loans for new home purchase declined by 0.3 per cent during January with lending for the construction of new dwellings dipping by 1.4 per cent.

In January 2017 the number of loans to owner occupiers constructing or purchasing new homes increased in three states. Compared with January of last year, the volume of loans rose most strongly in Queensland (+13.1 per cent), followed by South Australia (+9.2 per cent) and Victoria (+8.8 per cent). The largest reduction occurred in Western Australia (-9.3 per cent), followed by Tasmania (-3.5 per cent) and New South Wales (-1.2 per cent). The volume of lending rose by 22.1 per cent in the ACT but was down by 54.8 per cent in the Northern Territory over the same period.

“Despite the reduction during January, the actual volume of loans for new homes remains at a very elevated level – about 99,620 loans were made over the year to January 2017,” noted HIA Senior Economist Shane Garrett.

“There are two dynamics going on with respect to new home loans. With 2016 representing the strongest year for new dwelling starts since the end of WWII, a huge number of new homes are now becoming available for purchase making lending volumes in this area accordingly high. However, the number of loans to people constructing their own home has actually been falling back since mid-2014 and this trend has affected overall lending activity,” Shane Garrett concluded.

Dwelling approvals continue to fall in January

The number of dwellings approved fell 2.1 per cent in January 2017, in trend terms, and has fallen for eight months, according to data released by the Australian Bureau of Statistics (ABS) today.

Here is the data charted by the HIA. They say “new dwelling approvals have been falling back over the past year, particularly due to a reduced inflow of new multi-unit projects”.

In trend terms, dwelling approvals decreased in January in the Australian Capital Territory (19.4 per cent), Queensland (6.8 per cent), New South Wales (4.8 per cent), Northern Territory (1.7 per cent) and Western Australia (0.3 per cent). Dwelling approvals increased, in trend terms, in Tasmania (3.0 per cent), Victoria (2.9 per cent) and South Australia (1.1 per cent).

In trend terms, approvals for private sector houses fell 1.2 per cent in January. Private sector house approvals fell in New South Wales (2.2 per cent), South Australia (1.4 per cent), Western Australia (1.4 per cent), Queensland (1.0 per cent) and Victoria (0.3 per cent).

In seasonally adjusted terms, dwelling approvals increased by 1.8 per cent in January, driven by a rise in total dwellings excluding houses (6.6 per cent). Total house approvals fell 2.2 per cent

The value of total building approved fell 2.9 per cent in January, in trend terms, and has fallen for six months. The value of residential building fell 0.9 per cent while non-residential building fell 6.8 per cent.

Future Housing Starts Lower

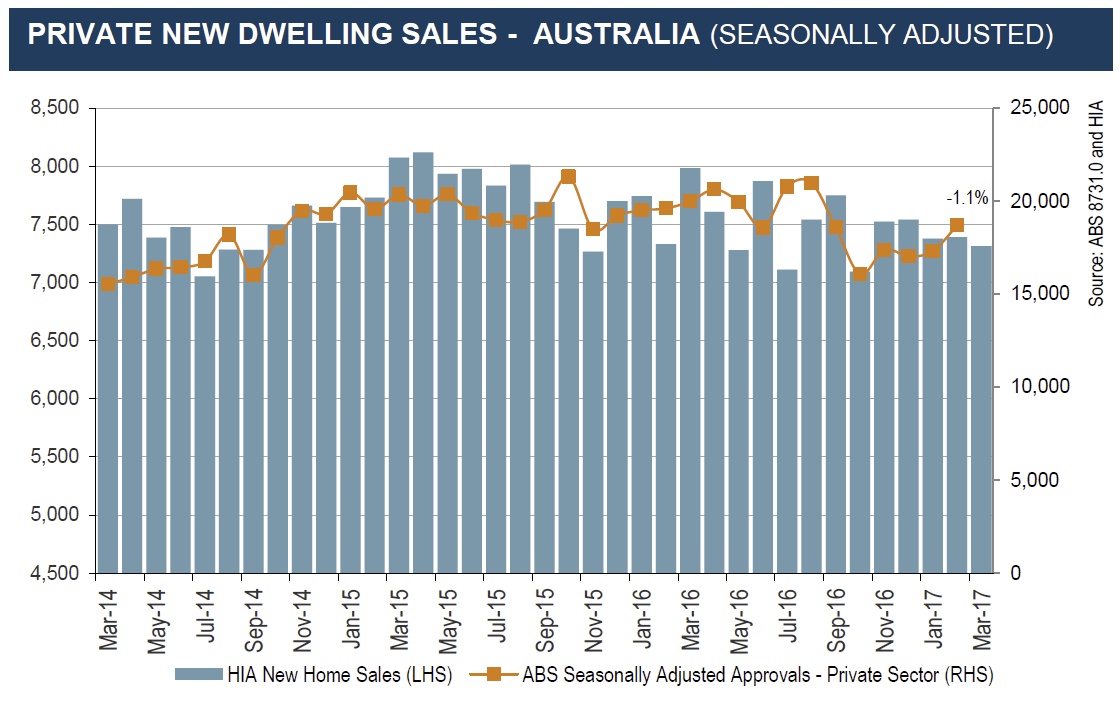
According to the Housing Industry Association, during the year ended September 2016, there were over 229,000 dwellings that commenced construction. While this is still an exceptionally high level of activity based on historical experience, the annualised level of commencements has eased since peaking at over 231,000 in the year ending in the March 2016 quarter. This is supportive of HIA’s view that the current new residential building cycle is likely to have peaked in 2016.

Detached houses

Despite the decline in the total number of commencements, the detached house segment of the market has proven resilient.

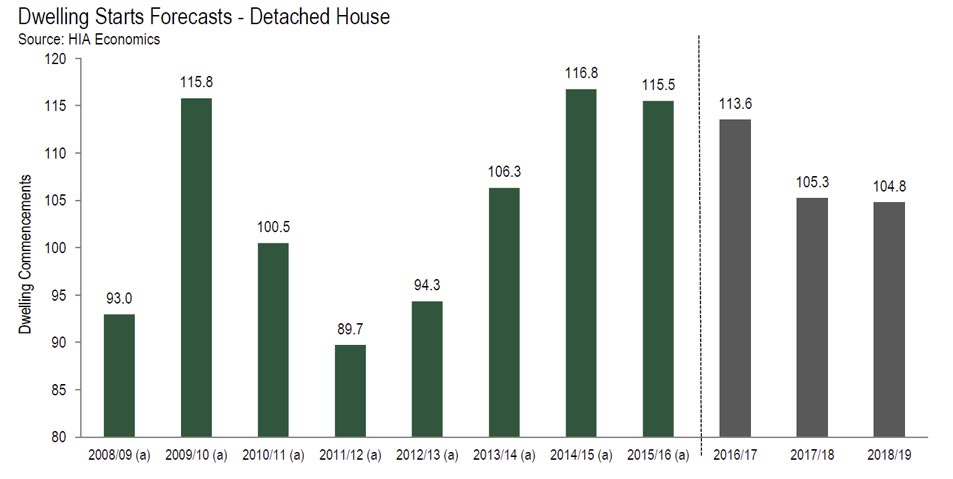
There were 29,634 detached houses commenced during the September 2016 quarter, which makes a total of 115,953 commencements in the year up to this point.

The prevailing dynamics in the detached house market during 2015/16 were a marked contraction in the level of activity in Western Australia counter balancing the ongoing resurgence in the Victorian and New South Wales markets. While there were variations in other state and territory markets, when we take a national perspective these two factors eclipsed the rest. However, we are now well into 2016/17 and approaching a new phase of the cycle which will have a fresh dynamic. The headwinds afflicting WA may soon subside and Sydney and Melbourne’s time in the sun may be drawing to a close.

From a national perspective, detached house commencements are forecast to ease by 1.7 per cent in 2016/17 ahead of a further decline of 7.3 per cent in 2017/18. After falling to a low of 104,800 starts in the 2018/19 year, the level of detached house building is forecast to gradually improve across the out years of the forecast horizon.

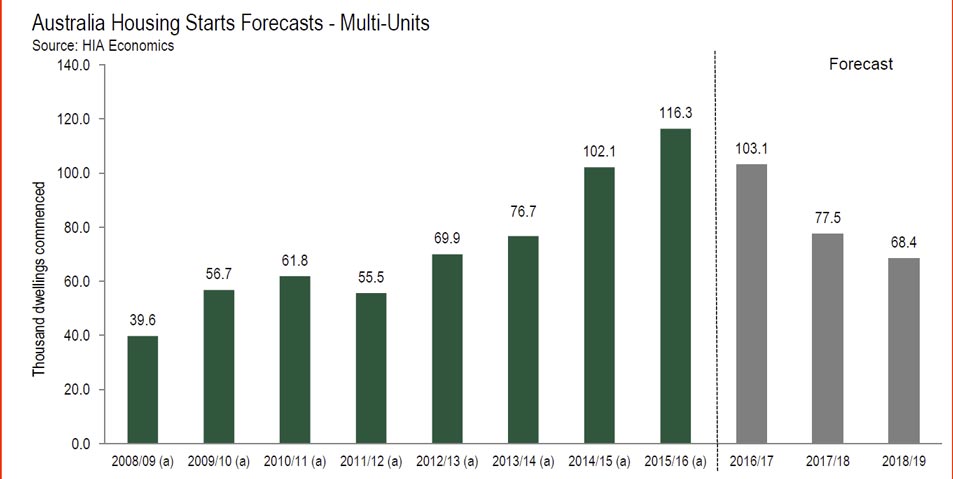
Multi-unit dwellings

The ‘multi-unit’ market has weakened overall. After a very strong result in the March 2016 quarter, the number of multi-unit commencements fell away quite sharply throughout the middle of the year.

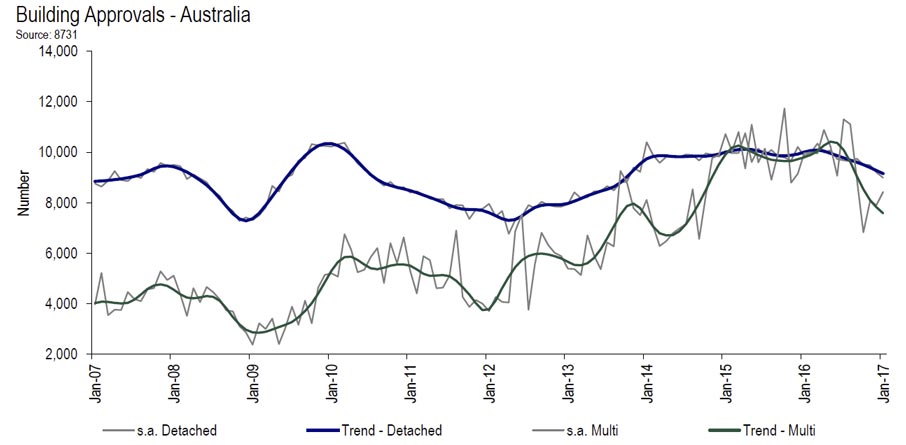
However, there are markedly different trajectories for the semi-detached market (including townhouses, row and terrace type dwellings) and the market for apartments in buildings of four or more storeys.

The number of commencements for semi-detached dwellings continued to grow throughout the year. In contrast, the number of commencements for apartments in high-rise developments slowed as activity in Victoria and Queensland eased. The flow of new apartment projects getting underway in New South Wales has remained more buoyant and there is a record level of apartments in developments awaiting commencement.

In aggregate, there were a total of 25,202 multi-unit dwellings commenced in the September 2016 quarter, which is equivalent to 113,383 across the full year. HIA is forecasting that multi-unit dwelling commencements will remain at quite a high level in the 2016/17 financial year, albeit with an annual decline of 11.3 per cent. Looking beyond 2016/17 is when we anticipate commencements will post more significant declines. Multi-unit commencements are forecast to decline by around 25 per cent in 2017/18, and then by a further 12 per cent in 2018/19. The 2018/19 year is projected to be the low point of the cycle for multi-unit commencements, when 68,400 starts are forecast to occur.