APRA released their Monthly Banking Statistics for April 2015 today. The total home loans outstanding on the bank’s books reached $1.346 trillion, up from $1.336 trillion last month. Overall growth in the portfolio was 0.74%, with owner occupied loans sitting at 0.6% up, and investment loans 1% higher. This is before the regulatory taps were turned.
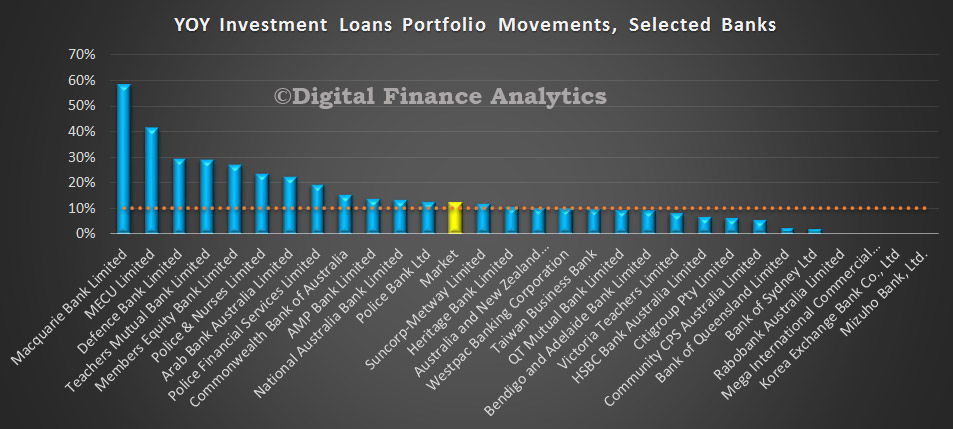
We will this month concentrate on the home loan portfolio, because it is of the most significance just now. First, lets look at the APRA “hurdle” of 10% market growth. Now there are a number of different ways to calculate this important number. Some have chosen other methods which understate the true picture in our view. We have chosen to calculate the sum of the monthly moving averages, and the results are displayed below. A number of players are well over the 10% line, and might expect a “please explain” from the regulator. Officially, they have a little time to get into line by the way. Some players of course are subject to non-organic growth, and this will distort some of the figures.
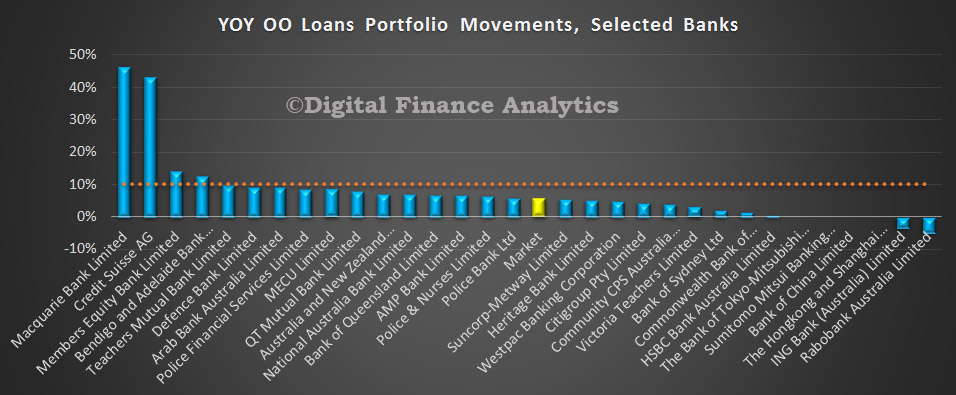
 In contrast, the OO portfolio (not subject to the 10% rule) also makes quite interesting reading. In both cases some of the smaller organisations are making hay and expanding quite fast. We hope they have their underwriting and approval processes set right!
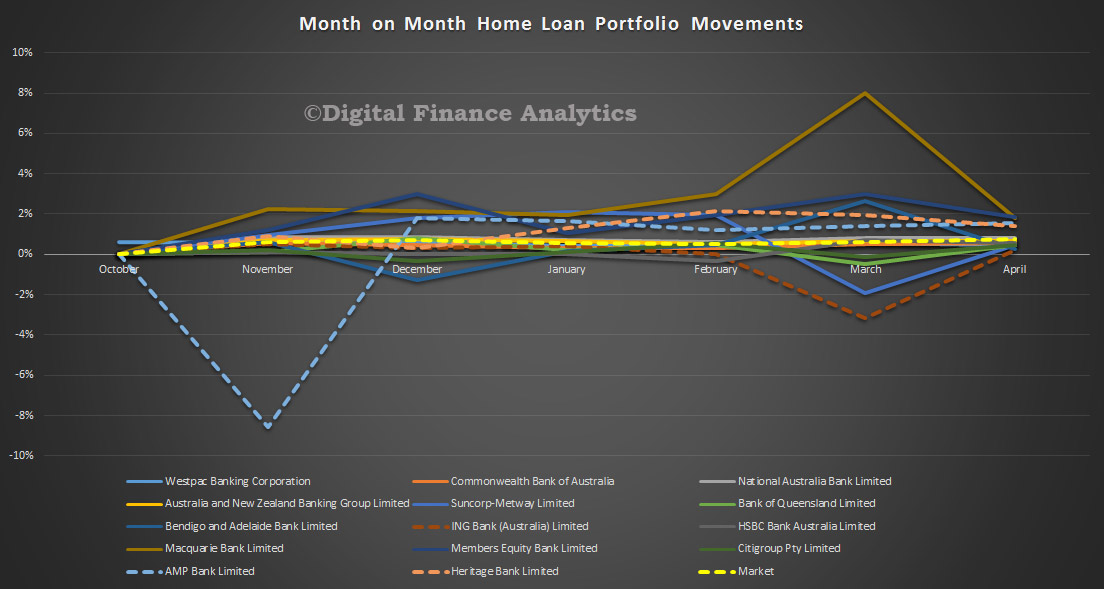
 Next, a view of the monthly portfolio movements for both OO and INV loans.
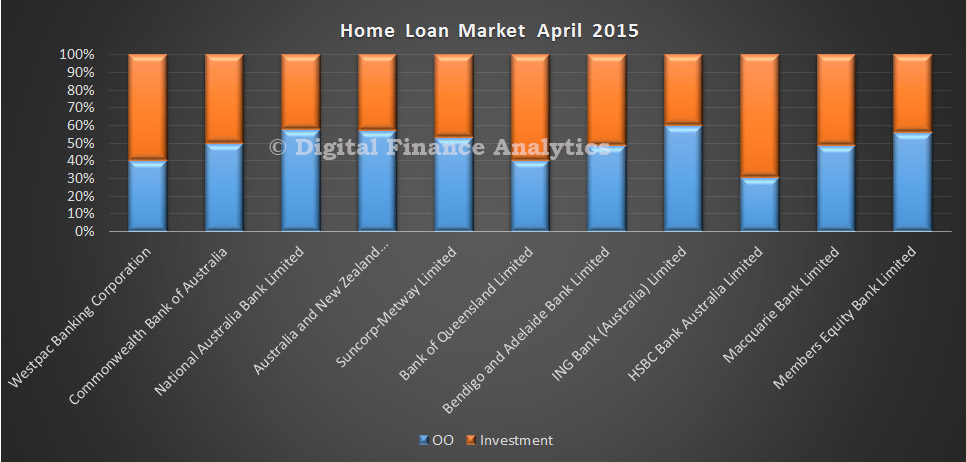
 Finally, a picture of the relative shares of home loans, both investment and owner occupied loans, by some the the main players (in volume terms).
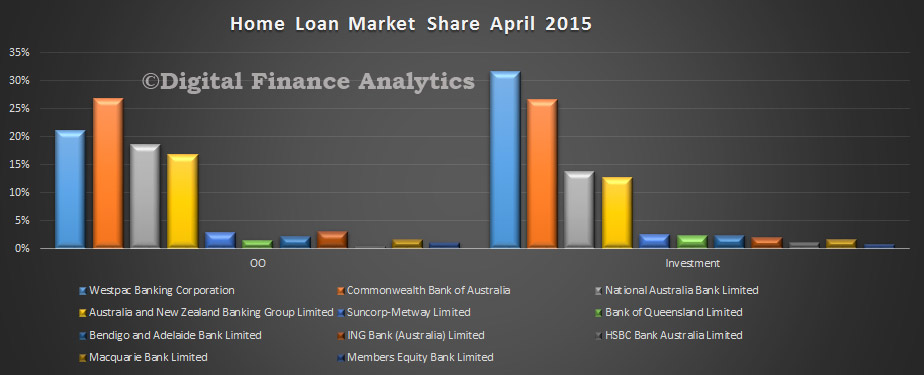 If you look at the relative distribution of OO and INV loans, you can see which players may have more to worry about is the regulatory tightening on investment lending gets more intense. Recent events from New Zealand are insightful here, with the proposal to lift capital requirements on investment loans. We covered this in an earlier post.
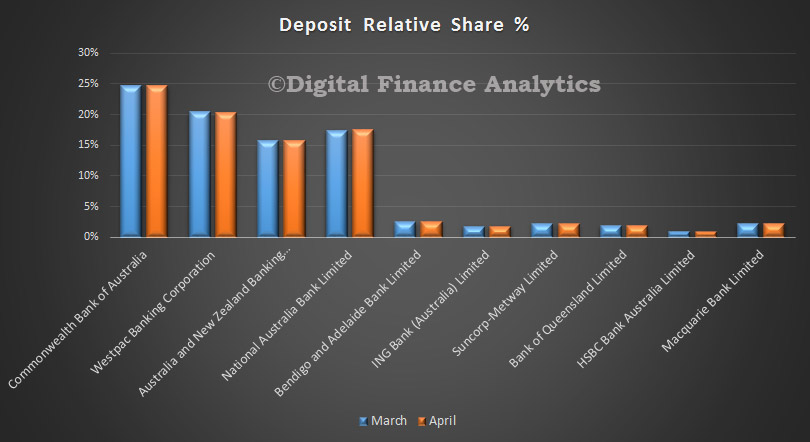
 Turning to Deposits, balances rose by $7 billion, to $1.8 trillion, an uplift of 0.38% from last month. Little change in the mix between major players. CBA maintains its pole position, although NAB grew its portfolio the fastest.
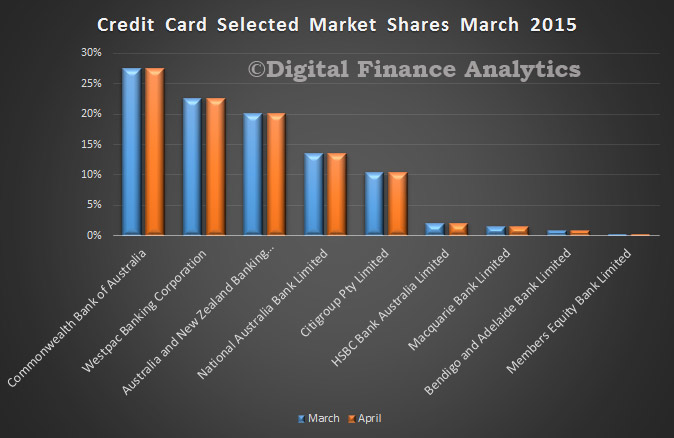
 In the cards portfolio, total balances fell slightly from $41.6 billion to $41.3 billion. Again little change in the mix between players, although CBA lost more than half of the value drop from its portfolio from March to April.