
Australia’s asset cycle has peaked, according to credit rating agency Moody’s Investor Services. And that means the risk weight capital our major banks hold will come under pressure.
The agency also says that the looming increase in risk weightings on the average mortgage risk weights as a result of the Australian banking regulator’s, APRA, edict that “risk weights for IRB banks will rise to at least 25%, from the current 15-18% level” will also put downward pressure on the majors CET1 (Common Equity Tier One) ratio’s.
The good news for the banks, their shareholders, and the Australian financial system is that Moody’s believes, based on its scenario and sensitivity analysis, that “the potential decline in the banks’ capital metrics as a result of changes to risk weights will be limited”.
Ilya Serov, Moody’s senior vice president, added in the report that:
Even in a highly stressed scenario, and before factoring in any potential for organic capital generation, the major banks’ CET1 ratios will remain above 8.0%, a level which is the combination of the regulatory minimum CET1 plus Capital Conservation and Domestic Systemically Important Bank (D-SIB) buffers.
That doesn’t guarantee the banks won’t have to raise more capital at some point. But it certainly suggests the work they have already done in raising capital in preparation for the changes in regulation will keep them above the 8% trigger level.
Under each of the scenarios Moody’s ran a comparison of the impact of the upper end of Australian banks 2009 experience when the corporate “impaired and past due exposure ratio” hit 2.5%. In the second scenario Moody’s took the average of the banks 2009 experience – as opposed to upper-end of experience as it’s base input. It then included the increase in mortgage weights into this scenario.
Moody’s says: “The key cyclical pressure on risk-weighted capital ratios will come from an upward revision in credit risk weights as asset quality weakens. This is a reversal of the situation which has existed since the GFC’s nadir in 2008/09 which with the ‘decline in the major banks’ CRWA, as asset quality improved after the global financial crisis, has been the primary organic driver of their improving risk-weighted capital ratios.”
While Moody’s stressed this was not a credit rating note in the end though the company still sounds pretty upbeat on the big banks capital positions.
“The moderate degree of deterioration in capital levels indicated by our sensitivity analysis is in line with our view that Australia’s major banks remain in a strong position to maintain their strong credit profiles against a likely weakening in their asset performance” Moody’s said.
Month: April 2016

A 21st century approach to dealing with failed banks
In a speech Sir Jon Cunliffe Deputy Governor for Financial Stability, Bank of England, urges regulators and banks to press ahead with implementing rules designed to enable banks to fail without the need for government bailouts. Jon says that a vast amount of work has been done to come up with better ways to deal with a failed bank and a better answer than ‘the taxpayer’ to the question of ‘who pays?
“I think it is possible to have a world in which large banks can fail in an orderly way – without the contagion and damage to the economy that in the past has forced the taxpayer to come in and absorb losses. But there is no single, silver bullet to achieve that; rather it requires the application of a comprehensive set of policy and powers.”
Jon declares that the UK is now in a much stronger position to deal with bank failures than it was in 2008, thanks to substantial progress on five key planks of reform: improved bank resilience; ensuring that authorities have the necessary powers and machinery to manage the failure of a bank; structuring banks so that they are resolvable; ensuring that banks are financed in a way that supports resolution, and international cooperation.
However, moving to an effective resolution regime will require a major transition, Jon warns: “Many larger banks will need to make changes to their structure and financing. There will inevitably be higher costs as the implicit public subsidy is removed. There is no free lunch.”
Jon observes there is evidence that the multipronged approach to addressing Too Big To Fail is already having an effect: ratings agencies have started to reduce their “government support” uplifts for big banks, while spreads between senior and structurally subordinated debt of UK Global Systemically Important Banks (G-SIBs) suggests that resolution regimes are gaining credibility.
“In part, this is a result of the entry into force of the BRRD, and in the UK the Bank’s consultation paper on the setting of the Minimum Requirement for own funds and Eligible Liabilities (MREL). But it has almost certainly been reinforced by other events that have brought the issue into sharper relief,” Jon notes, adding that one of the key benefits of ensuring that certain creditors can be bailed in is that those creditors have a much stronger incentive to monitor and, if necessary, constrain the risks banks are taking.
Nonetheless, the transition to an effective resolution regime needs to be carefully managed, which is why the Bank of England is pursuing an approach to resolution in the UK that is proportionate, gradualist and provides clarity to banks and their creditors.
“The resolution requirements for a bank should be what is necessary to deliver the resolution strategy for that bank – no more and no less,” according to Jon.
The Bank’s proposed approach to setting MREL is based on the judgement that large banks cannot be allowed to cease operating abruptly; they have to be stabilised and resolved over time. As a result, the bank needs to have enough debt that can be bailed in to restore its capital so it can continue to operate as an authorised firm while it is being resolved. Smaller banks that can more easily be separated need to hold resources to recapitalise only the parts of their business that provide critical economic services and that can be sold, while the remainder can go into insolvency. The very smallest institutions do not need to be kept in operation as an abrupt stop in activity should not generate contagion or damage the economy. Insolvency rather than resolution is the proportionate strategy and so they do not need bail in debt.
In keeping with the second key principle, gradualism, the Bank is proposing to allow the full four year transition period for banks to meet their MREL requirements. This will allow the market for MREL – eligible debt to develop and allow banks to smooth out their debt issuance, minimising issuance and interest costs.
Finally, banks and their creditors need to have clarity – both in relation to the requirements of the new regime and clarity as to their liability if things go wrong.
“This is not just a case of making sure that those that buy bank debt that can be bailed in realise the risks of the instruments they have purchased. It also means making sure that creditors understand the resolution strategy of the institution to which they have lent money. Unprotected depositors in institutions that have no bail in debt should be clear that in the event of trouble, they stand next in line after shareholders when it comes to absorbing losses.”
Jon concludes that while regulators cannot expect to insulate fully all institutions from all external shocks, the legal, financial and practical arrangements are in place to resolve banks of all sizes.
“But this will only be true if we implement the new regime on resolution fully. Both regulators and industry have an incentive to do so. If, next time there is a crisis, authorities face the same unenviable choice as in the crisis, if taxpayer bailouts cannot be avoided, then the case for breaking up banks and making them much, much simpler will be very hard to resist.”
“The powers, international standards and institutions are all in place. The authorities and the banking system have strong and common incentives to complete the implementation. It is in all our interests that we do so.”
Bank Home Lending Credit Growth Continues
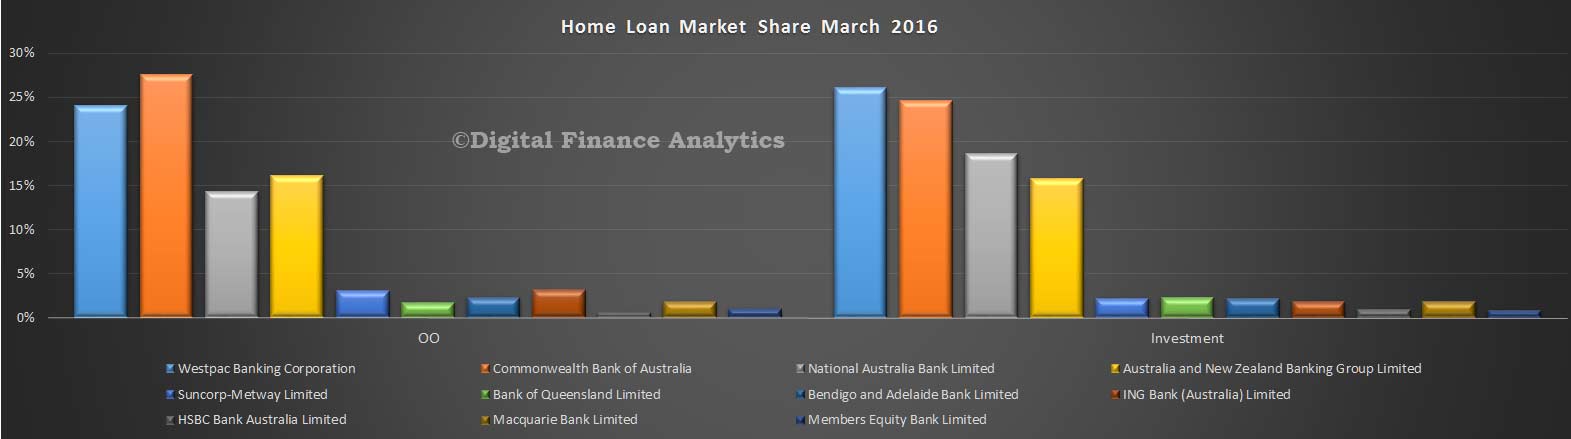
The latest data from APRA reporting home lending to end March shows total ADI balances grew by $9.5 bn to $1,441,253, a rise of 0.67% in the month, which is an annualised rate of 7.9%. Superficially, $8.2.billion was for owner occupation and $1.3 billion for investment home purchase but the RBA warned that $1.5 bn was due to loan reclassification between OO and INV loans so there is still noise in the system.
There was little net market share movement among the larger players. CBA still has the largest share of owner occupation loans, and Westpac of investment loans.
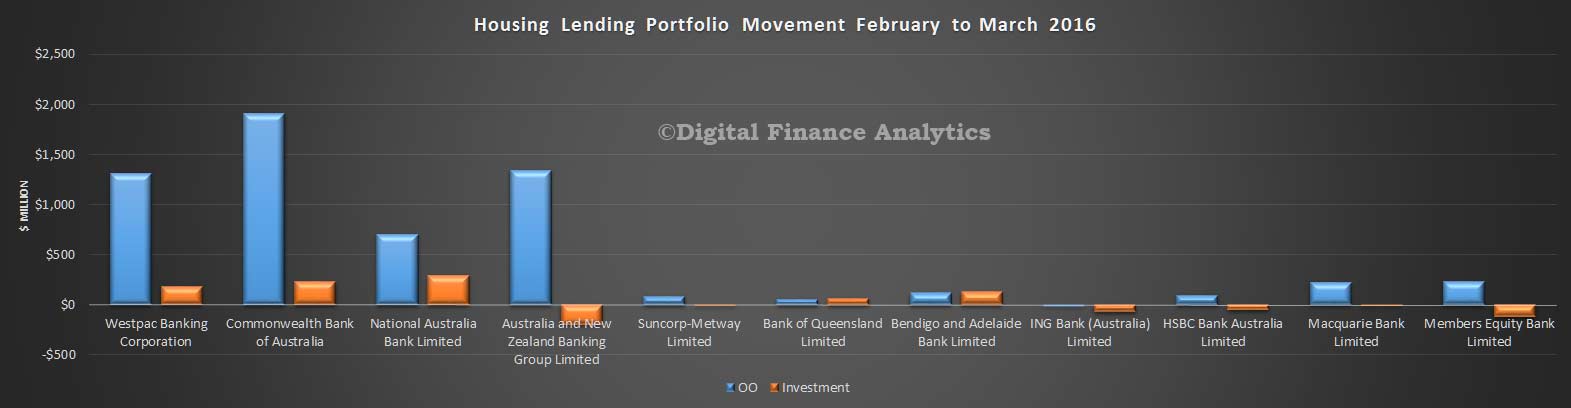
 The value of portfolio movements shows the focus on owner occupied lending, compared with investment loans. Perhaps.ANZ’s fall in investment loans could signal a reclassification?
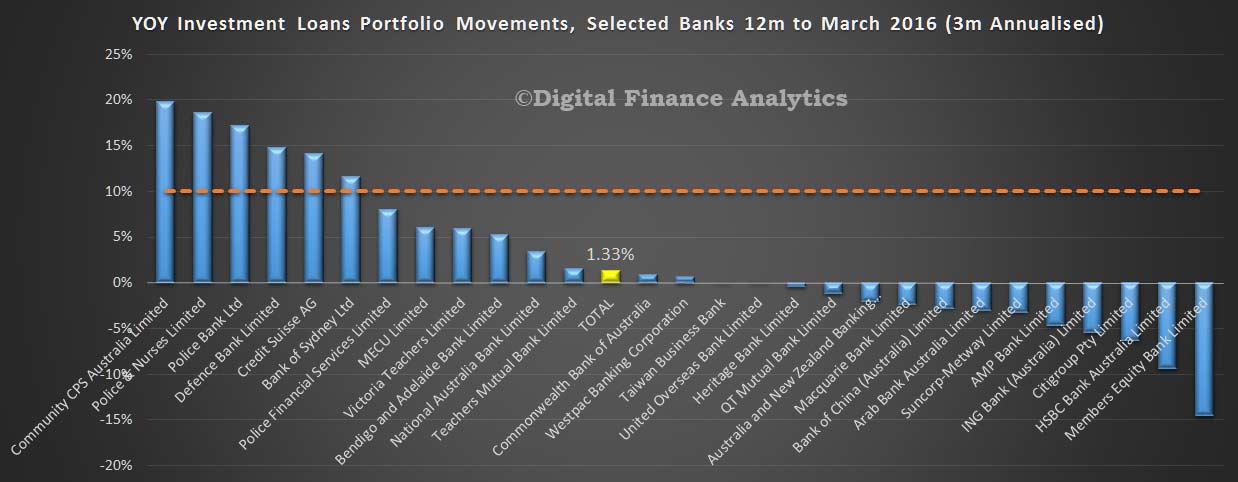
 Looking at the growth in investment loans in terms of the APRA 10% speed limit, calculating movements on a 3 month annualised basis, against a market movement of 1.33%, NAB has growth above system, whilst the other major players are below system. Some smaller players continue to write high volumes of investment loans.
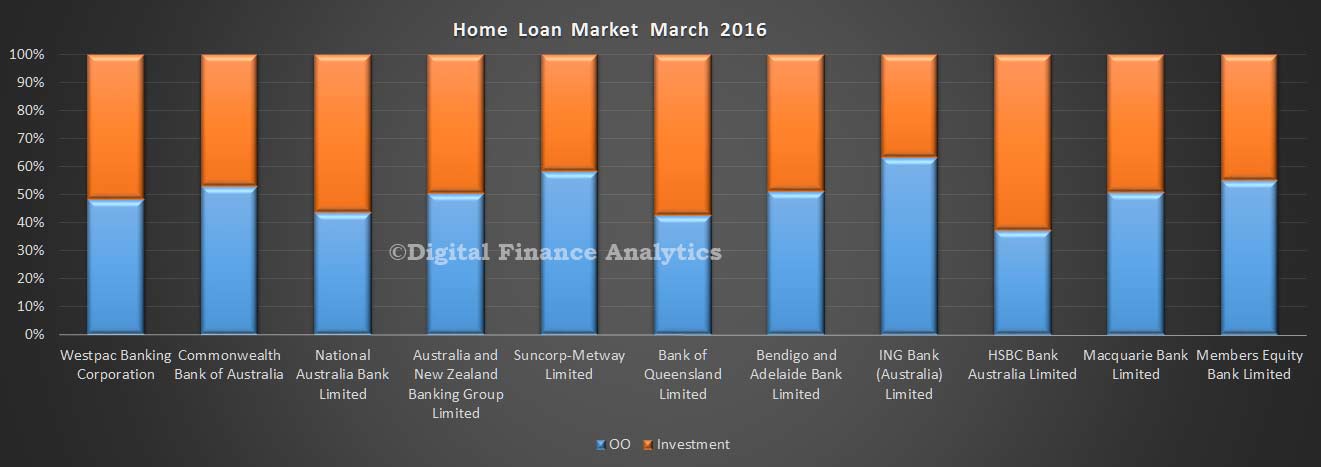
Finally we look at the relative share by loan type. This chart takes the relative percentages for owner occupied and investment loans by bank. It does not show the relative value, but the relative share (which we think is a more important lens).
 We will not post on the deposit or credit card portfolios as there is little to see this month.
OO Home Lending Drives Mortgages To A Record $1.55 Trillion
The RBA released their credit aggregates to end March today. Housing lending grew 0.5% in March and reflects an annual rate of 7.2% – well above inflation! Business credit grew by 0.3% or $2.6 billion (annualised 6.5%) and personal credit fell 0.3% or $0.6 billion, and represents an annualised fall of 1%. We are still not seeing real relative growth in the important business investment sector.
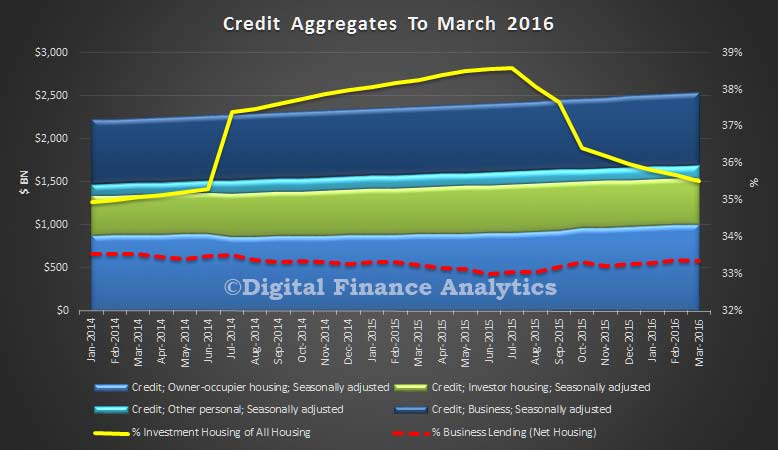 So, housing momentum is driving banks lending books. Seasonally adjusted lending for owner occupation grew 0.76%, or $7.5 billion, whilst lending for investment homes grew just 0.08%. Total growth was 0.5% or $7.7 billion to a new record of $1,547.6 billion. One third of loans are for investment purposes, though there is still some movement and reclassification. The RBA says:
Following the introduction of an interest rate differential between housing loans to investors and owner-occupiers in mid-2015, a number of borrowers have changed the purpose of their existing loan; the net value of switching of loan purpose from investor to owner-occupier is estimated to have been $39 billion over the period of July 2015 to March 2016 of which $1.5 billion occurred in March. These changes are reflected in the level of owner-occupier and investor credit outstanding. However, growth rates for these series have been adjusted to remove the effect of loan purpose changes.
Such strong growth in home lending will make the RBA pause for thought before they cut the cash rate again – household debt continues to sky rocket, at a time when incomes are static. Not a good formula for enduring financial stability. Cutting rates will have little impact on personal credit (which is still falling) or business borrowing (driven more by confidence and future prospective growth). This should temper the knee-jerk calls for a cut following the lower than expected inflation number earlier in the week.
We will post separately on the APRA numbers, also released today.
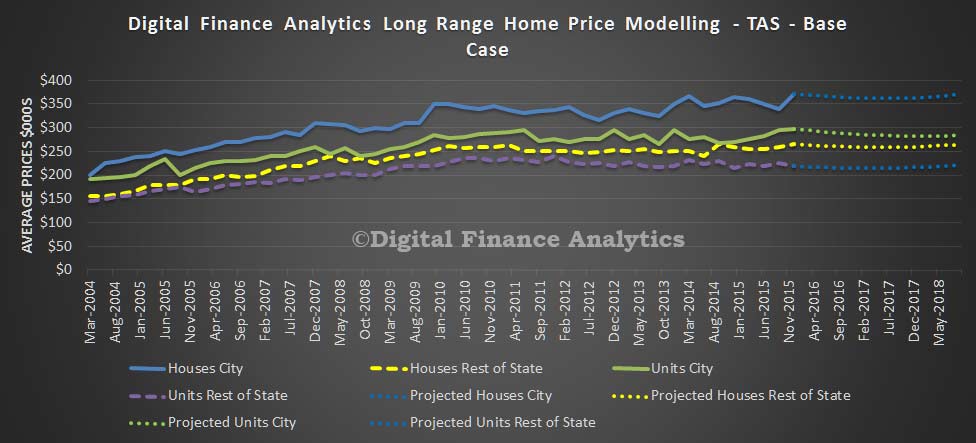
Where To With Hobart Home Prices?
As we continue our state by state scenario analysis – read about our assumptions here – we look at Tasmania. Given the low transaction volumes, our results will be more noisy. That said, in our base case to mid 2018, we expect to see the average house price in Hobart fall by 0.2% to $371,000 and the average unit price in Hobart fall by 4.1% to $285,000. In the regional areas, the average house price will fall by 0.3% to $264,000 and units will rise 0.8% to $221,000.
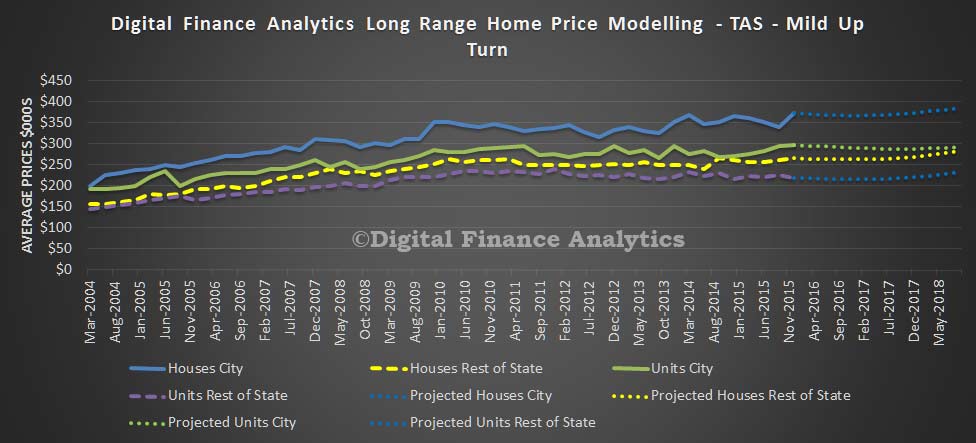
 If economic activity picks up to mid 2018, we expect to see the average house price in Hobart rise by 3.6% to $385,000 and the average unit price in Hobart fall by 1.9% to $291,000. In the regional areas, the average house price will rise by 6.6% to $283,000 and units will rise 5.7% to $231,000.
 If economic activity slows to mid 2018, we expect to see the average house price in Hobart fall by 11.3% to $329,000 and the average unit price in Hobart fall by 16.2% to $249,000. In the regional areas, the average house price will fall by 13.3% to $230,000 and units will fall 13.4% to $190,000.
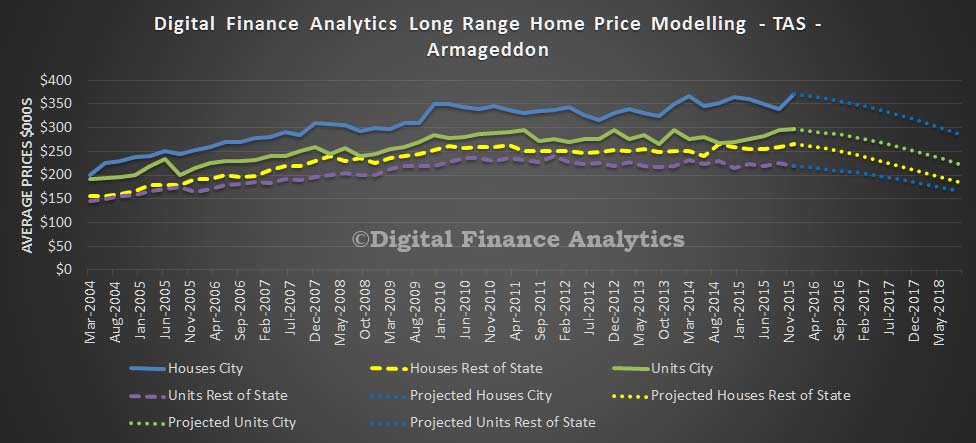
 If economic activity falls significantly to mid 2018, we expect to see the average house price in Hobart fall by 23.0% to $286,000 and the average unit price in Hobart fall by 24.6% to $224,000. In the regional areas, the average house price will fall by 30.3% to $185,000 and units will fall 23.7% to $167,000.
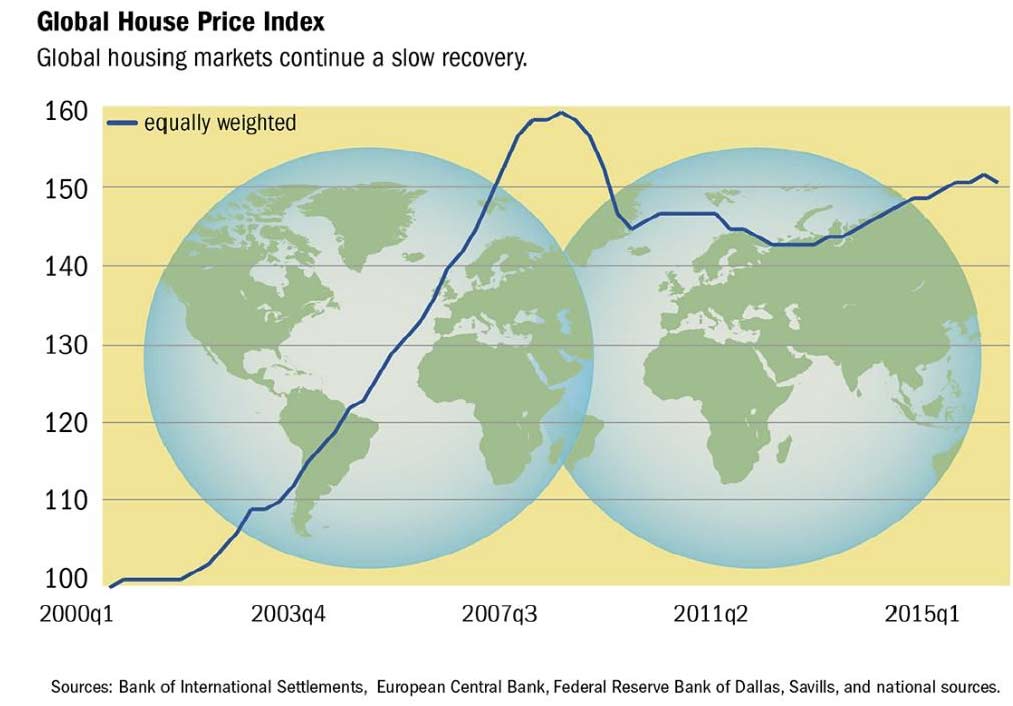
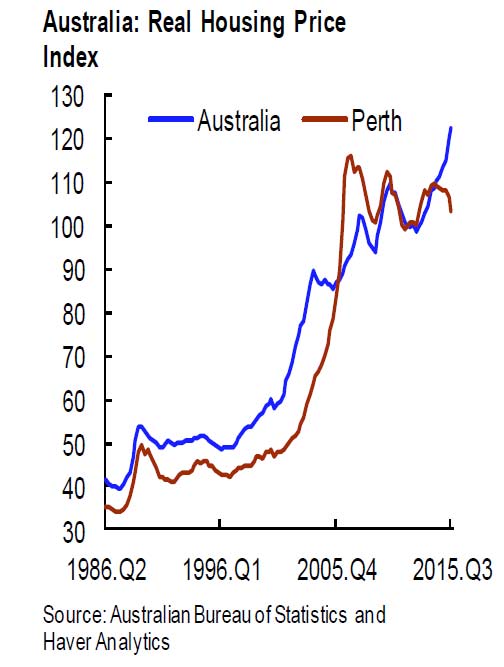
Global House Price Index Falls – IMF
The IMF Quarterly Update includes an update of the Global House Price Index. In Australia, the aggregate house price index has been rising in a strong but volatile pattern for the past twenty-five years, and has enjoyed a particularly strong burst of growth since 2013. However, house prices in Perth—surrounded by major mining and petroleum industries and known for providing services to these industries—are declining.
After sixteen quarters of inching upwards, the global house price index shows a small downtick. But it is too soon to tell if this is a reversal in trend.
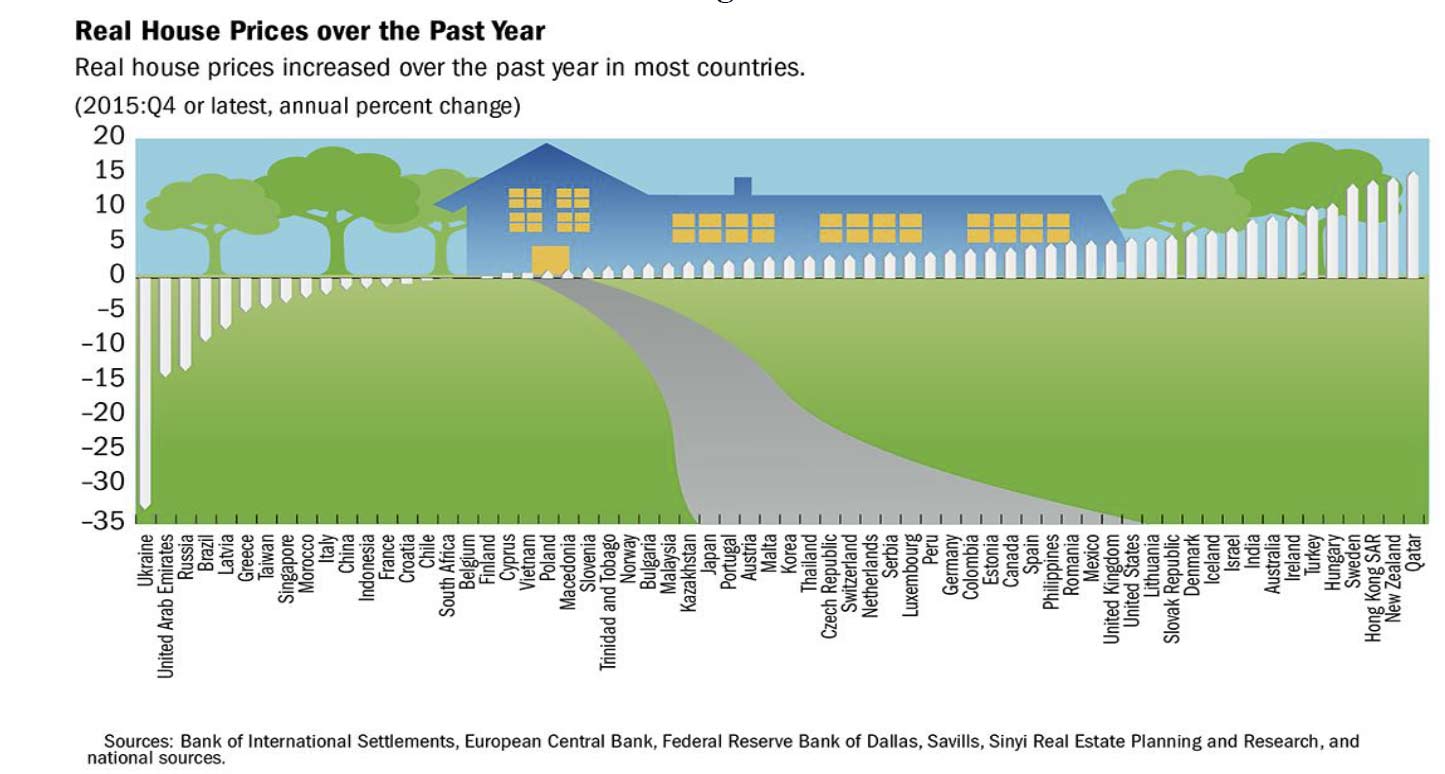
 Over the past year, many more countries have registered house price increases than declines. Australia is the eighth highest (well behind New Zealand!)
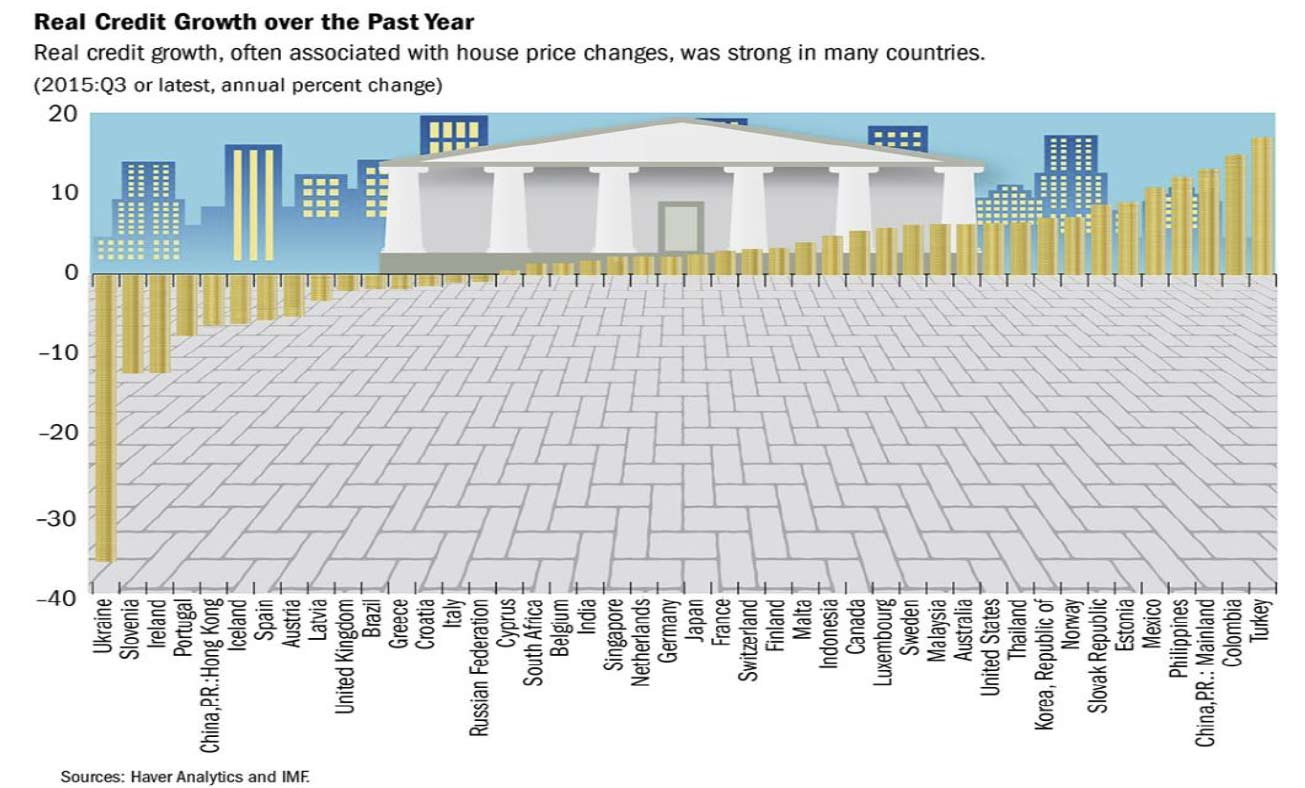
 Credit growth has also remained strong in many countries, though the overall correlation with house price growth at present is modest. Australia is twelfth, behind USA and Norway.
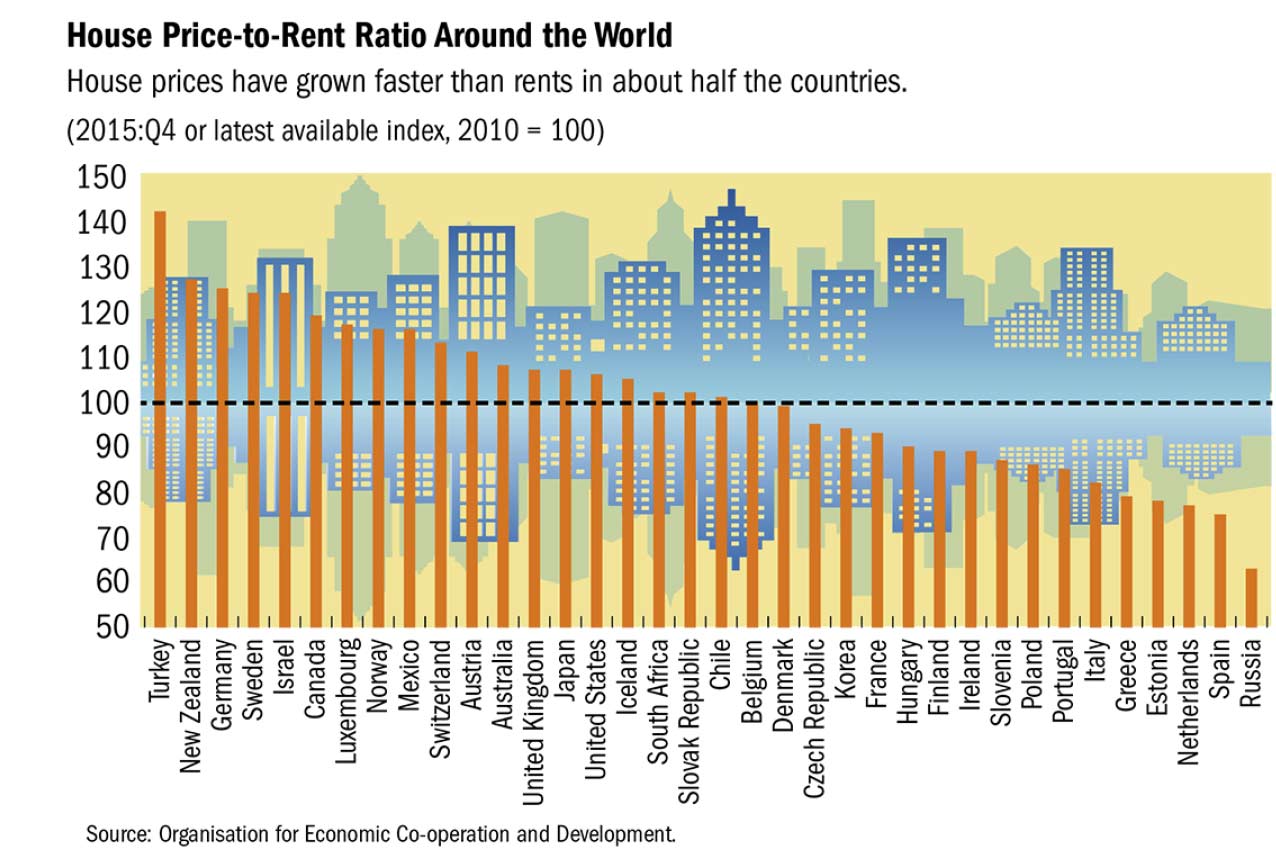
 Among OECD countries, house prices have grown faster than incomes ( Australia ninth highest) and rents since 2010 in about half the countries (Australia twelfth highest).
 The decline in commodity prices does not seem to be affecting national house prices but is having some effect in regions and cities within countries.
Life Insurance Industry In Review – APRA
APRA has released a submission made to the Senate Economics Committee relating to the life insurance industry. They highlight significant issues relating to risk assessment, pricing and profitability. Reinsurance is also a significant focus, as these entities took a number of hits. Legacy products are a significant problem. Here is a summary of the submission, with content reordered to make the information more digestible.
The most common products provided by life insurers are death cover, total permanent disability (TPD), trauma, and income protection. Annuities are also provided by some insurers.
- Life Insurance Death Cover pays a lump sum to the policy owner. If the policy owner and the life insured are one and the same then often beneficiaries would be a partner or child upon the death of the life insured. In some cases, a terminal illness benefit may be available and is an advancement of the death cover paid if the insured is medically certified as being terminally ill within a defined period (usually 12 or 24 months).
- Total Permanent Disability – known as TPD – pays a lump sum if the insured becomes totally and permanently disabled.
- Trauma provides payment if the insured person is diagnosed with a specified illness or injury. These policies include the major illnesses or injuries that will make a significant impact on a person’s life, such as cancer or a stroke.
- Income Protection replaces the income lost due to a person’s temporary inability to work due to injury or sickness. Sometimes also referred to as disability income insurance or salary continuance insurance.
- Annuity: An investment product providing a guaranteed income for either a fixed term or the lifetime of the policy holder.
Life insurance business can be divided into three groups according to the type of policyholder.
- Individual risk insurance: This insurance is sold to the final consumer directly or via a financial advisor. Individual consumers can choose whether to hold one or a range of life products listed above. The Life Insurance Act contains specific restrictions that significantly limit the ability of the life company to re-price the policy or change its terms and conditions. The policy holder is entitled to a guaranteed renewal of their policy.
- Group risk insurance: This insurance is sold to superannuation funds to provide cover to their members. Group insurers provide a default level of automatic cover, usually including TPD and death cover and sometimes income protection cover, to the trustee. The policyholder is the trustee of the fund who contracts the insurance on behalf of the membership. The terms, conditions and pricing of the policy are typically periodically re-negotiated periodically between the insurer and the trustee.
- Reinsurance: is insurance that is purchased by an insurance company (the cedant) from one or more other insurance companies (the “reinsurer”) as a means of risk management. The cedant and the reinsurer enter into a reinsurance agreement which details the conditions upon which the reinsurer would pay a share of the claims incurred by the ceding company in exchange for a premium.
As at 20 August 2015, there were 28 authorised life insurance companies. Insurers are comprised of a number of distinct groups: 8 large diversified insurers, 4 insurance risk or annuity specialists, 9 relatively small or niche market players and 7 reinsurers. The number of life insurers has reduced in the past decade in a continuation of a steady trend that began around 1990, when the number of licences peaked at 61. Since that time, mutually-owned insurers – which were once the largest life insurers in the market – have largely disappeared, while the banking industry has developed a prominent role in the ownership of life insurance and wealth management businesses more generally.
Some reinsurers both reinsure and sell life insurance directly. Many large insurers that provide individual life policies also provide group insurance to superannuation fund trustees but there are a number of insurers that largely specialise in servicing the group insurance market. Most insurers offer both life lump sum (TPD and Death) and income protection policies.
Although the life insurance industry continues to operate with an adequate excess of capital above minimum regulatory requirements, the profitability of the life insurance sector has been under strain in recent years. Weak profitability has been driven by, in particular, the mispricing of risk which resulted in losses for insurers during 2013-14:
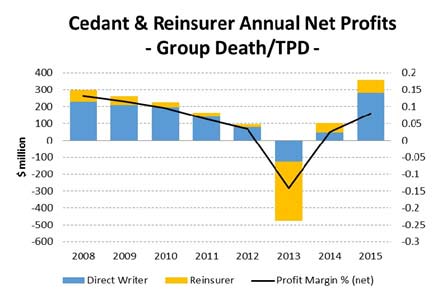
- group risk insurers experienced higher-than-expected lump sum disablement (TPD) claims payouts which generated substantial losses in 2013, with some reinsurers being particularly affected; and
- individual disability income business was the most significant source of losses in 2014.
In addition to the issues above, the industry has had to deal with a challenging external environment, including ongoing financial market volatility, persistently low interest rates, and pressures on overall industry operating efficiency. Some insurers have managed these challenges better than others. In particular, those insurers with a strong risk management framework, an effective risk appetite statement and a robust approach to capital management have proven best able to manage and adapt to operating conditions.
Poor risk management over time led to claims payouts exceeded the premiums collected for group total disability and group income protection, lines of insurance during 2013 and individual total disability and life in 2014. Reinsurers provided reinsurance on generous terms to these insurers, in effect allowing poor underwriting and risk management practices. As a result, reinsurers bore most of the losses during this period.
This outcome is not sustainable in the long term. Consumers of long-term products such as life insurance are ultimately best served if insurers are financially sustainable, thereby enabling firms to deliver on their long-term promises. There were various reasons for losses including :
- underwriting and pricing practices in both the life insurance and reinsurance industry left both the direct and reinsurance market exposed to adverse movement in market conditions. In particular, thin margins were exposed by pricing that did not properly align with the policy benefits. A notable example was a trend whereby default coverage increased in group life schemes, but the underlying premium rates did not increase, and in many case fell, despite the increased exposure;
- decreases in global interest rates reduced investment returns;
- competitive tension in group life market tendering saw the process often weighted toward acquisition and retention of business rather than sustainability; and
- increased plaintiff solicitor involvement drove an increase in lump sum total permanent disability (TPD) claims. The resulting increase in claims has been seen, in part, as a correction of a rate of claims which may not have accurately reflected the industry’s underlying exposure. For instance, prior to targeted marketing by plaintiffs’ firms, individual members may not have been aware of their available cover. An increase in the number of TPD claims related to mental illness and other complicated injuries, and changing community standards as to what conditions give rise to claims, has also resulted in more claims payments and requires greater claims management and resourcing.
The reinsurers seem to have carried a disproportionate share of the losses. Reinsurers incurred more than half of the total group death and TPD losses in 2013. Followed by significant losses in 2014 for individual disability income. This raises the question about the nature of the reinsurance arrangement in place and the role reinsurers may have played in the poor overall performance.
Reinsurers sought to mitigate the adverse impact of the poor experience on their financial position by significantly reducing or even ceasing to write or tender for new business. This in turn lead to an increase in prices for policyholders and/or a tightening of coverage, where permitted, which has inevitably been passed on to policyholders. Changes made by insurers include:
- no longer making ‘opt-in’ offers that allow members to take or increase cover with little or no evidence of health status;
- increasing the length of the ‘at work’ period for members to become eligible for cover (e.g. from one day to one month);
- tightening the definition of TPD (for example, from ‘unlikely to work’ to ‘unable to work’);
- introducing severity-based TPD benefits;
- introducing TPD benefits payable via instalments rather than as a lump sum;
- reducing default TPD benefits and increasing default GSC benefits;
- reducing automatic acceptance limits;
- making greater use of health questions for optional cover; and
- making greater use of exclusions for pre-existing conditions, hazardous occupations, suicides and pandemics.
APRA has observed that many insurers chose to increase premiums to improve profitability. While some premium increase may be needed to ensure pricing is sustainable following a period in which premiums were insufficient to reflect risk, in APRA’s view, these increases do not by themselves address the structural reasons that led to the underlying problems and have produced an unexpected increase in the cost of insurance for superannuation fund members.
One area of potential change identified by APRA relevant to this Inquiry is the introduction of a mechanism to allow the rationalisation of legacy products to occur more easily. Legacy products arise particularly in life insurance and superannuation, where the financial products often last a lifetime, but the financial, legal and social environment continually changes. In addition, the life insurance sector has undergone a significant consolidation over the past 20 years, leading to many duplicated and outdated products. The industry is still grappling with the challenge of addressing those issues.
Life insurers regularly introduce new products to better reflect consumer demand and changed market conditions; while the previous products (legacy products) are typically no longer made available for new business. However, these legacy policies must continue to be administered in accordance with the original contract terms.
Over time, legacy products become more complex and expensive to administer and may no longer meet the requirements of the beneficiaries. Industry estimates suggest that approximately 25 per cent of all funds under management are in legacy products. The cost of these legacy products is ultimately borne by the policyholders.
As life insurance products involve a contract between the life insurer and the policyholder, terms cannot be unilaterally modified by either party to the contract. Consequently, it is very difficult to rationalise legacy products in the absence of a legislative mechanism, as each policyholder would need to consent to any changes. In the case of individual risk business, a policyholder may not be able switch to a newer product or provider readily, as their health status may have changed in the interim meaning that they either cannot obtain replacement insurance or can only do so at significantly increased cost.
There is a range of very complex legal, consumer and tax issues that arise if a life insurer seeks to move policyholders from a legacy product to a new product, restricting the ability of insurers to close legacy products. The benefits of a simpler, though still robust, mechanism to rationalise legacy financial products has been recognised for some time. The issue was, for example, a recommendation of the Report of the Taskforce on Reducing Regulatory Burdens on Business in 2006. As noted in the Financial System Inquiry Final Report, between 2007 and 2010 Government worked with industry to develop a mechanism to facilitate product rationalisation. However, such a mechanism was not finalised or implemented.
The mechanism would have facilitated rationalisation of genuine legacy products — that is, not simply those that are performing poorly — subject to a ‘no disadvantage test’ for relevant consumers. It would also have provided tax relief to ensure consumers were not disadvantaged as a result of triggering an early capital gains tax event.
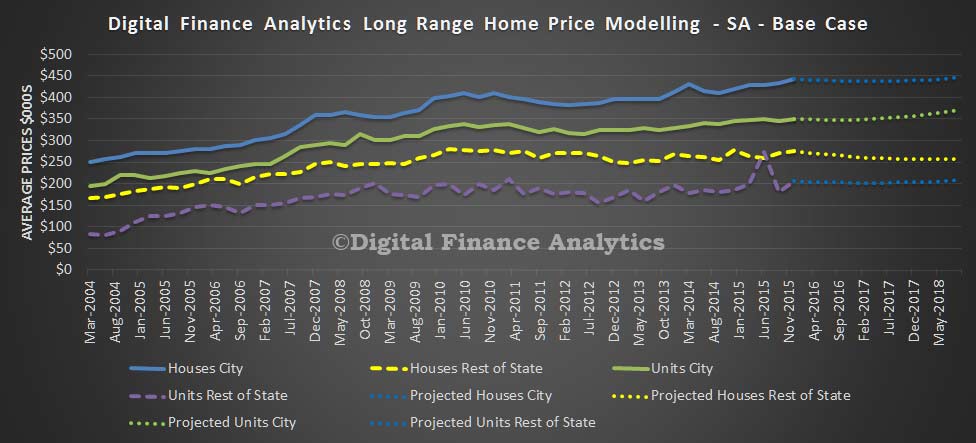
Where To With Adelaide Home Prices?
As we continue our state by state analysis, today we look at South Australia.
In our base case to mid 2018, we expect to see the average house price in Adelaide rise by 0.8% to $446,000 and the average unit price in Adelaide rise by 5.9% to $371,000. In the regional areas, the average house price will fall by 7.0% to $256,000 and units will rise 1.1% to $208,000.
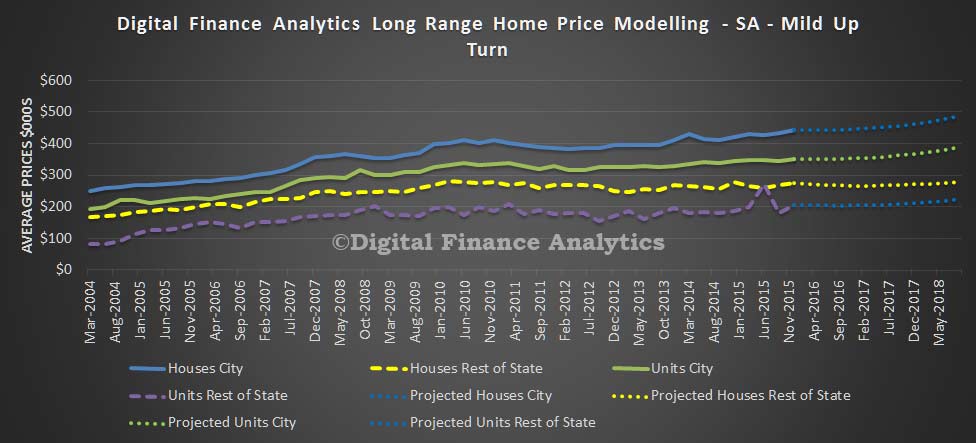
 If economic activity picks up to mid 2018, we expect to see the average house price in Adelaide rise by 9.9% to $487,000 and the average unit price in Adelaide rise by 10.7% to $387,000. In the regional areas, the average house price will rise by 1.4% to $279,000 and units will rise 8.8% to $224,000.
 If economic activity slows to mid 2018, we expect to see the average house price in Adelaide fall by 10.3% to $397,000 and the average unit price in Adelaide fall by 7.1% to $325,000. In the regional areas, the average house price will fall by 18.1% to $226,000 and units will fall 11.9% to $182,000.
 If economic activity falls significantly to mid 2018, we expect to see the average house price in Adelaide fall by 26.7% to $324,000 and the average unit price in Adelaide fall by 22.2% to $272,000. In the regional areas, the average house price will fall by 33.1% to $184,000 and units will fall 25.8% to $153,000.
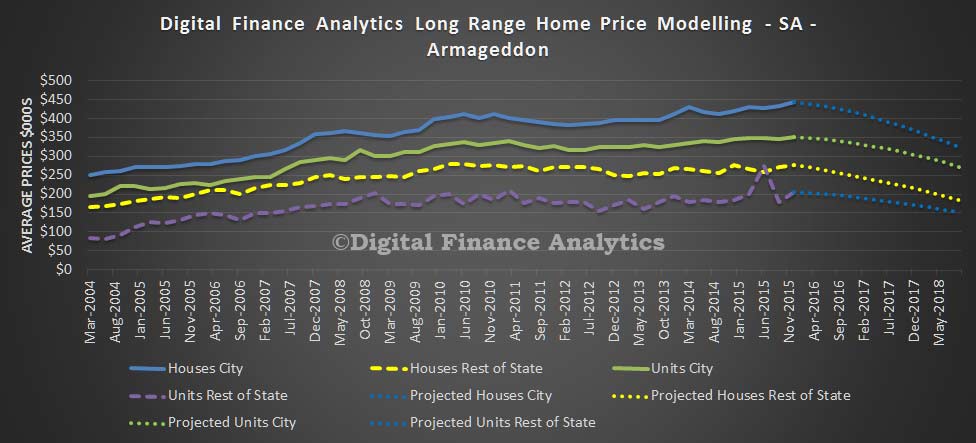 A reminder. This modelling is wrong, but is designed to illustrate the relative sensitivities in different scenarios!
Westpac halts property loans to foreigners
Westpac has announced it will no longer loan money to foreigners wishing to purchase residential property in Australia.
The bank and its subsidiaries (St George, Bank SA and Bank of Melbourne) ceased property lending to all non-residents and temporary visa holders as of April 26. Westpac is the third major bank to clamp down in this way, following announcements from ANZ and Commonwealth Bank earlier in April.
Australian and New Zealand citizens whose main source of income is from overseas will also be affected. They are restricted to loans for new housing only, with the maximum amount that Westpac will lend them falling from 80% to 70% of the total purchase price.
An email sent by Westpac to mortgage brokers said, “At Westpac, helping Australians to achieve their goal of owning a home or investment property is core to our purpose.
“For these reasons, Westpac will no longer lend to offshore customers who are not citizens or residents of Australia with an eligible visa.”
The news may spark fears of a slowdown in residential construction, with developers potentially taking a hit. In particular, Meriton has been targeting the Chinese market and may have to rethink strategy.
MFAA CEO Siobhan Hayden said of Westpac’s decision, “Westpac’s policy change… reflects a prudent decision for a more balanced portfolio at this time and reduced exposure for the bank.”
Three Reasons Why RBA Might Hold Off Cutting Interest Rates Next Tuesday
Capital Economics has joined other major investment houses in deciding it believes the RBA is likely to cut the official cash rate to 1.75% next Tuesday.
There are a host of takes from economists here following this game-changing piece of data, but CE has the following dead-right summary of the handbrakes for the RBA board:
There are three plausible reasons why the RBA could ignore the plunge in underlying inflation and leave rates on hold at 2.0% at next week’s meeting, or perhaps even beyond. First, the Bank could continue to interpret low inflation as giving it the scope to cut rates in the future if demand falters. Second, lingering concerns about financial stability and the health of the housing market may mean the RBA is reluctant to cut rates again. Third, the RBA may want to wait to see what is announced in the Federal Budget, which will be released just five hours after the RBA’s decision.
The view that cutting interest rates might do more harm than good is starting to gain traction among many commentators. And senior people in central banks don’t work in an ideas vacuum.
Cutting rates again would send a very blunt signal that there are concerns about the health of the economy — not helpful when property prices in pockets of Australia are now starting to reverse as investment fever takes a reality check.
Then there’s the budget. Maybe Scott Morrison has something that will stir demand in store.