Loan Growth is Uncertain for U.S. Banks

Many U.S. banks reported relative strength in consumer lending in fourth quarter earnings, while corporate lending growth was below expectations, according to Fitch Ratings‘ latest “U.S. Banking Quarterly Comment: 4Q17.”

The industry reported around 3% loan growth for the full-year, well below historical averages. With the passage of the Tax Cuts and Jobs Act (TCJA), it’s unclear if there will be an uptick in lending with fewer incentives for U.S. corporates to borrow.

“Loan growth is expected to remain muted next year as many banks publicly disclosed they are targeting between low- and mid-single digit loan growth for the year,” said Julie Solar, Senior Director, Fitch Ratings.

Tax reform had a significant impact on fourth quarter earnings, but outside of one-time tax charges and gains, most banks reported improving spread income from interest rate increases, still benign credit costs, strong investment banking results and well-controlled core expenses. During earnings calls, many banks disclosed new earnings targets with improved returns. The large regional banks continue to report relatively stronger earnings than the universal banks, though not all banks included in the comment publicly disclosed new targets.

“The TCJA created a lot of noise in the quarter, but going forward most banks will likely report a boost to earnings,” added Solar.

Costs of credit continue to fall well below long-term average with net charge-offs at historically low levels across many asset classes, averaging 44bps during the quarter. This is well below the industry historical average since 1984 of nearly 80bps (which excludes financial crisis era losses between 2008-2010).

The five U.S. Global Trading and Universal Banks (GTUBs) reported strong investment banking and weak trading results during the fourth quarter of 2017 (4Q17), a trend that is unlikely to reverse anytime soon, according to Fitch Ratings’ “U.S. Capital Markets Quarterly: 4Q17“. Growth in debt underwriting from a strong leveraged finance market, an increase in equity underwriting, and growth in advisory drove investment banking (IB) results higher. However, total capital markets revenues in 4Q17 were $22.12 billion; a decline of 10.97% year over year due to weakness in fixed income, currencies and commodities (FICC) net revenue as client engagement levels fell across multiple products.

“Low volatility is problematic for trading, but it does allow corporates to plan for M&A activity which boosts investment banking results,” said Justin Fuller, Senior Director, Fitch Ratings. “Though, the correlation between guidance during earnings calls and future revenue is weak as economic and political variables can often delay deal execution.”

Overall 4Q17 IB revenues were the best fourth- quarter performance in the past five years, with total IB revenues of $8.1 billion, up 19.2% year over year. Overall 4Q17 FICC revenues for all of the U.S. GTUBS declined 30.7% from the prior year to $8.2 billion as continued low volatility drove low levels of client activity.

JPMorgan Chase & Co. (JPM) retained its leading market share position with 23.2% of overall capital markets revenues in 4Q17; however, its overall share declined by 150 basis points year over year, while Bank of America (BAC) achieved year over year share gains of 190 basis points. As a result, the shares of Morgan Stanley (MS), BAC and Citigroup (C) converged at just less than 19% of total capital market fees in 4Q17.

In 4Q17, capital markets revenue as a percentage of total revenue decreased for each firm on a year over year basis. The average contribution to overall revenues of the five U.S. GTUBs was 22.1% in 4Q17, down from 24.9% in the prior year quarter. However, the contribution from capital markets revenue in 4Q17 is only slightly below the five-year average of fourth-quarter capital markets revenue of 22.5%. The five U.S. GTUBs all had significantly higher net interest income this quarter due to higher year over year short-term interest rates as well as incrementally higher wealth/asset management revenues amid higher global equity markets. Fitch believes the strength of these other sources of revenue helps to demonstrate the diversity of the business models of some of the larger banks.

Greenspan Warns Of Rates Rises

Alan Greenspan, the former Fed Chair, speaking on Wednesday on Bloomberg Television said “there are two bubbles: We have a stock market bubble, and we have a bond market bubble”.

This at a time when US stock indexes remain near record highs and as the yields on government notes and bonds hover not far from historic lows.

As the Fed continues to tighten monetary policy, interest rates are expected to move up in coming years.

At the end of the day, the bond market bubble will eventually be the critical issue, but for the short term it’s not too bad

But we’re working, obviously, toward a major increase in long-term interest rates, and that has a very important impact, as you know, on the whole structure of the economy.

What’s behind the bubble? Well the fact, that, essentially, we’re beginning to run an ever-larger government deficit.

Greenspan said. As a share of GDP, “debt has been rising very significantly” and “we’re just not paying enough attention to that.”

“Irrational exuberance” is back!

Fed Holds, But Signals More Rises Ahead

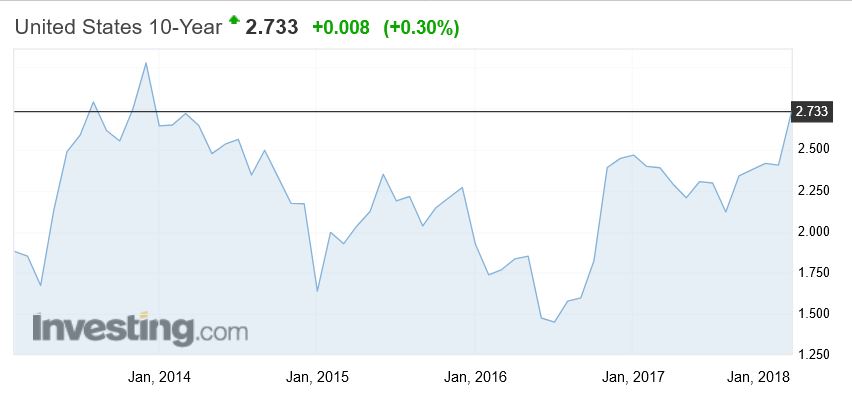
The Fed held their target range but confirmed its intent to lift rates ahead at Yellen’s last meeting as head. The bank signalled that it would push ahead on its monetary policy tightening path as economic activity has been rising at a solid rate, while inflation remained low but is expected to “move up” in the coming months. Most analysts suggest 2-3 hikes this year. The T10 bond yield continues to rise and is highest since 2014. Expect rates to go higher, putting more pressure on international funding costs.

Information received since the Federal Open Market Committee met in December indicates that the labor market has continued to strengthen and that economic activity has been rising at a solid rate. Gains in employment, household spending, and business fixed investment have been solid, and the unemployment rate has stayed low. On a 12-month basis, both overall inflation and inflation for items other than food and energy have continued to run below 2 percent. Market-based measures of inflation compensation have increased in recent months but remain low; survey-based measures of longer-term inflation expectations are little changed, on balance.

Consistent with its statutory mandate, the Committee seeks to foster maximum employment and price stability. The Committee expects that, with further gradual adjustments in the stance of monetary policy, economic activity will expand at a moderate pace and labor market conditions will remain strong. Inflation on a 12‑month basis is expected to move up this year and to stabilize around the Committee’s 2 percent objective over the medium term. Near-term risks to the economic outlook appear roughly balanced, but the Committee is monitoring inflation developments closely.

In view of realized and expected labor market conditions and inflation, the Committee decided to maintain the target range for the federal funds rate at 1-1/4 to 1‑1/2 percent. The stance of monetary policy remains accommodative, thereby supporting strong labor market conditions and a sustained return to 2 percent inflation.

In determining the timing and size of future adjustments to the target range for the federal funds rate, the Committee will assess realized and expected economic conditions relative to its objectives of maximum employment and 2 percent inflation. This assessment will take into account a wide range of information, including measures of labor market conditions, indicators of inflation pressures and inflation expectations, and readings on financial and international developments. The Committee will carefully monitor actual and expected inflation developments relative to its symmetric inflation goal. The Committee expects that economic conditions will evolve in a manner that will warrant further gradual increases in the federal funds rate; the federal funds rate is likely to remain, for some time, below levels that are expected to prevail in the longer run. However, the actual path of the federal funds rate will depend on the economic outlook as informed by incoming data.

U.S. Mortgage Rates Can’t Catch a Break

From Mortgage News Daily.

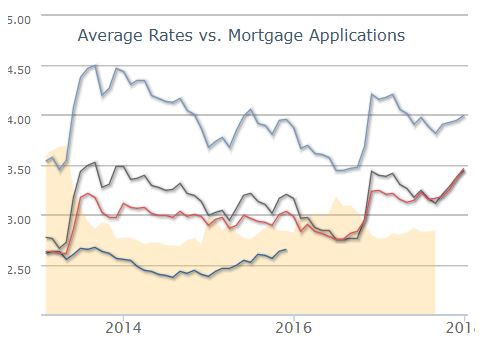
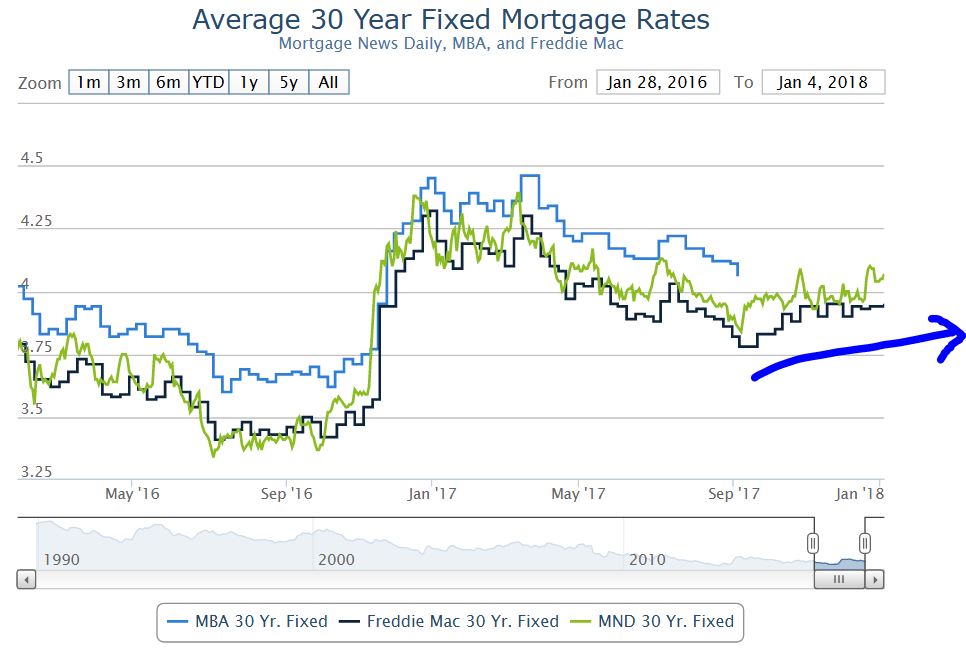
After taking just one day off from the prevailing move higher, mortgage rates were back at it today, heading back to the worst levels in more than 9 months.  The average lender is now back in line with the highs seen 2 days ago on Monday afternoon.  Over slightly longer time-frames, rates have risen an eighth of a percentage point since last week, a quarter of a point from 2 weeks ago, and 3/8ths of a point since mid December.  That makes this the worst run since the abrupt spike following 2016’s presidential election.

Unfortunately, this trend won’t necessarily stop simply because things have “gotten bad.”  While it’s true that the economic effects of higher and higher rates will eventually have a self-righting effect, that could take months–even years to play out.  While this doesn’t necessarily mean that rates will continue a linear trend higher in the coming months, it does mean the current trend is not our friend, and that it would take some huge changes in bond market trading levels before it made sense to lower our defenses.

Rising Interest Payments Are Real

From NorthmanTrader.

Is anyone paying attention? I don’t know, but the cost of carrying debt has been rising and it’s already showing measurable impacts despite the Fed Funds rate still being very low.

My concern of course is that the global debt construct will bring global growth to a screeching halt (see also The Debt Beneath).

As the 10 year is already piercing above the 2.6% area now I want to pay attention to the data coming in as the Fed is dot plotting more rate hikes to come:

After all the Fed has hiked 5 times off the bottom floor in the past 2 years:

Can we see any measurable impact? You bet we can. Here are personal interest payments for consumers:

Mind you we are still near the lows of the previous cycle and already total interest payments are near record highs.

The driver of course is record consumer debt and credit card debt (see also macro charts). But despite rates still being historically low this rise in interest rates has an impact on the consumer.

Already we see this:

“The big four US retail banks sustained a near 20 per cent jump in losses from credit cards in 2017, raising doubts about the ability of consumers to fuel economic expansion. “People are using their cards to get from pay cheque to pay cheque,” said Charles Peabody, managing director at the Washington-based investment group Compass Point. “There’s an underlying deterioration in the ability of the consumer to keep up with their debt service burden.” Recently disclosed results showed Citigroup, JPMorgan Chase, Bank of America and Wells Fargo took a combined $12.5bn hit from soured card loans last year, about $2bn more than a year ago.”

I repeat: “There’s an underlying deterioration in the ability of the consumer to keep up with their debt service burden.”

That’s a problem given the Fed’s dot plot. Before you know it consumers will be handing over a good portion of their tax cuts to credit card companies. Winning.

Is the government carrying record debt immune to this? Nope. Here’s the latest monthly Treasury statement:

Interest on debt alone was $32B for 1 month. During the same month the year prior it was $25B:

That’s a 28% increase year over year. Perhaps the data is lumpy month to month, we’ll see confirmation in the next few months. But much of this US government debt has to be refinanced in the next few years, meaning it will be subject to much higher rates and the US needs to continue to add to its debt to keep itself financed..

Indeed the recent tax cuts only exacerbate an already existing debt sale schedule:

“Economists with Deutsche Bank expect the extra debt the Treasury must issue to fund President Donald Trump’s tax package and the amount of debt the Federal Reserve plans to redeem at maturity this year will bloat issuance to about $1tn in 2018. That’s up more than 50 per cent from a year earlier and, when coupled with a 30 per cent rise in the amount of corporate debt that’s due to mature, leaves questions of who the eventual buyer will be.

A good question indeed. That’s a lot of debt issuance:

Somebody has to buy it or the pain is real:

“If demand for US fixed income doesn’t double over the coming years then US long rates will move higher, credit spreads will widen, the dollar will fall, and stocks will probably go down as foreigners move out of depreciating US assets,” Torsten Sløk, an economist with the bank, said.”

No, we can all pretend rising rates don’t have an impact, we can also pretend deficits don’t matter, and we can also pretend money grows on trees.

But we can’t pretend interest payments aren’t rising. Because they are. Right now.

Are US Rates Going Higher?

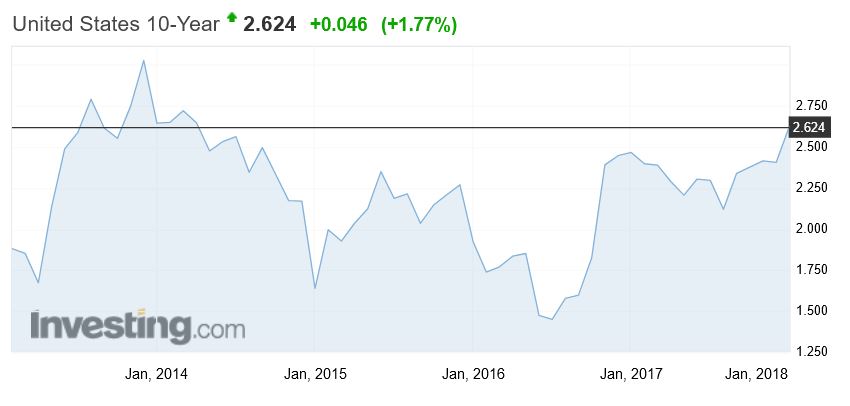
The 10-Year US Bond yield is moving higher.  This is important because it has a knock-on effect in the capital markets and so Australian Bank funding costs, potentially putting upward pressure on mortgage rates.

Whilst the US Mortgage rates were only moderately higher today, the move was enough to officially bring them to the highest levels since the (Northern) Spring of 2017.

So this piece from Moody’s is interesting.  Is the markets view that rates won’t go higher credible?

Earnings-sensitive securities have thrived thus far in 2018. Not only was the market value of U.S. common stock recently up by 4.5% since year-end 2017, but a composite high-yield bond spread narrowed by 23 basis points to 336 bp. The latter brings attention to how the accompanying composite speculative-grade bond yield fell from year-end 2017’s 5.82% to a recent 5.72% despite the 5-year Treasury yield’s increase from 2.21% to 2.39%, respectively.

Thus, the latest climb by the 10-year Treasury yield from year-end 2017’s 2.41% to a recent 2.62% is largely in response to the upwardly revised outlook for real returns that are implicit to the equity rally and the drop by the speculative-grade bond yield. The 10-year Treasury yield is likely to continue to trend higher until equity prices stagnate, the high-yield bond spread widens, interest-sensitive spending softens, and the industrial metals price index establishes a recurring slide. In view of how the PHLX index of housing sector share prices has risen by 4.5% thus far in 2018, investors sense that home sales will grow despite the forthcoming rise by mortgage yields.

Moreover, increased confidence in the timely servicing of home mortgage debt has narrowed the gap between the 30-year mortgage yield and its 10-year Treasury yield benchmark from the 172 bp of a year earlier to a recent 152 bp. The latter is the narrowest such difference since the 150 bp of January 2014, which roughly coincided with a peaking of the 10-year Treasury yield amid 2013-2014’s taper tantrum.

Do suppliers of credit to the high-yield bond market and mortgage market correctly sense an impending top for benchmark Treasury yields? If they are wrong and the 10-year Treasury yield quickly climbs above its 2.71% average of the six-months-ended March 2014, they will regret having acquiesced to the atypically thin spreads of mid-January 2018.

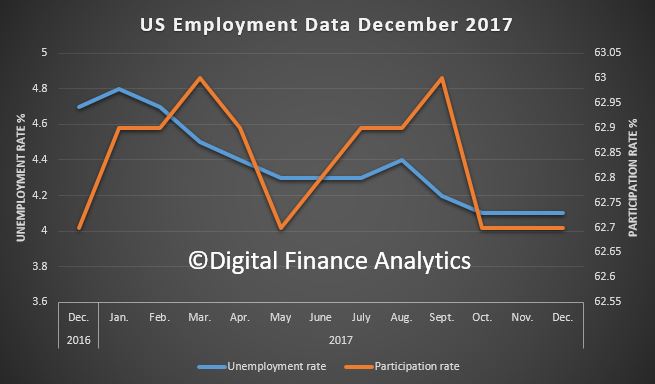
US Employment Data December 2017

The US Bureau of Labor Statistics has released data to end December 2017. More evidence of the strength of the US economy, and potential justification for more Fed rate rises.

Total nonfarm payroll employment increased by 148,000 in December, and the unemployment rate was unchanged at 4.1 percent. Employment gains occurred in health care, construction, and manufacturing.

Seasonally adjusted household survey data have been revised using updated seasonal adjustment factors, a procedure done at the end of each calendar year. Seasonally adjusted estimates back to January 2013 were subject to revision.

Household Survey Data

In December, the unemployment rate was 4.1 percent for the third consecutive month. The number of unemployed persons, at 6.6 million, was essentially unchanged over the month. Over the year, the unemployment rate and the number of unemployed persons were down by 0.6 percentage point and 926,000, respectively.

Among the major worker groups, the unemployment rate for teenagers declined to 13.6 percent in December, offsetting an increase in November. In December, the unemployment rates for adult men (3.8 percent), adult women (3.7 percent), Whites (3.7 percent), Blacks (6.8 percent), Asians (2.5 percent), and Hispanics (4.9 percent) showed little or no change.

Among the unemployed, the number of new entrants decreased by 116,000 in December. New entrants are unemployed persons who never previously worked.

The number of long-term unemployed (those jobless for 27 weeks or more) was little changed at 1.5 million in December and accounted for 22.9 percent of the unemployed. Over the year, the number of long-term unemployed declined by 354,000.

The labor force participation rate, at 62.7 percent, was unchanged over the month and over the year. The employment-population ratio was unchanged at 60.1 percent in December but was up by 0.3 percentage point over the year.

The number of persons employed part time for economic reasons (sometimes referred to as involuntary part-time workers) was essentially unchanged at 4.9 million in December but was down by 639,000 over the year. These individuals, who would have preferred full-time employment, were working part time because their hours had been cut back or because they were unable to find a full-time job.

In December, 1.6 million persons were marginally attached to the labor force, about unchanged from a year earlier. (The data are not seasonally adjusted.) These individuals were not in the labor force, wanted and were available for work, and had looked for a job sometime in the prior 12 months. They were not counted as unemployed because they had not searched for work in the 4 weeks preceding the survey.

Among the marginally attached, there were 474,000 discouraged workers in December, little changed from a year earlier. (The data are not seasonally adjusted.) Discouraged workers are persons not currently looking for work because they believe no jobs are available for them. The remaining 1.1 million persons marginally attached to the labor force in December had not searched for work for reasons such as school attendance or family responsibilities.

Establishment Survey Data

Total nonfarm payroll employment rose by 148,000 in December. Job gains occurred in health care, construction, and manufacturing. In 2017, payroll employment growth totaled 2.1 million, compared with a gain of 2.2 million in 2016.

Employment in health care increased by 31,000 in December. Employment continued to trend up in ambulatory health care services (+15,000) and hospitals (+12,000). Health care added 300,000 jobs in 2017, compared with a gain of 379,000 jobs in 2016.

Construction added 30,000 jobs in December, with most of the increase among specialty trade contractors (+24,000). In 2017, construction employment increased by 210,000, compared with a gain of 155,000 in 2016.

In December, manufacturing employment rose by 25,000, largely reflecting a gain in durable goods industries (+21,000). Manufacturing added 196,000 jobs in 2017, following little net change in 2016 (-16,000).

Employment in food services and drinking places changed little in December (+25,000). Over the year, the industry added 249,000 jobs, about in line with an increase of 276,000 in 2016.

In December, employment changed little in professional and business services (+19,000). In 2017, the industry added an average of 44,000 jobs per month, in line with its average monthly gain in 2016.

Employment in retail trade was about unchanged in December (-20,000). Within the industry, employment in general merchandise stores declined by 27,000 over the month. Retail trade employment edged down in 2017 (-67,000), after increasing by 203,000 in 2016.

Employment in other major industries, including mining, wholesale trade, transportation and warehousing, information, financial activities, and government, changed little over the month.

The average workweek for all employees on private nonfarm payrolls was unchanged at 34.5 hours in December. In manufacturing, the workweek edged down by 0.1 hour to 40.8 hours, while overtime remained at 3.5 hours. The average workweek for production and nonsupervisory employees on private nonfarm payrolls was unchanged at 33.8 hours.

In December, average hourly earnings for all employees on private nonfarm payrolls rose by 9 cents to $26.63. Over the year, average hourly earnings have risen by 65 cents, or 2.5 percent. Average hourly earnings of private-sector production and nonsupervisory employees increased by 7 cents to $22.30 in December.

The change in total nonfarm payroll employment for October was revised down from +244,000 to +211,000, and the change for November was revised up from +228,000 to +252,000. With these revisions, employment gains in October and November combined were 9,000 less than previously reported. (Monthly revisions result from additional reports received from businesses and government agencies since the last published estimates and from the recalculation of seasonal factors.) After revisions, job gains have averaged 204,000 over the last 3 months.

US Mortgage Rates Move Higher on Strong Economic Data

More evidence of upward pressure on mortgage rates on the back of positive economic news. All this adds weight to the view that Australian mortgage rates are more likely to rise down the track.

US Mortgage ratesmoved higher, following stronger economic data at home and abroad.  In general, stronger economic data implies better growth, higher stock prices and higher rates.  Although the traditional levels of correlation between data and rates have been thrown off for various reasons over the past year, we still see examples of that correlation from time to time.  Today was one of those days.


Economic data was stronger in Europe and Asia during the overnight session.  This resulted in bond markets moving toward higher rates even before the domestic economic data came out.  Today’s most significant domestic data was the ADP Employment report, which showed payroll creation of 250k per month compared to forecasts calling for 190k.  This speaks to the potential for Friday’s official numbers from the Labor Department (more important than ADP) to stage a similar performance (which would be bad for rates, all things being equal).

In today’s case, bond traders weren’t ready to send rates straight to the moon.  Bonds (which dictate rates) recovered most of their losses by the afternoon.  Several mortgage lenders adjusted rate sheets accordingly, but on average, today’s rates are the highest since last Tuesday.  Specifically, the average lender is quoting 4.0-4.125% on top tier scenarios (30yr fixed, conventional).

Mobile-First Digital Banking Strategy Takes Hold In The Midwest

From S&P Global.

Banks across the U.S. are adopting a mobile-first strategy for their digital offerings, and the Midwest is no exception.

U.S. consumers value their mobile bank apps more than ever, and expectations for these products are growing increasingly sophisticated. Once-novel mobile features such as photo check deposit and bill pay are now table stakes, and banks seeking to offer a competitive digital experience have to evaluate an ever-evolving range of services.

S&P Global Market Intelligence’s 2017 U.S. Mobile Banking Landscape includes regional insights from our 2017 mobile banking survey and details on the features available in the apps of dozens of U.S. financial institutions, including more than two dozen large banks and 45 companies with less than $50 billion in assets. The latter group consists of five smaller regional and community banks from each of the nine U.S. census divisions. This article focuses on the Midwest, which includes the East North Central and West North Central census divisions.

Our survey found that Midwestern mobile banking customers are most interested in seeing credit score information added to their apps. Consumers’ preoccupation with their credit files is only likely to intensify in the wake of the Equifax data breach. Few of the regional bank apps from around the country that we recently reviewed provide access to this information, although First National Bank of Omaha makes it available to consumer credit card customers.

Which bank app features are missing? (%)

Another highly valued feature for bank app users is fingerprint login, which many Midwestern banks offer. But with the rollout of Apple’s new iPhone X and other evolutions in mobile technology, banks across the country are increasingly having to pay attention to alternative forms of biometric authentication, including face ID. Banks are responding to their customers’ desire for even more convenient access to account information by allowing them to view their balances without logging in to the app.

Customers also want access to certain card controls via their bank apps, including the ability to temporarily switch cards on or off, and to report them lost or stolen. Jefferson City, Mo.-based Central Banco. Inc. and Sioux Falls, S.D.-based Great Western Bancorp Inc. are among the institutions planning to roll out such features in the near future, while Saint Paul, Minn.-based Bremer Financial Corp. makes certain card controls and account alert management available through a separate, third-party app.

The availability of certain features is just one way to assess the quality of a mobile offering. Customers who provide app store reviews clearly value speed, reliability, and an intuitive layout, and they seem to prefer having all features available on one platform.

Central Bank is redesigning its whole app for release next year, with the goal of providing a more user-friendly experience by streamlining navigation and better surfacing popular features such as person-to-person payments. The bank is taking the mobile-first approach seriously, as mobile logins have overtaken desktop logins, and about 65% of the company’s digital traffic is coming through phones.

Great Western Bank, whose deposits are primarily spread across Nebraska, Iowa, South Dakota, and Colorado, also hears from customers that they want improved core functionality, for example, faster transaction alerts. Great Western uses a niche digital vendor for its mobile channel and believes this is more advantageous than using a standard package from core systems providers.

The Midwest is home to some of the nation’s few mobile-ready ATMs. Chicago-area Wintrust Financial Corp. is a relatively early adopter of Cardless Cash, which lets the customer scan a QR code with their smartphone instead of using a debit card to withdraw money. In a competitive banking environment, and especially in heavily banked areas, financial institutions are keeping an eye on customer attrition and looking for an edge. This sometimes means making investments in new ATM hardware or services like mobile P2P payments that do not necessarily add revenue but that have become part of what customers expect from their banks.

It is difficult to quantify the value of a high-quality mobile banking experience, but our survey results give an idea of how important it is to consumers. Despite being generally fee-averse, more than 40% of survey respondents from the Midwest indicated that they would be willing to pay $1 per month to use their bank apps, while more than 20% said they would pay $3 per month. Respondents from the East North Central census division, which includes Indiana, Illinois, Michigan, Ohio and Wisconsin, were more willing to pay a fee. Although banks are unlikely to start charging for their digital services, satisfied mobile banking users could prove stickier deposit customers even as rates continue to rise and other institutions tempt them with promotional offerings.

When it comes to delivering products and services, banks of all sizes have a high bar to meet. Large, deep-pocketed institutions are constantly innovating with their digital channels, and it is not easy for their smaller peers to keep up. But many regional and community banks boast sophisticated mobile apps with desirable features that are not yet ubiquitous among the nation’s largest banks. In a banking landscape populated by fewer branches and with visits to those locations by tech-savvy customers on the decline, the combination of a strong local brand and robust digital experience could give smaller banks a competitive edge.

Methodology

The 2017 mobile banking survey was fielded online between January 26 and February 1 across a nationwide random sample of 4,000 U.S. mobile bank app users 18 years and older. Results have a margin of error of +/- 1.6% at the 95% confidence level based on the sample size of 4,000.

S&P Global Market Intelligence researched mobile apps in June 2017 for more than two dozen financial institutions, including the biggest retail banking franchises in the U.S. and various large regional and branchless banks. Between September 18 and November 10, S&P Global Market Intelligence researched mobile apps for 45 smaller regional players and large community banks. The latter analysis focused, for the most part, on the top five retail deposit market share leaders with under $50 billion in assets in each of the nine U.S. census divisions.

This research is based on product descriptions available on bank websites and in app stores, as well as company-provided information. Some companies may have subsequently updated their apps or may offer additional features and services. Our analysis does not necessarily reflect functionality or services available through text banking, mobile browsers or secure messaging.

How Fiscal Realities Intersect with Monetary Policy

From the St. Louis Fed On The Economy Blog.

How are government deficits financed, and what are the implications for monetary policy and inflation?

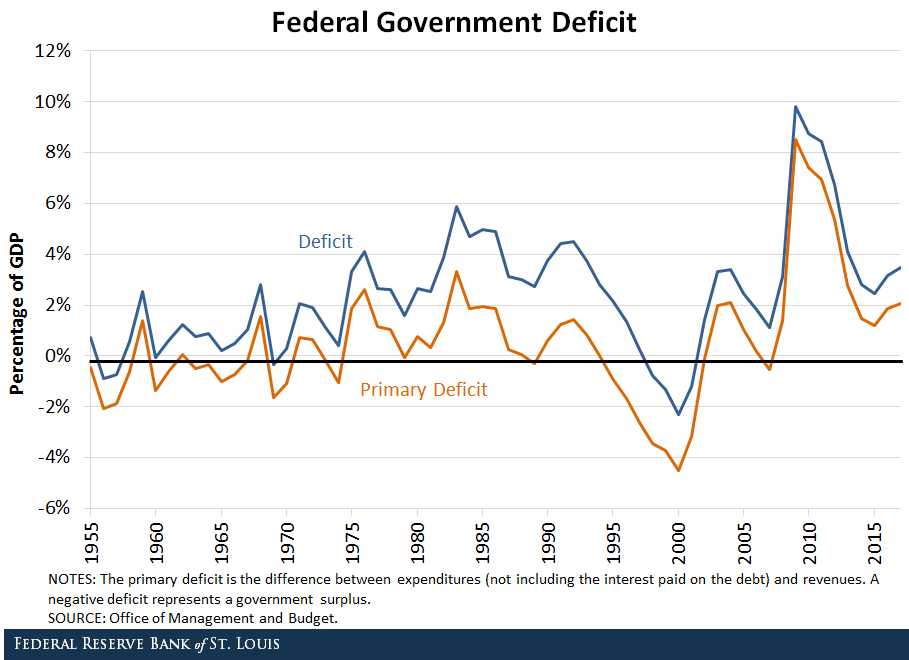
The deficit is defined as the difference between expenditures (including the interest paid on debt) and revenues. If the difference is negative, we get a surplus.

Between 1955 and 2007, the deficit of the U.S. federal government averaged about 1.9 percent of gross domestic product (GDP). In the decade since, the deficit averaged about 5.3 percent of GDP. Roughly two-thirds of this increase is attributable to larger expenditures.

Federal Debt Expansion

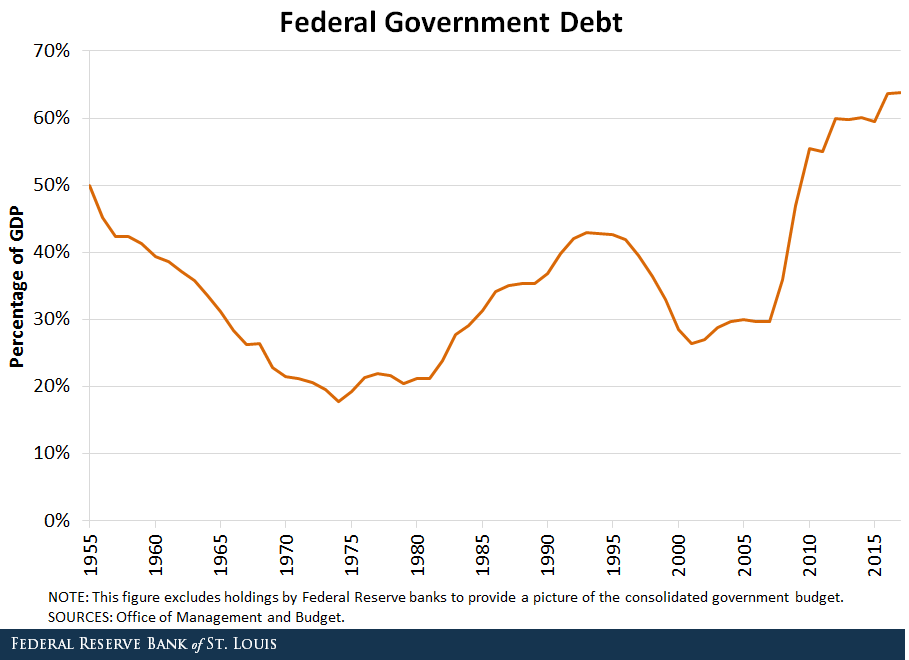
Deficits are financed by issuing debt. Since 2007, the federal debt in the hands of the public has grown at an average annual rate of 11 percent.1 As a share of GDP, it went from about 30 percent in 2007 to almost 64 percent as of the end of fiscal year 2017.2

According to the Financial Accounts of the United States, about 40 percent of this debt expansion was absorbed by foreigners, mostly in Japan and China.3

Before Congress approved the tax cut package in December, deficits and the debt were expected to grow significantly over the next decade.4 The new tax plan is expected to add further to the deficit. Though estimates of how much have varied widely, the most recent put the increase in the deficit over the next 10 years at about 10 percent.5,6

What Can Monetary Policy Do?

By influencing interest rates, the Fed can affect the servicing cost of debt. The current path of monetary policy normalization will imply generally higher interest rates, which will add to the deficit and require the Treasury to issue even more debt, raise taxes or reduce expenditures.

Federal revenues are supplemented by Federal Reserve remittances. These have been unusually large in recent years, about 0.5 percent of GDP, due to the Fed’s large balance sheet. Monetary policy normalization contributes to the expected increase in the deficit, since remittances are expected to decline to historical levels as the Fed’s balance sheet contracts.

The burden of debt can also be alleviated with higher inflation. This is not unprecedented in the United States. For example, after World War II, high inflation was used to finance part of the accumulated debt.7 Arguably, in the post-Paul Volcker era, the Fed has enjoyed increased independence and has not been very accommodative to the Treasury.

Inflation Becoming a Fiscal Phenomenon

However, as government debt has increasingly become more widely used as an exchange medium in large-value transactions (either directly or indirectly as collateral), the control of the “money” supply has shifted away from the Fed. In other words, the more cash, bank reserves and Treasuries resemble each other, the more inflation depends on the growth rate of total government liabilities and less on the specific components controlled by the Fed (i.e., the monetary base).

Thus, inflation becomes more of a fiscal phenomenon. Traditional monetary policy tools, such as swapping reserves for Treasuries, may be less effective in controlling it.

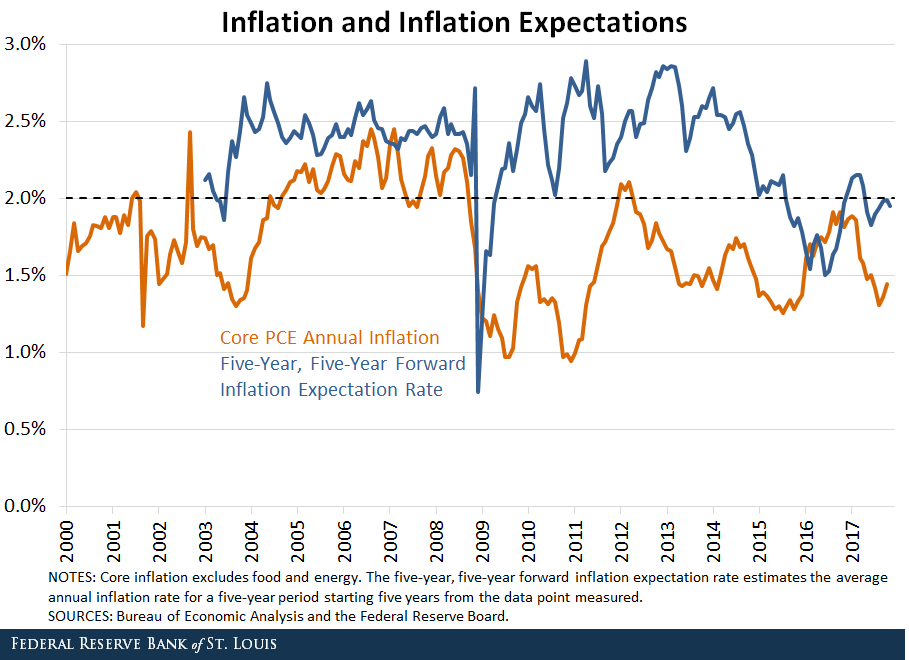
Though government debt has expanded significantly in recent years and is expected to continue growing, inflation and inflation expectations have not diverged far away from the Fed’s target of 2 percent annually. The likely reason is that demand for government liabilities has kept pace with the growth of the supply.

In this sense, during and after the financial crisis of 2007-08, there was a big appetite for U.S.-dollar denominated safe assets. As mentioned at the beginning of this post, 40 percent of the debt increase since the crisis has been absorbed by foreigners.

The high demand for U.S. Treasuries may continue or may reverse. If taste for U.S. debt declines, the projected deficits (with their associated debt expansion) may imply an increase, potentially significant, in inflation in the long run.

In this last scenario, the Fed would face a difficult challenge if facing a strong-headed Treasury and Congress that refuse to lower the deficit in the long run. Increasing interest rates—as during the Volcker disinflation, but now in an era of liquid government debt—may only exacerbate the deficit problems and do little to lower inflation.

Notes and References

1 The official figures of “Debt in the hands of the public” include holdings by the Federal Reserve Banks. I have netted those out since we are looking at the consolidated government budget.

2 The U.S. government’s fiscal year begins Oct. 1 and ends Sept. 30 of the subsequent year and is designated by the year in which it ends.

3 Martin, Fernando. “Who Holds the U.S. Public Debt?” Federal Reserve Bank of St. Louis On the Economy Blog, May 11, 2015.

4 Martin, Fernando M. “Making Ends Meet on the Federal Budget: Outlook and Challenges.” The Regional Economist, Third Quarter 2017, pp. 16-17.

5 For example, see Jackson, Herb. “Deficit could hit $1 trillion in 2018, and that’s before the full impact of tax cuts,” USA Today, Dec. 20, 2017; and The Associated Press. “The Latest: Estimate says tax bill adds $1.46T to deficit.” Dec. 15, 2017.

6 The Joint Committee on Taxation, the Senate’s official scorekeeper, estimates the deficit increase at about $1.5 trillion; the committee’s macroeconomic analysis of the “Tax Cuts and Jobs Act” is available here (JCX-61-17).

7 Postwar inflation (1946-1948) is estimated to have resulted in a repudiation of debt worth about 40 percent of output. See Ohanian, Lee E. The Macroeconomic Effects of War Finance in the United States: Taxes, Inflation, and Deficit Finance. New York, N.Y., and London: Garland Publishing, 1998.