Latest UK Inflation Expectations Stronger

The Bank of England released their latest economic and inflation update. They are now expecting a stronger inflation rate in the short term, higher than their immediate post-Brexit-vote projections.  GDP looks pretty good too.

UK economic activity remained resilient in the second half of 2016. Growth is likely to slow over 2017 as households adjust their spending to lower real income growth resulting in large part from the 18% fall in sterling since late 2015. That fall in sterling will raise CPI inflation, which is likely to return to around the 2% target by February and then rise above it over the following months.

Conditioned on a market path for Bank Rate that rises to just under 0.75% by early 2020, the MPC projects CPI inflation to fall back gradually from the middle of 2018. Continued pass-through of higher import prices means, however, that inflation is projected to remain somewhat above the 2% target at the end of the Committee’s three-year forecast period.

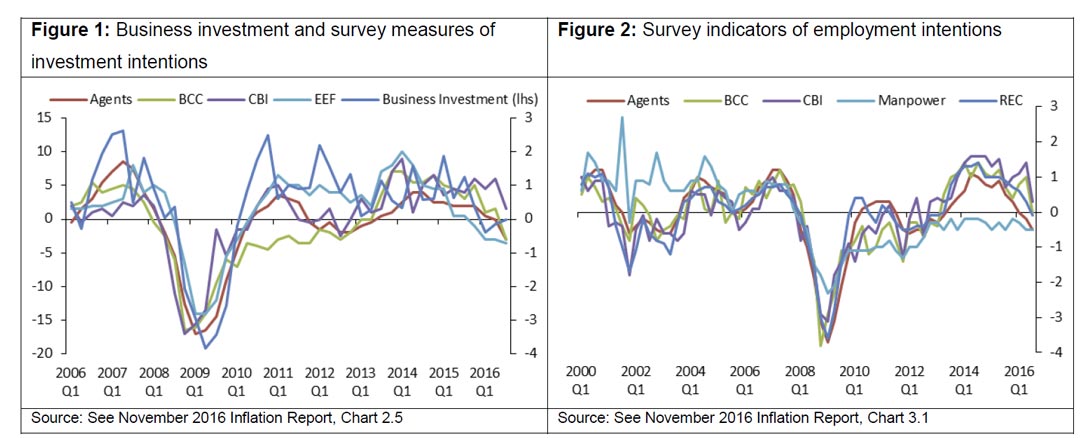
The UK economy has remained resilient, with activity growing at close to its past average rate in 2016. Growth has been stronger than envisaged in the immediate aftermath of the vote to leave the European Union when survey evidence pointed to a sharp slowdown in activity. That partly reflects robust growth in consumer spending, with few signs that households are cutting back expenditure ahead of a squeeze in their real incomes. Official data for investment have been considerably weaker, although above recent expectations. Reinforcing the domestic news, there are signs of increasing momentum in the global economy with a stronger medium‑term outlook in several economies, supported by fiscal policy (Key Judgement 1). That has been reflected in global asset prices, with longer‑term interest rates and equity prices rising.

Domestic demand growth is still expected to slow over the course of this year as higher prices for imported goods and services begin to weigh on households’ spending power (Key Judgement 2). That pulls down four-quarter GDP growth, which settles at around 1¾% from the end of 2017 (Chart 5.1). That slowdown comes a little later than previously assumed. Moreover, the Government’s Autumn Statement represented a fiscal stimulus, relative to previously announced plans, the outlook for global growth is stronger, and credit conditions and equity prices are more supportive. Taking all the news together, the MPC now judges that the growth outlook is stronger than thought in November. Overall, in the central projection that leaves the level of GDP around 1% higher in three years’ time than projected in November. Relative to expectations in the May 2016 Report, just before the EU referendum, however, the level of GDP is still around 1½ lower in the medium term despite the significant monetary, macroprudential and fiscal support since then.

Theresa May confirms: Britain is heading for Brexit Max

From The Economist.

For the past few months Theresa May and her ministers have allowed some ambiguities to swirl around Britain’s future relationship with the European Union. Yes, she confirmed in her conference speech in October, Brexit would take it beyond the jurisdiction of the European Court of Justice and the EU’s free movement regime. Some found this hard to square with reports that special arrangements would be sought for parts of the British economy (like the City of London and carmaking) or with Mrs May’s assurance to businesses that she would seek to avoid a “cliff edge” on Britain’s exit from the club. Many in other European capitals questioned whether Britain would leave at all.

To the extent that such uncertainties persisted despite her endless choruses of “Brexit means Brexit”, at a speech to EU ambassadors in London on January 17th Mrs May put them to the sword. Britain will leave the single market and the customs union, and will thus be able to negotiate its own trade deals with third-party economies. It will not pay “huge sums” to secure sectoral access (a phrase whose precise meaning now matters a lot). She wants this all wrapped up within the two years permitted by Article 50, the exit process she will launch by the end of March; ideally with a “phased process of implementation” afterwards covering things like immigration controls and financial regulation. In other words there will be no formal transitional period. There will, in fact, be a cliff edge of sorts.

This reflects two realities to which policymakers in Britain and on the continent must now get accustomed. First, Mrs May unequivocally interprets the vote for Brexit as a vote for lower immigration even at the cost of some prosperity. Never mind that the polling evidence supporting this assumption is limited: such is now the transaction at the heart of the new government’s political strategy. Second, even allowing for a certain amount of expectation-management, it seems Mrs May is not placing huge importance on the outcome of the talks. She wants a comprehensive free-trade agreement (FTA) based on the one recently signed between the EU and Canada; but where “CETA” took about seven years to negotiate, she has permitted herself two. She said that this might cover finance and cars, but also recognised the importance the EU places on the “four freedoms” (making freedom of movement a condition of market membership), suggesting a realism about the extent of any such FTA in the narrow time constraints available. Mrs May also wants some associate membership of the customs union but declared herself relaxed about the details. In short: she will do her best, but if the talks come to little or nothing, so be it.

Of course, they will be tough. The prime minister will want firstly to maximise the scope of the FTA, secondly to maximise the benefits of any associate relationship with the customs union and thirdly to minimise the precipitousness of the cliff off which British firms will fly in 2019. She hinted at how she intended to do so, characterising the country’s current defence and security co-operation with the continent as a possible negotiating chip and warning that her government could “change the basis of Britain’s economic model” (i.e. turn it into a tax haven) if the EU does not play nice. She also said that she would be willing to walk out on the talks: “no deal…is better than a bad deal.”

So Britain’s economy is in for a rough ride and, though the government will try to smooth it out, the priority is getting the country out of the EU in the most complete and rapid way possible. If the price of this priority is economic pain, then pay Britain must. All of which gives firms some of the certainty they have craved since June 23rd: those fundamentally reliant on continental supply chains or the EU “passport” for financial services, say, now have the green light to plan their total or partial relocation. It also means the Brexit talks will be simpler and perhaps even less fractious than they might have been had Britain tried to “have its cake and eat it”. The country will eat its cake and live with an empty plate afterwards. Brexit really does mean Brexit.

Are the rich really getting poorer and the poor getting richer?

From The UK Conversation.

The median UK household is better off. The poorest households are doing even better than the median, and the richest households have been the greatest losers. At least that’s one way to read the headline statistics put out by the Office for National Statistics (ONS) on January 10 in a new report on household disposable income and inequality.

Yet exactly the same statistics could have been reported in a very different way. In fact, while the poorer 90% of UK households have seen their equality of income improve, all these households are now receiving less in real terms because of the fall in the value of the pound, and this report says nothing about the best-off 10% of households.

Let’s take the three groups, the average, the poorest, and the richest, one by one.

The average household

Does the median UK household now really have more disposal income than a year earlier? Here, the dates being compared are the financial year up to April 2016 compared with the financial year ending in April 2015. According to the ONS, that median disposal income is now £26,300, compared to £25,700 a year earlier. The government statisticians say this is the case after they have accounted for inflation and changes to household composition.

The disposable income being described by the ONS is income after taxes have been paid and benefits have been received – but it is before housing costs have been deducted. So where rent and the cost of buying a home has risen those rises are not been taken into account.

Average UK house prices rose by 8.2% in the year to April 2016. Rents have been rising by similar amounts and fewer young couples are setting up home. If this housing crisis means that fewer grown-up children are able to leave home, household composition would alter and the average household would look a little better off overall because that grown-up child might well have an income.

The poorest households

The incomes of the country’s poorest households – in the bottom fifth of the income distribution – have increased. This is because unemployment has fallen and even very low-paid work pays more than most benefits (if you can get enough hours). However, the reason unemployment has fallen in recent years is because of the most draconian application of benefit sanctions ever applied in the history of the UK.

In 2013, over one million people were sanctioned, losing benefits that amounted to more than all the fines handed out by sheriff’s courts in Scotland and magistrates courts in England and Wales for all the actual crimes committed that year.

What the imposition of sanctions at unprecedented rates showed was that it is possible to reduce unemployment by taking away benefits. To survive, people are forced to take any work that they can possibly find, or move in with relatives or with anyone that will give up a sofa.

This employment growth has resulted in the apparent disposable income of the median household in the worse-off fifth of households appearing to rise by £700 a year, or just over £13 a week. However, for those households in which an extra adult is now working, the cost of actually getting to work every day, of the clothing needed for that work, and the loss in time to care for others (such as children) will be more than that £13 weekly rise.

The richest households

At the same time, the ONS reports that the median income for the best-off fifth of households fell by £1,000 last year. But crucially, this is their median income, and the incomes of the better-off half of all those households are ignored. There is actually greater income inequality in the best-off fifth than between all the other 80% of households put together. Within the best-off tenth, inequalities are huge, with the top 1% of households receiving roughly the same income as the next 9%.

Information on changes to national insurance contributions and child benefit payments, have shown us that most people in the best-off tenth will not have fared well either. But other statistics on the incomes of some of the very best-off (such as top paid bankers) also reveal that those in the very richest 1% have done well over this period.

The number of British bankers paid over a million Euros a year rose from 3,178 to 3,865 in 2014. There is no reason to believe that has reduced. In fact, preliminary figures for 2015 revealed that 971 people working in just four of the large US banks in London received more than a million Euros in pay in 2015, with 11 working for Goldman Sachs getting more than 5m Euros each.

For the poorer 90% of households in the UK, with total household incomes below £53,448 a year, economic inequalities are falling. But they are falling because the people who are poorest are being forced into work that they would not do if they had any choice. They are falling because benefits such as child benefit are no longer universal (top rate tax payers no longer qualify). Or possibly because it is harder and harder for young adults to leave the family home and statistical adjustments for household composition are not sophisticated enough to account for such changes.

Most people are not really financially better-off, other than a tiny proportion of the population in the top 1% who are not even included in these statistics. Most people becoming a little more equal (while a few become very much better off) – as living costs are about to rise even further due to inflation – is not a good news story.

Author: Danny Dorling, Halford Mackinder Professor of Geography, University of Oxford

UK Housing Construction Higher In November

Latest data from the UK’s Office of National Statistics shows that despite the overall fall in all work in November 2016, new housing continued to grow at an increasing overall rate of 1.2% in comparison with October 2016, representing the biggest increment since February 2016. A rise in affordable public housing is a significant factor. This has resulted in housing output reaching an all time high of £2,639 million, as seen in Figure 4.

The increase in housing has occurred in part as a result of the notable rise in public housing, which recovered from negative growth in October 2016 to increase by 5.5%. There was an increase of 13.7% compared with the same period a year ago, the largest month-on-year growth rise since December 2014. This high level of growth comes in the shadow of the government committing to “drive up the housing supply” by providing £8.0 billion to deliver over 400,000 affordable housing starts by 2020.

In addition, private sector housing continued to grow at a steady month-on-month rate of 0.6% compared with October 2016. However, similar to public housing, the private sector has experienced large growth in relation to the same period last year, at a rate of 12.5% which has been broadly consistent throughout 2016. This may be in part due to historically low interest rates facilitating borrowing for construction firms, coupled with the loosening of private housing planning restrictions, both of which could have contributed to the continued boom in private housing both in November 2016 and throughout the year.

How Best To Measure Owner Occupiers Housing Costs

Within the CPI, the costs of housing are included. But as a recent article from the UK’s Office for national statistics shows, this is not straight forward.

Owner occupiers’ housing costs (OOH) are the costs of housing services associated with owning, maintaining and living in one’s own home. There is not a single defined measure of OOH because they can be calculated differently depending on what the target is.

In particular, should OOH be measured at the point of acquisition of the housing service (for example, the net acquisitions approach – NA), the point of use (for example, the rental equivalence approach – RE), or the point at which it is paid for (for example, the payments approach)? Each of these 3 approaches has its own specific methodological strengths and weaknesses, and is measured using different methods.

Although each of the methods measure different aspects of OOH and are therefore not comparable, it is still useful to look at the 3 measures together to see how they differ over time.

The fact that OOH(RE) does not directly follow house prices is not a disadvantage to using the rental equivalence approach in the calculation of the owner occupier’s housing costs component. This is because the rental equivalence approach aims to measure the housing services that are consumed each period, and therefore there is no reason why it should follow the trend of house prices.

Britons Hoard Cash as Economic Uncertainties Prompt Caution

From Bloomberg.

Britons are holding onto their cash in a sign that they may be hunkering down in the face of economic uncertainties, according to the British Bankers Association.

Personal deposits grew an annual 4.8 percent in November, data compiled by the BBA show. They increased by 32.4 billion pounds ($39.7 billion) in the first 11 months of the year, outstripping the 19.8 billion-pound growth in the same period of 2015.


British investors and savers were shaken by the June decision to leave the European Union, which prompted the Bank of England to cut interest rates to a record-low 0.25 percent. While the economy has held up well so far, most economists foresee a slowdown in 2017 as businesses seek more clarity on the nation’s future relationship with the world’s largest trading bloc.

“We’ve seen personal deposits, in particular, grow more strongly in recent months as consumers hoard cash in the absence of higher-yielding, liquid investment opportunities,” BBA Chief Economist Rebecca Harding said. “This growth in personal deposits may also suggest that consumers are looking to grow their cash reserves against potential economic uncertainties, such as an expectation of lower wage growth.”

The BBA figures also showed that approvals for home loans fell 9 percent in November from a year earlier. In the first 11 months of the year, approvals declined 4 percent.

U.K. house prices may only eke out a modest gain next year as economic growth weakens and a pickup in inflation squeezes consumers, according to a separate report by Halifax. The mortgage lender sees housing demand easing in 2017, partly as tax changes and stricter underwriting standards restrict buy-to-let investment.

It highlighted the market in London, where poor affordability means the capital will see a sharper slowdown than elsewhere.


London’s underperformance has also been a theme of 2016, with Brexit and an increase in stamp duty weighing on the market. Luxury home prices in some of the most expensive districts are down more than 10 percent this year, and land values are also dropping. Property website operator Rightmove said this month that the bubble in prime London “continues to deflate,” and it sees prices there declining 5 percent in 2017.

Halifax said prices should find some support from the shortage of property for sale, low levels of building and low interest rates. It forecasts that values will be rising about 1 percent to 4 percent in the U.K. by the end of next year. The most recent official data showed an increase of about 7 percent in October.

The wide range for the forecast “reflects the higher than normal degree of uncertainty” for the economy, it said.

“Slower economic growth in 2017 is likely to result in pressure on employment with a risk of a rise in unemployment,” said Martin Ellis, housing economist at Halifax. “This deterioration in the labor market, together with an expected squeeze on households’ spending power, is likely to curb housing demand.”

The Royal Institution of Chartered Surveyors also sees a slowdown in price growth in 2017, adding to the multiple reports that underscore the recent loss of momentum in Britain’s housing market. It says the supply shortage means the average number of properties on realtors’ books is close to a record low, supporting the outlook for values.

Umbrellas don’t cause rain

In a speech at Sheffield University, external MPC member Gertjan Vlieghe discusses the how the UK economic outlook has evolved recently and what this implies for the stance of monetary policy. He also examines several arguments that have been used to support the idea that low interest rates are counterproductive, either for the economy as a whole, or for a particular sector of the economy.

The UK economy in Q2 and Q3 has held up better than he expected: “Judging by headline GDP at least, the economy has continued in a “business as usual” manner”. However, financial markets seem to be expecting “some economic underperformance relative to pre-referendum expectations.” And investment and employment intentions by UK businesses “are generally below their pre-referendum levels”.

uk-biz-confidence


“Sentiment among UK households, on the other hand, appears rather buoyant”.

Jan argues that “the tension between the fairly pessimistic assessment by financial markets, the cautious assessment by businesses and the rather optimistic response by households so far, cannot last”. It might turn out that financial markets are too pessimistic and the economy continues to grow in a “business as usual” way, in which case I would expect the exchange rate to move higher over time. Or it might mean that households are too optimistic”.

Turning to the stance of monetary policy, the MPC has decided that the current policy rate of 0.25% remains appropriate. “Having an inflation projection that is ½ of a percentage point above the target at the end of the forecast period is uncomfortable for an inflation-targeting MPC. The reason we are willing to tolerate this particular inflation path, is that if we tried to bring inflation down faster, with tighter monetary policy, we would create more slack in the economy – lower real income growth, and higher unemployment”.

The reason why the current policy rate is so low relative to history in the UK as well as in many other advanced economies, is that monetary policy is responding to persistent global disinflationary forces. “It has been raining, so we have all opened our umbrellas”.

Not everyone agrees that this is the appropriate response for monetary policy. “Some argue that low rates themselves are the problem”. Jan argues that “is just a case of erroneously reversing the causality”. “Umbrellas together with rainfall are observed in many countries. Nobody actually believes that umbrellas cause rainfall”. “We have had several low interest rate, low inflation countries that have raised interest rates over the past decade. This was not followed by an escape from the alleged confidence trap”. “Higher interest rates, far from boosting demand and inflation, have caused growth to slow and inflation to fall”. “Some of these countries now have even lower short term and long term interest rates than the UK, as inflation expectations have drifted lower”.

Next he considers the argument that “low rates are a problem because they hurt savers”. This ignores the fact that savers hold significant amounts of non-deposit assets, which benefit from low interest rates and asset purchases. Moreover, many savers also work, and low interest rates “have helped lower the unemployment rate” and “have boosted wage inflation”. He presents evidence that the additional income to savers from the improvement in the economy due to lower interest rates is similar to the additional income earned by borrowers.

Jan considers the impact of low interest rates on defined benefit (DB) pension schemes: “the conclusion is not to deny that lower long term rates make life more difficult for pension funds. But, first to acknowledge low long term interest rates are not primarily caused by monetary policy, they are caused by other factors that monetary policy is reacting to. Second, that there is no evidence yet that large pension deficits are weighing on business investment. Third, that arguing for tighter monetary policy to help pension funds ignores the big offsetting effect accommodative policy has on corporate profitability through higher demand and lower cost of investment, and ultimately higher long-term interest rates.”

As well as considering the impact on DB pension schemes, Jan considers the plight of pensioners themselves. He shows that “Since the financial crisis, retired households have experienced faster income growth than non-retired households”.

After looking at these different groups within the economy, he concludes that “there is no evidence that monetary stimulus has hurt them, once the broader effects of monetary policy on employment, wages, profits and the prices of widely held assets are also taken into account”.

He asks whether “Even if, in further research, we were to find a specific group that had unambiguously suffered from very low interest rates, what would be the right policy prescription? Should monetary policy try to help them by tightening?”

He argues that “The suffering group would get a larger share of a shrinking pie. As monetary policy makers, we are trying to meet the inflation target by growing the pie in line with potential, and letting the government decide how to divide it up, using its fiscal and structural policy tools. Monetary policy cannot solve distributional issues, and should not be asked to try.”

Tories shift to growth strategy in an Ed Balls-style pirouette

From The Conversation.

Needing to perform a fiscal twist in a confined space, it looks like Philip Hammond has borrowed some dance steps from former shadow chancellor Ed Balls. Despite some mockery of his recent turns on TV show Strictly Come Dancing, Balls’ footprints are clearly visible on the spending boost the chancellor unveiled in his first Autumn Statement.

Balls regularly castigated the 2010-15 coalition government for being too hasty to cut public spending and raise VAT. He called, in particular, for a boost to infrastructure, skills and housing investment on the basis that without it, a stifled economic recovery would delay the return to budget balance.

Six years on, Hammond has taken much the same stance. Attempts to achieve a budget surplus have been pushed elusively forward to “the next parliament”. Meanwhile, the focus shifts to boosting growth, following a forecast downgrade by the Office for Budget Responsibility, with adverse implications for tax revenues.

To protect against another slowdown, additional spending on public infrastructure (especially housing, roads and telecoms) has been announced. Meanwhile, he is also slipping in some tax reductions – including a return to the 50p top rate and a reduction of taxes on in-work benefits – in case the Supreme Court’s Brexit verdict forces an early election.

Big infrastructure projects are a favoured way to kickstart stalling economies because they can quickly create jobs in areas that most need them. They also generate income that mostly gets spent, boosting other activity. Such projects can pay for themselves through extra tax revenues which then shrink the budget deficit in relation to GDP. Hammond’s quickstep addition is an annual £2 billion boost to research and development, aimed at making those already in work more productive.

Ed Balls. Nick Ansell PA Wire/PA Images

George Osborne did something similar. Following the failure of austerity and a dip back into recession in 2011-12, he quietly reinstated several of the initially-suspended infrastructure programmes. Hammond has signalled an intention to go much further with an extra £23 billion to be channelled in the first five years with his new investment fund. His hope is to reverse the impending slowdown and Brexit aftershocks.

Selective credibility

It’s not the first time that a party committed to cautious and balanced fiscal policy has veered towards plans it once mocked as ill-timed and irresponsible. A Keynesian-style stimulus – running a deficit to spur growth, and so raising national debt – has historically been easier for Conservative than Labour governments in the UK, and for Republican than Democratic presidencies in the US.

This is because conservatives normally push for lower taxes, based on the belief that tax reductions will actually close a budget deficit by boosting people’s ability and willingness to pay taxes. This wilts under economic analysis. And when reality bites, a switch is made from taxing less to spending more on structures that can constitute a public asset as “security” for the additional public debt.

Labour broke the deficit-boosting record in 2008-10 – but only after the unprecedented bailing-out of a collapsed financial sector. It had previously reduced the public debt, by moving the budget into surplus earlier in its term. Yet the Conservatives, with Hammond now as chancellor, have used the idea of Labour’s “fiscal irresponsibility” to justify huge public spending cuts.

Infrastructure spending. shutterstock.com

While the deficit has steadily narrowed since 2010, Osborne’s missed targets have meant the Conservative-led governments have added more to public debt than the Labour administration they replaced. Indeed, Labour governments – often elected after a boom has collapsed, and never trusted to borrow as much – have run consistently tighter budgets than those who accuse them of reckless spending.

Hammond’s new investment fund looks very much like the long-term investment bank that Labour has long dreamed of, and never succeeded in, launching.

The Conservatives argue that they can now afford some fiscal relaxation, having earned “credibility” through Osborne’s years of austerity. By drumming home the idea that they will shrink public spending to the smallest fraction of GDP since the 1930s and continuing to lambast Labour for leaving such a large deficit, they manage to deflect criticism. Yet the OBR has confirmed that weaker GDP growth and tax receipts left the 2015-16 deficit at £76 billion, four times its £18 billion forecast.

Is the timing right?

Chancellor Hammond can also argue that historically low interest rates on public debt make this the right time for governments to borrow more. In a world seemingly awash with capital and large corporations sitting on mountains of cash, tax cuts haven’t delivered the needed boost to enterprise, so the state must take a more direct hand.

But the six-year gap between Balls’ and Hammond’s plans may also present problems for the Treasury. With more inflation on the horizon and the UK’s credit rating heading downwards, the government’s phase of virtually costless long-term borrowing is coming to an end. Even yields on long-term bonds are rising, despite the Bank of England halving its base rate to 0.25% immediately after the June 23 referendum.

While big projects may cost more to finance under Hammond than if Osborne had launched them earlier, their growth-reviving benefits may also turn out to be smaller. The multiplier effect of deficit spending on national income is highest when labour markets and consumer spending are slackest, as they were in the UK in 2011-12.

Today, although the economy hasn’t grown enough to close the deficit, most of that slack has been taken up. Unemployment is at its lowest for a decade, employment at its highest since records began, and spare resources could soon be even scarcer if the UK adopts a hard Brexit, with tight immigration controls. In these conditions, firms building the extra houses, roads and railways could find themselves bidding for additional employees and raw materials, driving up costs and prices rather than output and employment.

Rising labour costs are, of course, economists’ code for the higher pay which voters – and the Chancellor’s party – expect to gain when Brexit uncertainty settles. If that promise secures the government’s re-election by 2020, Ed Balls could well claim to be the ghostwriter denied a royalty.

Author: Alan Shipman, Lecturer in Economics, The Open University

Big housebuilders won’t dig a way out of the housing crisis on their own

From The Conversation.

The UK has long been in the grip of a housing crisis. Back in 2004, respected economist Kate Barker carried out a major review of housing, concluding that if the low rates of construction continued, it would increase levels of homelessness and continue to make housing less affordable.

Ten years later, it’s clear that these urgent warnings fell on deaf ears. In 2004/05, when Barker’s report was published, 205,000 houses were built in the UK. In 2014/15, only 153,000 homes were constructed. As each year passes, the backlog of demand for housing grows larger, leading to rising house prices and greater numbers of households in rented accommodation.

Currently, almost 80% of all new dwellings are built by private house builders. In 2014/15, just ten companies were responsible for nearly half of the new homes developed. But it has not always been this way. In the 1960s and 70s, there were several years when local authorities and housing associations developed more houses than all private companies put together.

Prioritising profit

The issue of who builds housing matters, because government has so little control over the decisions and actions of private house builders. And since the 2008 recession, what has become clear is that the biggest house builders have been growing their profits much faster than they have been building new houses.

Our recent research shows that from 2012 to 2015, the number of new houses built by the five largest private house builders grew by 31%. Meanwhile, their revenues increased by 76%, and their end-of-year profits (after taxation and various other deductions) increased by over 200%. It seems that maintaining the scarcity of new housing keeps sale prices high, which removes the incentive to significantly increase the number of dwellings being built.


Steep. Images_of_Money/Flickr, CC BY

Of course, profit-making can be helpful, if firms then reinvest in more house building. But in 2015, the five biggest house builders returned 43% of their annual profits to shareholders in dividends. Our research suggests that if this had been reinvested in building more homes, nearly 9,000 extra houses could have been built – equivalent to a 6% increase in annual output.

It could also be argued that shareholder investment makes such house building possible, and that dividends are a fair price to pay. Yet this still leaves us with an uncomfortable conclusion; that an increase in housing supply depends on whether just a few companies decide to reinvest or pay out to shareholders.

Changing direction?

For many years after the 2008 financial crash, senior politicians did little to highlight or address this issue. But recent announcements by the government suggest a shift in political direction. Sajid Javid, the government minister responsible for housing, recently declared that “the big developers must release their stranglehold on supply”.


Sajid Javid. Foreign and Commonwealth Office/Flickr, CC BY

This echoes the more general statements made by the new prime minster: Theresa May has suggested that her government will intervene in dysfunctional markets – and the market for new houses could well be the first in line.

The forthcoming Autumn Statement promises increased government investment in housing. A series of new measures were recently announced, including the £3 billion Home Building Fund. This will be targeted at small and medium-sized developers, and may work to lessen the dominance of the large firms.

What does not seem to be on the government’s agenda, however, is the introduction of measures that would increase building by local authorities, housing associations and other non-profit bodies – in spite of proposals by sector representatives which outline how this could be achieved.

The government could do much more to increase public sector house building. Possible measures include allowing not-for-profit and public bodies to use more of their reserves for housing, and lifting borrowing restrictions. A wide range of economists have advised the government to borrow for investment in physical infrastructure.

Housing is not currently categorised as infrastructure, but treating it as such could generate economic gains, while addressing the growing shortfall in housing. What is for sure is that the house building industry on its own will not supply the homes which the UK so desperately needs.

Author: Tom Archer, PhD Candidate, Sheffield Hallam University

Tesco Bank breach causes 20,000 customers to lose money

Tesco Bank, the U.K. finance subsidiary of Tesco supermarkets suffered a horrendous cyber-attack last week, with some 20,000 customers loosing money from their bank accounts thanks to a widespread attack. Some speculate this was as “inside-job”.

Cyber security is a critical issue for the safety banks and their customers. Whilst individual customers may sometimes be attacked this was a breach on a whole different scale. Take note!

risk-pic-2

This from Network World:

The fine details are still murky, but news surfaced in the last day or two that Tesco Bank, a U.K.-based bank owned by the Tesco supermarket chain, suffered some sort of widespread fraud.

The bank’s CEO, Benny Higgins, told Radio 4 that around 40,000 of the bank’s 7 million accounts had seen “some sort of suspicious transactions.” Of those, around 20,000 customers have actually lost money from their bank accounts. In the interview, the CEO told the BBC he was “very hopeful” that customers would be refunded the lost funds. What he didn’t say is that I am sure he is also “very hopeful” that once this all washes up he and his IT team will still have jobs.

Customers have, at this stage, been blocked from making online transactions, suggesting that the fraud is related to online functionality. Transfers between and to other account holders are still being actioned, however. Banking security experts seem to be unanimous that both in terms of the scale of the breach, and the depth of it, this is an unprecedented event.

Customers who have been impacted by the losses received text notifications and, as would be expected, the U.K. media is full of emotional stories of customers unable to pay for their groceries, gasoline or heating fuel. But while the human aspect is important and very troubling, there is, of course, an IT aspect to this that is particularly interesting.

Bank was running a system from a newer banking technology vendor

Interestingly Tesco Bank reinvented its core banking technology a few years ago, moving away from a big legacy solution and instead investing in a core banking system from FiServ, a newer banking technology vendor. I’ve long been a critic of banks that stick to big old (often mainframe-based) solutions and have pointed out that these systems severely limit banks’ ability to innovate and gain agility.

I’ve been a proponent of “decoupling” systems and discussed the topic at length with Dawie Oliver, CIO of Westpac Bank. Of course, we don’t yet know for sure that the issue lies with FiServ or any parts of Tesco Bank’s core systems, but the sheer scale of this breach would suggest that it does. We also, it must be said, can’t rule out nefarious insider activity, although in fairness, fraud detection systems should be able to identify both inside and external attack vectors.

Ilia Kolochenko, CEO of web security company, High-Tech Bridge, commented: “The situation is not clear yet, and it’s too early to make any conclusions about the origins and the source of the breach. In the past, similar incidents involved many different approaches: from e-banking system compromise to targeted spear-phishing and social engineering campaigns aimed at infecting bank clients’ machines or mobile devices with sophisticated malware, stealing money from their accounts. A massive skimming campaign cannot be excluded either.

Kolochenko adds some color, saying:

“It is important to highlight that such a large-scale attack with important financial losses would hardly be possible without some insider help to the attackers. Banking system, compliance processes and fraud-prevention systems are usually bank-specific, and in order to bypass them (we can speak about successful bypass, as so many people have already lost their money) we need to have some insider knowledge. Nevertheless, we need to wait for the official investigation results before making any conclusions.”

I’ll continue to watch this developing story. Meanwhile, at least Tesco Bank’s ownership status means that its IT team have a good source of over-the-counter pain medication. Something tells me they’ll need it.