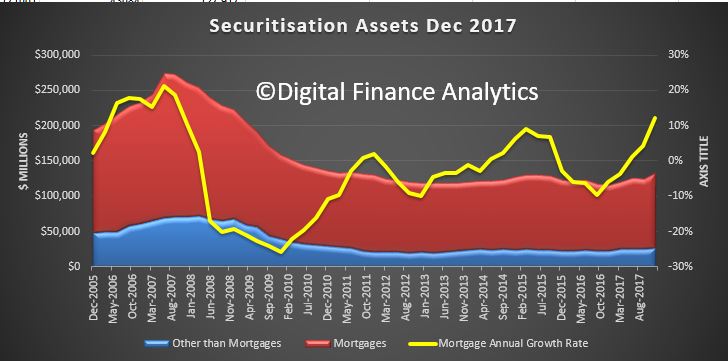
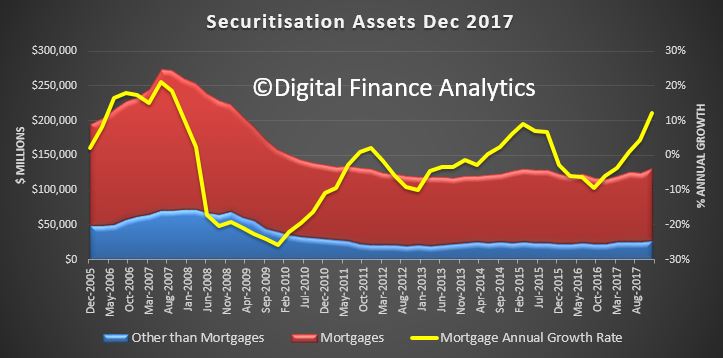
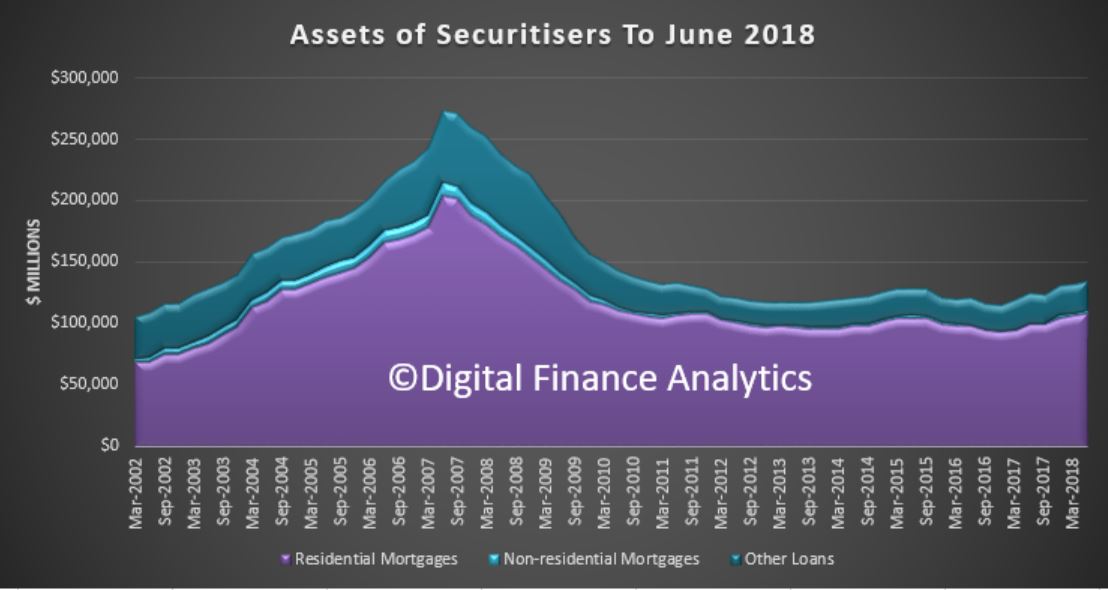
In the past year residential mortgages securitised rose by 8.9% to $108.8 billion. Overall securitised assets rose by 8.2%, which shows mortgage assets grew stronger than system.
This reflects what we have seen in the market with non-bank and some bank lenders using this funding channel. The rise of non-bank securitisation is a significant element in the structure of the market. As major lenders throttle back their lending standards, more higher risk loans are moving into the non-bank and securitised sectors. Of course a decade ago it was the securitised loans which took lenders down in the US and Europe.
The growth we are seeing here is in our view concerning, bearing in mind the more limited regulatory oversight. Plus. on the liabilities side of the balance sheet, around 90% of the securities are held by Australian investors, a record.
This includes a range of sophisticated investors, including super funds, wealth managers, banks, and high-net worth individuals. But the point to make is that if home price falls continue, the risks in the securitised pools will grow, and this risk is fed back to the investor pools.
Another risk-laden feedback loop linked to the housing sector, and one which is not fully disclosed nor widely understood. The fact that the securitised pools are rated by the agencies does not fill me with great confidence either!
The stock market is at record highs and people with FICO scores as low as 500 are once again happily obtaining mortgages. Not only that, but these mortgages are once again being securitized and are in demand by yield chasers.
All of the elements that are necessary for the 2008 subprime crisis to repeat itself are starting to fall back into place. Aside from the fact that we have inflated bubbles across basically all asset classes for the most part, not the least of which is evident in the stock market, the Financial Times reported today that not only are subprime mortgage backed securities becoming prominent again, but that the chase for yield was what fueling demand:
Issuance of securities backed by riskier US mortgages roughly doubled in the first quarter from a year earlier, as investors lapped up assets blamed for bringing the global financial system to the brink of collapse a decade ago. Home loans to people with scratches and dents in their credit histories dwindled to almost nothing in the aftermath of the crisis, as litigation-weary lenders retreated to patch up their balance sheets.
But over the past couple of years a group of specialist firms has begun to bring the loans back, navigating a dense web of new rules drawn up to protect borrowers and investors in the $9.3tn US home-loan market. Last year saw issuance of $4.1bn of securities backed by loans that would have been called “subprime” before the last financial crisis, according to figures from Inside Mortgage Finance, with the pace picking up in the latter half of the year. The momentum has continued into 2018, with deals worth $1.3bn in the first quarter — twice the $666m issued in the same period a year earlier.
Our central banks have done such a great job of getting us out of our last crisis that the recovery has prompted a mortgage originators and real estate investors to basically do the same exact thing that they were doing 2006 to 2007. After all, mortgage levels are already almost back to 2008 levels.
If that wasn’t disturbing enough, the hedge fund partner that FT quotes in the article says that the subprime market has “a lot of room to grow“ as if it were some type of new emerging market generating productivity, and not just a carbon copy repeat of exactly what happen nearly 10 years ago.
“The market is . . . starting from such a small base that it has a lot of room to grow,” said Jamshed Engineer, a partner at Axonic Capital, a New York hedge fund with more than $2bn in assets under management.
“[Investors] are definitely chasing yields. Whenever these deals come out, for the most part, they are oversubscribed.”
Relaxes a host of reporting requirements for small – medium banks, and to a smaller extent, large banks
Eliminates a reporting requirement introduced by Dodd-Frank designed to avoid discriminatory lending
Relaxes stress testing requirements intended to show how banks would survive another financial crisis
Raises the threshold for banks which are not subject to enhanced liquidity requirements, stress tests, and enhanced risk management, from $50 billion to $250 billion – exempting several institutions which could pose systemic risks down the road.
Allows megabanks such as Citi to count municipal bonds as “highly liquid assets” that could be used towards the “liquidity coverage ratio,” – assets which can be quickly liquidated during a crisis.
Calls for a report on the risks and benefits of algorithmic trading within 18 months
Despite the fact that the FT states that 500 FICO scores are getting approved for mortgages, S&P, one of the willfully ignorant and blind rating agencies that missed the subprime crisis thinks that everything is going to be fine:
“The risk is contained, in our view,” said Mr Saha.
For the way that our Federal Reserve has addressed the problems of 2007 or 2008, these are the end results that they deserve, but the American people ultimately do not.
Pepper, a major alternative lender has priced its largest ever securitisation deal amid strong investor interest. As we highlighted recently there has been a surge in securitised deals as pricing have sharpened, with a 13% rise, mainly driven by home loans. Most issuance is in Australia, as opposed to offshore investors.
Pepper Group has priced its first ever $1 billion RMBS issue, Pepper Residential Securities Trust No 20 (PRS20). PRS20 attracted the strongest ever over-subscription, exceeding $2 billion demonstrating extremely strong and diverse investor interest.
Commenting on this significant achievement for Pepper, Mario Rehayem CEO Australia said “As our first billion dollar securitisation, this is a real milestone for everyone at Pepper. This transaction is a strong endorsement of Pepper’s business, its loan quality and expertise as a lender to the many customers who are underserved by the banks.”
The transaction’s funding strategy resulted in an efficient overall cost of funds for the transaction. Pricing was competitive in a market experiencing increasing global volatility. All Australian tranches priced at or inside the equivalent PRS 19 tranches from October 2018. The senior USD 150 million AAA rated 1 year bullet note priced at 1m US Libor plus 50bps and the senior AUD 205 million and AUD 300 million AAA rated pass through notes priced at 1m BBSW plus 65bps and 1m BBSW plus 120bps respectively. The AUD 130m AAA rated Class A2 notes and AUD 85m AA rated class B notes priced at 1m BBSW plus 155bps and 190bps respectively. Senior tranches were structured in a manner that met identified demand from global investors by issuing dual short duration tranches denominated in US and Australian Dollars.
Commenting on the pleasing outcome, Pepper Group’s Australian Treasurer, Matthew O’Hare, said “The efforts we have made to broaden our investor base has paid off with new investors across every tranche and an ever increasing offshore investor presence evident in this transaction. Importantly, we have attracted a significant number of new “real money” investors further diversifying our investor base. We are truly delighted with the support shown by our many valued Australian and offshore clients and with the addition of 4 new investors to our program.”
Pepper Group was assisted in this transaction by National Australia Bank (Arranger) and nabSecurities LLC and Citigroup Global Markets Inc (Joint Lead Managers) and Commonwealth Bank of Australia and Westpac Banking Corporation (Co-Managers) on the US notes and Commonwealth Bank of Australia, National Australia Bank and Westpac Banking Corporation (Joint Lead Managers) on the AUD notes.
Since inception, Pepper has issued over AUD$11.6 billion of RMBS across 26 non-conforming and prime RMBS issues, making it one of the most experienced and regular issuers in the market.
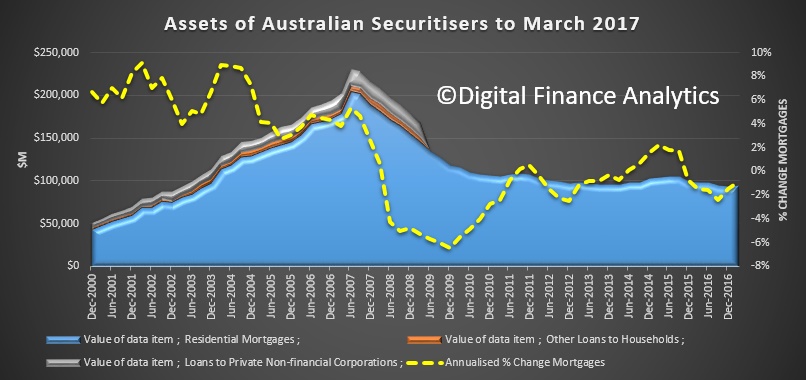
At 31 December 2017, total assets of Australian securitisers were $132.5b, up $7.3b (5.9%) on 30 September 2017. During the December quarter 2017, the rise in total assets was primarily due to an increase in residential mortgage assets (up $6.0b, 6.0%) and by an increase in other loans assets (up $0.9b, 6.1%).
You can see the annual growth rates accelerating towards 13%. The non-banks are loosely being supervised by APRA (under their new powers), but are much freer to lend compared with ADI’s. A significant proportion of business will be investment loans.
This is explained by a rise in securitisation from both the non-bank sector, which is going gangbusters at the moment, and also some mainstream lenders returning the the securitised funding channels, as costs have fallen.
There is also a shift towards longer term funding, and a growth is securitised assets held by Australian investors. Asset backed securities issued overseas as a proportion of total liabilities decreased to 2.6%.
At 31 December 2017, total liabilities of Australian securitisers were $132.5b, up $7.3b (5.9%) on 30 September 2017. The increase in total liabilities was primarily due to an increase in long term asset backed securities issued in Australia (up $8.6b, 8.0%). This was offset by a notable decrease in short term asset backed securities issued in Australia (down $1.1b, 22.8%), and loans and placements (down $0.3b, 4.1%).
At 31 December 2017, asset backed securities issued in Australia as a proportion of total liabilities increased to 89.8%, up 0.7 percentage points on the September quarter 2017 proportion of 89.1%. Asset backed securities issued overseas as a proportion of total liabilities decreased to 2.6%, down 0.1 percentage points on the September quarter 2017 proportion of 2.7%.
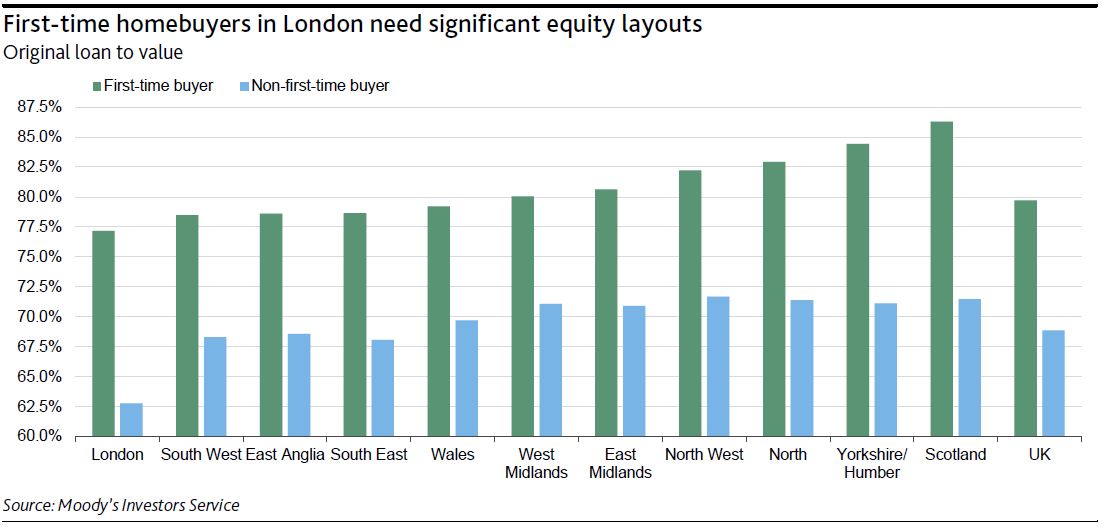
On 22 November, the UK government announced a number of measures in its Autumn Budget, including a stamp duty reduction that will benefit 95% of first-time homebuyers, with a maximum saving of £5,000 per buyer. For purchases completed on or after 22 November 2017, first-time buyers do not have to pay stamp duty on properties worth up to £300,000, while for properties worth up to £500,000 they pay £5,000 less. The stamp duty for purchases above £500,000 is unchanged. Such measures will be credit positive for residential mortgage-backed securities (RMBS), allowing first-time buyers to amass the down payment they need to take out a loan faster or allow them to borrow a larger amount, strengthening both housing demand and property prices and lowering market-implied loan-to-value ratios on existing loans.
The stamp duty reduction will help alleviate some of the financial burden on first-time buyers amid stagnant wage growth, proportionally more household cost expenditures, and rising rents (rental price inflation in the UK has slowed recently, but was up 0.9% in October 2017 versus a year ago, according to HomeLet). Nevertheless, first-time buyers, especially in London and surrounding counties, still face relatively high equity layouts compared with other regions. Our recent RMBS pool analysis also showed that compared with non-first-time buyers, first-time buyers start with up to 15% less equity in the property (see exhibit).
The budget also confirmed additional funding under the help-to-buy equity loan scheme, another credit positive because it increases the availability of loans for borrowers, while supporting house prices, which overall we expect will remain flat in 2018. Under the scheme, borrowers can purchase a newly built property with just a 5% deposit. Since its launch, borrowers have purchased 120,864 properties, with 81% of the sales attributable to first-time buyers. In 2017, Halifax Ltd. estimated that first-time buyers accounted for almost half of all mortgage-financed house purchases, an important driver of housing demand.
Two insights. First the LVR distribution (skewed because of the securitisation rules). But her claim “on average, securitised loans appear to be no riskier than the broader population of mortgages, at least on these metrics” is unproven. Second there is an interesting distribution of mortgage rates, between interest-only and principal and interest loans, the latter being significantly higher. There is now a greater proportion of principal-and-interest loans with an interest rate below 4 per cent, due to the lower rates applied to owner-occupier loans, and there has reportedly been increased competition for these types of loans.
Absolutely no discussion on the critical Loan to Income ratios, which should be available in the data!
The dataset includes two types of residential mortgage-backed securities (RMBS): ‘marketed securities’, which have been sold to external investors, and ‘self-securitised’ deals. Self-securitisations are retained by the bank that created them and are used solely to access central bank liquidity. The Reserve Bank accepts self-securitised assets for this purpose for a number of reasons, most notably a shortage of securities considered to have sufficient credit quality and liquidity. However, the Reserve Bank accepts as eligible collateral only the highest credit quality asset-backed securities, that is those with a AAA, or equivalent, rating.
The insights I will talk about today come from the loan-level data underlying these securities. Loans underlying securitisations are not necessarily representative of the entire mortgage market across all its dimensions. In particular, the choice of mortgages in the collateral pool may be influenced by the way credit ratings agencies assign ratings, investors’ preferences and also by the Reserve Bank’s repo-eligibility framework. However, self-securitisations, which represent the bulk of the dataset, cover a significant share of all mortgages in Australia. For this reason, we could expect the mortgages underlying self-securitisations to be more representative of banks’ balance sheets than those of marketed RMBS.
Data are currently received each month (with a one-month lag) on 1.6 million individual mortgages, with a total value of around $400 billion. This accounts for about one-quarter of the total value of housing loans outstanding in Australia. Around 100 data fields are collected for each mortgage, covering a broad range of variables including loan characteristics, borrower characteristics and details on the collateral underpinning the mortgage.
The Securitisation Dataset allows us, along with other investors in asset-backed securities, to undertake a rich analysis of the securities they hold and more accurately assess their risk and pricing than would be possible without this information. In our case, it allows us to undertake our own risk assessment and not be dependent on rating agencies. But the loan-level data also enable us to gain valuable insights into mortgages that are not readily available from other sources. Today I want to share with you some of these insights.
Mortgage Characteristics
So, what do the data tell us about the loans underlying securitisations and so about the risks faced by investors in these securities?
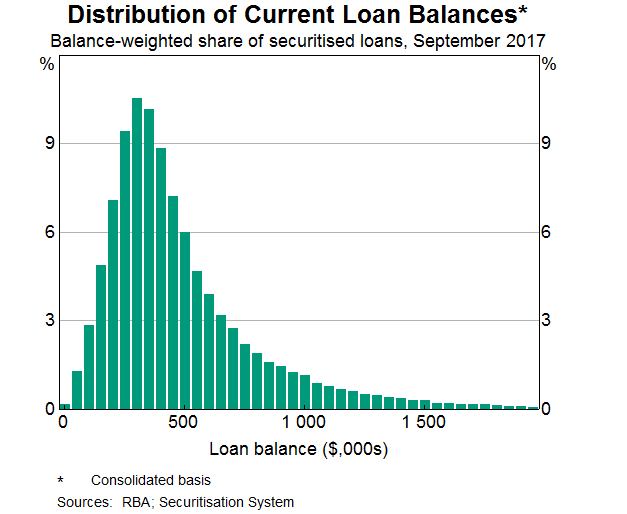
Let’s look at the current size of outstanding mortgages. The average loan size in the dataset is $300,000 (ignoring any funds held in offset balances). Mortgages underlying securitisations appear to be, on average, smaller than the population of all mortgages. This graph shows the distribution of loan sizes (using a histogram) (Graph 1). Each loan is weighted by its balance, such that larger loans are given a larger weight. Weighting the distribution provides a more accurate reflection of potential exposures from a risk perspective. As you can see, there is a wide range in the size of mortgages; by value, 7 per cent of loans have a balance greater than $1,000,000.
Graph 1
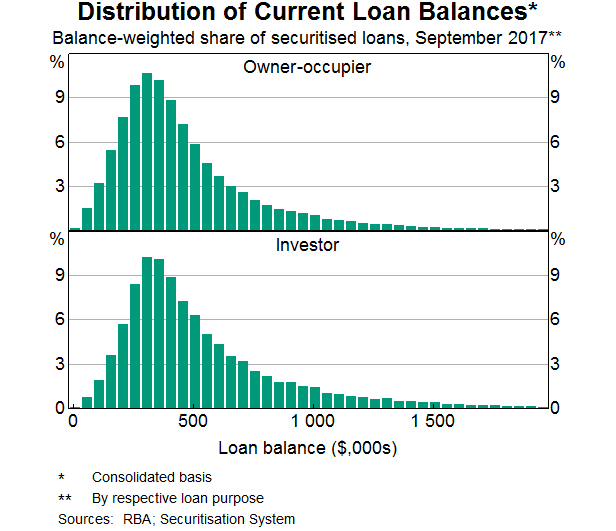
Let’s look at owner-occupier and investor loans separately (Graph 2). The distribution of loan size is similar for the two groups but there is a greater proportion of large investor loans. This could reflect the tax incentives for investors to take on and sustain more leverage than owner-occupiers, maximising the amount of funds borrowed and limiting repayments. But it also reflects that investors appear to have a higher ability to pay off larger loans. For each mortgage in the Securitisation Dataset we also have information on the borrower, including their income. We find that borrowers with investor loans typically have higher incomes than those with owner-occupier loans and so have a greater borrowing capacity.
Graph 2
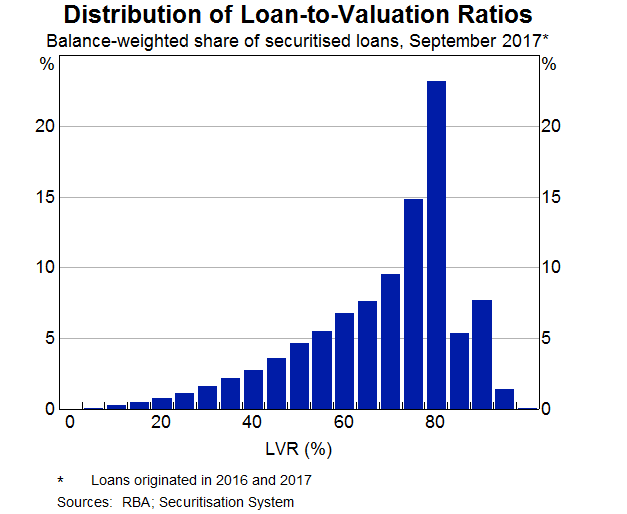
The loan-to-valuation ratio (LVR) is an important indicator of the riskiness of a loan. Here we show the distribution for LVRs based on the current loan balance and the most recent available property valuation for mortgages issued over the past two years (Graph 3). You can see a concentration of loans with LVRs between 70 to 80 per cent – around one-third of loans are in that group – but only a small share of loans have LVRs higher than that. This reflects a few factors. Banks limit loans with LVRs (at origination) above 80 per cent, and these high-LVR borrowers are typically required to pay for lenders’ mortgage insurance. Also, credit rating agencies apply large penalty factors in their credit risk assessments of high-LVR loans in a collateral pool. So it’s not surprising that there are relatively fewer high-LVR loans in the Securitisation Dataset compared with the broader population of loans.
Graph 3
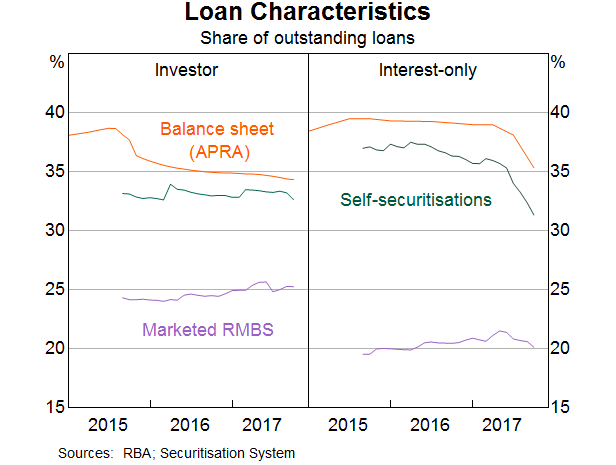
Let’s turn to investor and interest-only loans; these have received some attention from regulators in recent years. This has included measures by the Australian Prudential Regulation Authority (APRA) to tighten lending standards on these types of loans. The next graph shows the share of investor and interest-only loans in the Securitisation Dataset and a measure from APRA that covers the broader housing loan market (Graph 4). The first thing to note is that marketed securities have a lower share of investor and interest-only loans than the general population captured by the APRA data. For self-securitisations, these shares are more closely aligned to the composition of the banks’ total mortgage portfolio. The second point of interest is the very recent large decline in interest-only loan shares in self-securitisations, which is consistent with changes in the broader stock of outstanding mortgages; these declines have occurred alongside measures by APRA to limit new interest-only lending.
Graph 4
To summarise so far, we have looked at a number of characteristics of securitised mortgages that can be associated with the riskiness of these loans, in particular LVRs and whether they are investor or interest-only loans. Two things stand out: there is a wide distribution of these characteristics across different loans and, on average, securitised loans appear to be no riskier than the broader population of mortgages, at least on these metrics.
Mortgage Interest Rates
Variation in interest rates across loans is an important way for lenders to account for the different risks of mortgages. More creditworthy borrowers or lower-risk mortgages are typically offered lower interest rates, while borrowers with higher-risk mortgages would expect to pay higher interest rates. Interest rates on mortgages may also be influenced by other factors such as competition between lenders, bank funding costs, the regulatory environment and policy settings.
There are different types of measures readily available when assessing mortgage interest rates, such as standard variable rates or package rates. However, these measures do not necessarily reflect interest rates actually paid, since banks typically apply unadvertised discounts. Some of the variation in rates actually paid reflects variation in creditworthiness across borrowers. The Securitisation Dataset includes the actual interest rate paid on each mortgage and so can provide both timely and granular insights into housing interest rates that are not available from many other sources.
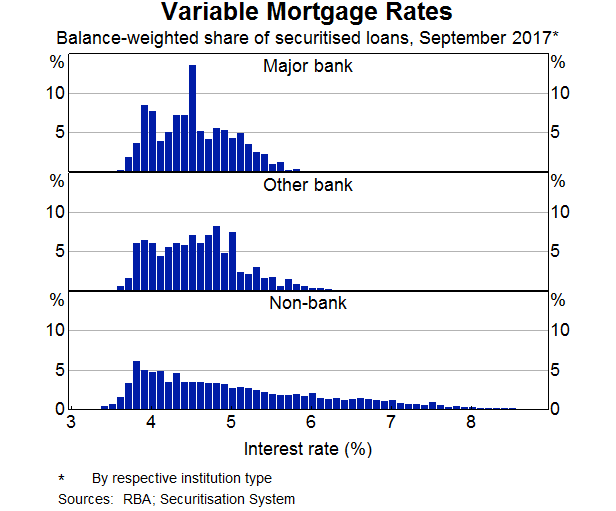
The next graph shows the distribution of interest rates paid on variable-rate mortgages across different lenders (Graph 5). The major banks offer a wide range of interest rates but the distribution is comparable to smaller banks. There is an even wider range of interest rates offered by non-bank lenders. This wider range to a large extent reflects that this category covers a variety of lenders targeting different types of borrowers and mortgages. There are some non-bank lenders that offer products with a similar level of interest rates to the banks. Other non-bank lenders specialise in providing riskier mortgages, such as to borrowers that require ‘alternative’ or low-documentation loans or have impaired credit histories.
Graph 5
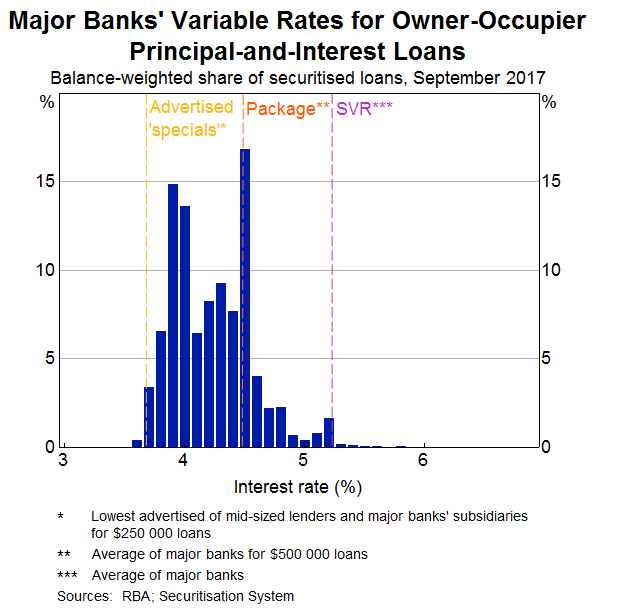
The most common mortgages in the Australian housing market are owner-occupier loans with principal-and-interest repayments. So, let’s look at the distribution of interest rates paid for this type of loan in more detail, focusing on loans of the major banks (Graph 6). On the graph are marked three other interest rate measures. The line on the right is the relevant standard variable rate (SVR). Very few borrowers actually pay the SVR (or a higher interest rate); rather, borrowers are generally offered a discount relative to this reference rate. The discounts offered vary by borrower and lender, and also vary over time.
Graph 6
The second type of interest rate indicated, the middle vertical line in the graph, is the average ‘package’ rate. A typical package mortgage product has additional features beyond the ‘basic’ mortgage (such as an offset account) and may be bundled with other products (such as a credit card). Packages often include advertised discounts. A large share of loans has an interest rate consistent with the average package rate; however, the majority of loans have an interest rate below the average package rate.
The line furthest to the left shows the advertised ‘specials’ rate. Only a small share of loans in the dataset has an interest rate consistent with this lowest advertised rate. This may be because not many borrowers either qualify or seek loans at the advertised specials rate. Another reason is that advertised specials are interest rates on new loans, and new loans have attracted in recent years larger discounts compared with existing loans, as I will discuss later.
For the major banks, the interest rates on most loans are within the range set by the advertised specials rate and the package rate. Preliminary econometric analysis suggests that LVRs and loan size are important determinants of the discount offered to borrowers. Large loans typically have lower interest rates. One factor is that the loan size a borrower qualifies for is correlated with the borrower’s net income, which, in turn, is correlated with a better ability to repay. Also, borrowers seeking larger loans may have more bargaining power to negotiate greater discounts given the fixed costs associated with issuing loans.
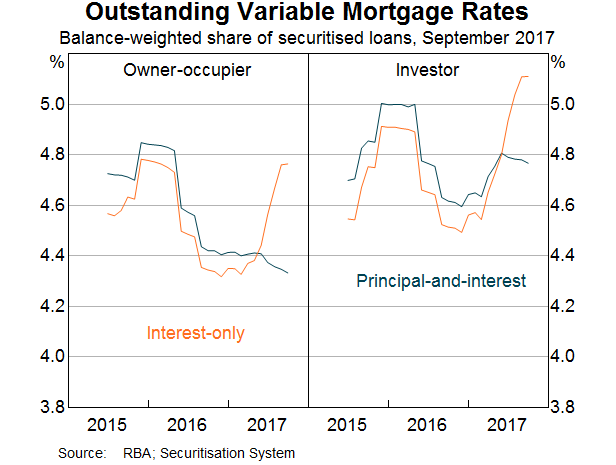
The data shown in the distributions can be aggregated to provide a measure for the average outstanding interest rate on existing loans (Graph 7). (You may have seen similar graphs in some of our recent publications; the data underlying these graphs are from the Securitisation Dataset.) The outstanding interest rates on the four main types of mortgages – owner-occupier or investor, and principal-and-interest or interest-only – have changed over the past years partly in response to regulatory measures. These changes are also evident in the variable interest rate loans in the Securitisation Dataset. In the latter part of 2015, investor loans became more expensive compared with owner-occupier loans. This was in response to regulatory measures designed to limit the pace of growth of investor credit. Over the past year, regulatory measures have focused on limiting new interest-only lending. In response, lenders have increased rates on interest-only loans several times while lowering rates on principal-and-interest loans.
Graph 7
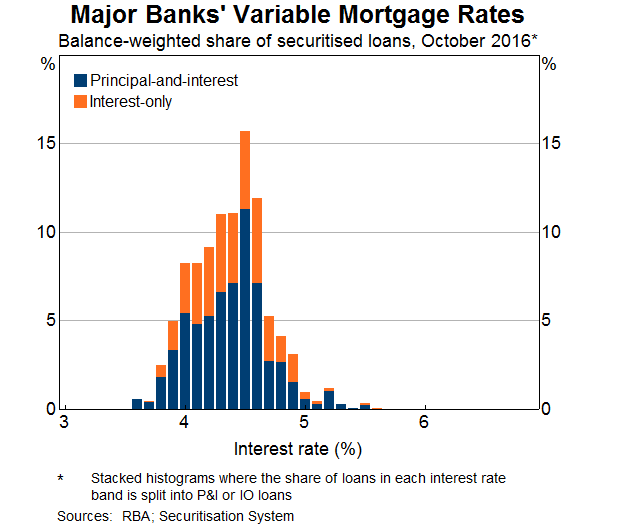
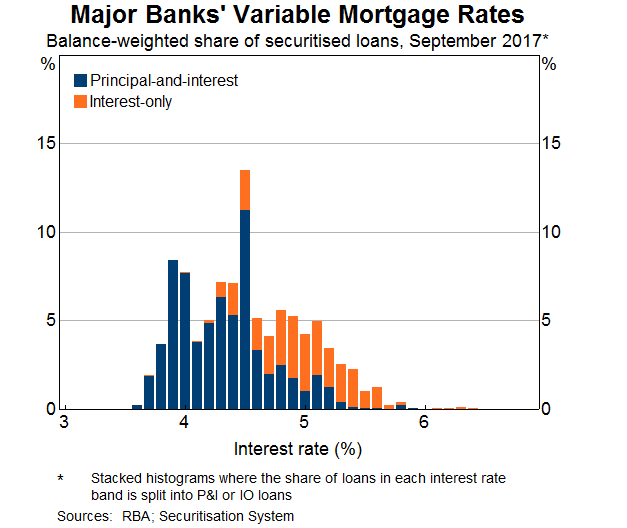
The response of the banks to the regulatory changes can also be measured by examining how the distribution of interest rates has changed. Here you can see a stacked histogram (Graph 8). For each interest rate band on the horizontal axes, it shows the share of loans that have either principal-and-interest (blue bars) or interest-only (orange bars) repayments. You can see the large overlap between the two distributions for interest-only and principal-and-interest loans before the introduction of limits on new interest-only lending. There has since been a marked repricing of loans within those two groups in response to the regulatory measures. You can now see a clear separation between the distributions (Graph 9). Interest rates on interest-only loans have increased and the distribution has shifted towards the right, following the large rate increases for both owner-occupier and investor loans in that category. Mortgages with an interest rate below 4 per cent are now almost exclusively principal-and-interest loans.
Graph 8
Graph 9
The distribution of principal-and-interest loans has also changed following the regulatory measures. There is now a greater proportion of principal-and-interest loans with an interest rate below 4 per cent, due to the lower rates applied to owner-occupier loans, and there has reportedly been increased competition for these types of loans.
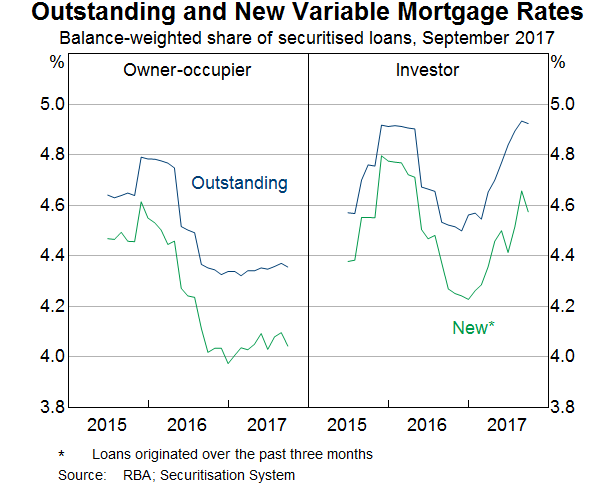
So far, we have looked at interest rates on all outstanding loans. As indicated earlier, another important measure is the interest rate for newer loans. While changes to SVRs, or reference rates, are directly transmitted to all borrowers with variable-rate loans, interest rates offered to new borrowers may move independently of reference rates depending on lenders’ discounting decisions. In this graph I show estimates obtained from the Securitisation Dataset for the interest rate on recently issued mortgages (Graph 10). As you can see, the average interest rate on new loans has been consistently lower than the interest rate on outstanding mortgages over the past few years. Over the past 12 months, the degree of discounting has in fact increased. This has been the case for both owner-occupier and investor loans. The increase in interest rate discounts offered to new borrowers over the past year suggests that competition for customers is stronger for new borrowers than for existing borrowers. The Reserve Bank has noted the apparent difference in competition for new and existing borrowers in its recent submission to the Productivity Commission’s Inquiry into ‘Competition in the Financial System’.
Graph 10
In this second part of my talk, I have highlighted three insights that we have gained from the dataset on mortgage interest rates actually paid by different borrowers and how they vary over time. First, as is the case with the size and LVRs of mortgages, there is a wide distribution of interest rates paid across different types of mortgages and borrowers. Second, in response to recent regulatory measures, these distributions have changed. And third, we have found that advertised and unadvertised discounts to reference rates are commonplace. These discounts have increased in recent years, such that new borrowers often pay lower interest rates than existing borrowers for similar types of mortgages.
Residential mortgages continue to make up most of the transactions and there was a small overall lift, but in the past year the value of mortgages fell 0.9%. So whilst the securitisation conduits are open, and pricing reasonable (if higher than pre-GFC), overall volumes are still well below their 2007 peaks. This is because other forms of funding are available, including direct investment. Most securitisation instruments are sold to Australian investors.
During the March quarter 2017, the increase in total assets was primarily due to an increase in other loans (up $1.9b, 12.0%), residential mortgage assets (up $1.3b, 1.4%) and cash and deposits (up $1.0b, 27.2%).
At 31 March 2017, total liabilities of Australian securitisers were $121.6b, up $4.4b (3.8%) on 31 December 2016. The increase in total liabilities was due to an increase in long term asset backed securities issued in Australia (up $7.6b, 7.8%). This was partially offset by a decrease in short term asset backed debt securities issued in Australia (down $1.9b, 42.0%) and loans and placements (down $0.6b, 6.4%).
At 31 March 2017, asset backed securities issued in Australia as a proportion of total liabilities increased to 88.6%, up 1.5% on the December quarter 2016 proportion of 87.1%. Asset backed securities issued overseas as a proportion of total liabilities decreased to 3.8%, down 0.3% on the December quarter 2016 proportion of 4.1%.
The European Commission (EC) Proposal to Include Securitisation Swaps in Margining Rules Is Credit Negative. The EC proposes to amend the European Markets and Infrastructure Regulation and extend the definition of “financial counterparty” to securitisation issuers.
Consequently, future securitisation swaps involving either an issuer or counterparty in the European Union (EU) will be subject to rules requiring two-way collateral posting (i.e., margining). The proposal is credit negative for existing deals with swaps because margining requirements reduce the likelihood that counterparties could be replaced if their credit strength deteriorated.
The proposal, if implemented, would affect existing deals even though it is unlikely to apply retroactively. After the revised margining requirements begin, replacing a counterparty would require entering into a replacement swap with margining. In practice, an issuer is unlikely to trade with a new counterparty if it is required to exchange margin. Existing transactions are not structured to provide issuers with the necessary liquid funds or operational capability to post collateral. The issue would be that margining could expose bondholders to significant risks, including the diversion of transaction cash flows to margin calls and the risk of swap termination should the issuer default on its collateral posting obligations.
The proposal would increase swap counterparty credit risk in affected securitisations because the credit protection value of swap replacement provisions depends on the ease with which swap counterparties can be replaced. Securitisation swaps commonly incorporate transfer triggers and collateral triggers to protect against counterparty credit risk. A transfer trigger requires a counterparty whose credit strength has deteriorated to transfer the swap to a stronger counterparty. A collateral trigger requires a counterparty whose credit strength has deteriorated to post collateral so that the issuer can pay for a replacement swap in case the counterparty defaults. Both triggers are designed to increase the likelihood of counterparty replacement, but neither is effective when margining requirements deter issuers from entering into swaps with new counterparties.
The proposal’s negative credit effect is not limited to transactions with EU issuers. The EU margin rules would also apply to securitisation swaps between non-EU issuers and EU counterparties. Non-EU issuers without sufficient local replacement counterparties typically seek global counterparties, but would likely only consider counterparties that are not subject to margining under the counterparties’ own local rules. With prospective swap counterparties in the US already affected by margining requirements, the addition of equivalent rules for EU counterparties could materially reduce the likelihood of counterparty replacement for some issuers outside the EU and the US.
The proposal would also potentially subject securitisation swaps to requirements for central clearing. However, because the majority of securitisation swaps are not currently eligible for clearing because of their non-standard terms, we do not expect a central clearing requirement to have a material credit-negative effect in practice. Should securitisation swaps become more widely clearable, the proposal introduces a threshold hedging exposure that would have to be exceeded before margin rules apply.If the proposal is implemented, securitisation swaps for new transactions will also be affected and the new rules could give rise to reduced use of swaps to address hedging risk, or the use of alternative types of derivatives or structural features. If efficient structural solutions are found, they could be used to address credit challenges for future transactions.
In November 2016, APRA released the final revised Prudential Standard APS 120 Securitisation (APS 120) (effective 1 January 2018). APRA also released for consultation a draft revised APG 120.
APRA received two submissions in response to the draft revised APG 120. APRA’s responses to the key matters raised are set out below.
Derivatives transactions
The final revised APS 120 requires ADI swap providers in securitisation schemes to be senior in the cash flow waterfall. The draft revised APG 120 clarifies that this ranking includes where the ADI is a defaulting party under the swap, and for uncollected break costs.
Comments received
Both submissions commented that requiring ADI swap providers to be senior where the ADI is a defaulting party under the swap, and for uncollected break costs, may increase the overall costs of securitisations and reduce the number of swap counterparties that provide swaps to securitisations.
APRA response
APRA has reconsidered this position and has clarified in the final revised APG 120 that swaps may be treated as senior ranking for regulatory capital purposes where the ADI is a defaulting party under the swap, and for uncollected break costs. APRA recognises that default of an ADI swap provider would not necessarily relate to the performance of the underlying exposures. In the case of uncollected break costs, these amounts are at the discretion of the ADI and therefore certainty of cashflow to the securitisation trust, for these amounts, is not assured.
Shared collateral and trust-back agreements
Under the final revised APS 120, trust-back loans (non-securitised loans) are ineligible for risk weights of less than 100 per cent, unless the ADI has a formal second mortgage in regard to the securitised loans used as collateral.
Comments received
Both submissions reiterated that the requirement for an ADI to obtain a formal second mortgage in these circumstances is operationally burdensome and impractical. Both submissions asserted that trust-back agreements are structured to legally operate so as to afford equivalent rights to a formal second mortgage.
APRA response
In light of industry comments, including the operational burden of obtaining formal second mortgages and that shared collateral agreements can be constructed to legally operate so as to afford equivalent rights, APRA has clarified in the final revised APG 120 that, subject to certain conditions, a shared collateral agreement may be considered equivalent to a formal second mortgage for the purposes of APS 120 only.
Warehouse arrangements
The draft revised APG 120 provides some flexibility for originating ADIs to agree a new funding rate to extend a warehouse funding line, provided no other terms and conditions of the securitisation are amended.
Comments received
Both submissions commented that additional flexibility to change the terms and conditions of a warehouse, including credit enhancement and subordination levels and pool parameters, should be permitted for both capital relief and funding-only warehouses.
Both submissions also requested that existing warehouses ineligible for regulatory capital relief should be permitted to be amended prior to 1 January 2018 to minimise increases in regulatory capital requirements under the final revised APS 120. In the absence of this flexibility, the originating ADI may incur substantially higher funding costs.
APRA response
With the exception of self-securitisations, the final revised APS 120 prohibits an ADI from increasing a first loss position or providing a credit enhancement after the inception of a transaction. APRA considers additional flexibility to change the terms and conditions of a warehouse contrary to this requirement.
However, for existing warehouses ineligible for regulatory capital relief, APRA is prepared as a transitional measure to allow ADIs some flexibility to restructure the terms and conditions of these securitisations, provided this occurs by 1 January 2018. APRA supervisors will be in contact with ADIs with respect to any plans to utilise these transitional arrangements.
China may permit more commercial banks to sell bad loan-backed securities in 2017 to help lenders cope with surging sour loans and deepening economic slowdown, according to global ratings agency Fitch Ratings.
Under the government’s regulatory support, China’s nascent structured finance market has seen a strong growth in 2016, with the total issuance of asset-backed securities up 42 per cent year-on-year to 865 billion yuan (HK$975.9 billion), according to recent statistics from Fitch.
Asset-backed securities are bonds or notes backed by financial assets, including loans, leases, company receivables etc. China’s asset-backed securities market was restarted in 2012 after three years of suspension. After a flattish start in 2012 and 2013, it gained strong momentum in 2014 and has expanded at a rapid pace since then.
In 2016, six Chinese commercial banks become pilot banks for issue of asset-backed securities products backed by non-performing loans, with a total quota of 50 billion yuan. These banks include the Industrial and Commercial Bank of China, China Construction Bank, Bank of China, Agricultural Bank of China, Bank of Communications, and China Merchants Bank.
The six pilot banks issued a combined 15.6 billion yuan of non-performing loans’ asset-backed securities products in 2016, according to recent data from China Government Securities Depository Trust & Clearing Company.
“We expect further issuances in 2017,” said Hilary Tan, director of Non-Japan Asia Structured Finance for Fitch Ratings.
Tan said the government is likely to expand approval to more commercial banks to help them deal with rising bad loans.
The bad debt ratio of Chinese banks has risen to 1.81 per cent by the end of 2016, the highest since the second quarter of 2009, according to recent data from the China Banking Regulatory Commission, the China’s banking regulator.
Statistics from Fitch also showed that 53 per cent of the asset-backed securities issuance in 2016 was under the asset-backed specific plan, regulated by the China Securities Regulatory Commission. These asset-backed specific plan products reached 459 billion yuan, representing a 134 per cent year-on-year increase.
About 45 per cent of the total issuance was under the credit asset securitization scheme, governed by the People’s Bank of China and China’s banking regulator. These issued credit asset securitization scheme products reached 391 billion yuan in 2016, slightly down 5 per cent year-on-year.
Fitch said the asset-backed specific plan attracted more corporate issuers due to the diversified underlying asset-classes it issued in the bond exchange market.

 This reflects what we have seen in the market with non-bank and some bank lenders using this funding channel. The rise of non-bank securitisation is a significant element in the structure of the market. As major lenders throttle back their lending standards, more higher risk loans are moving into the non-bank and securitised sectors. Of course a decade ago it was the securitised loans which took lenders down in the US and Europe.
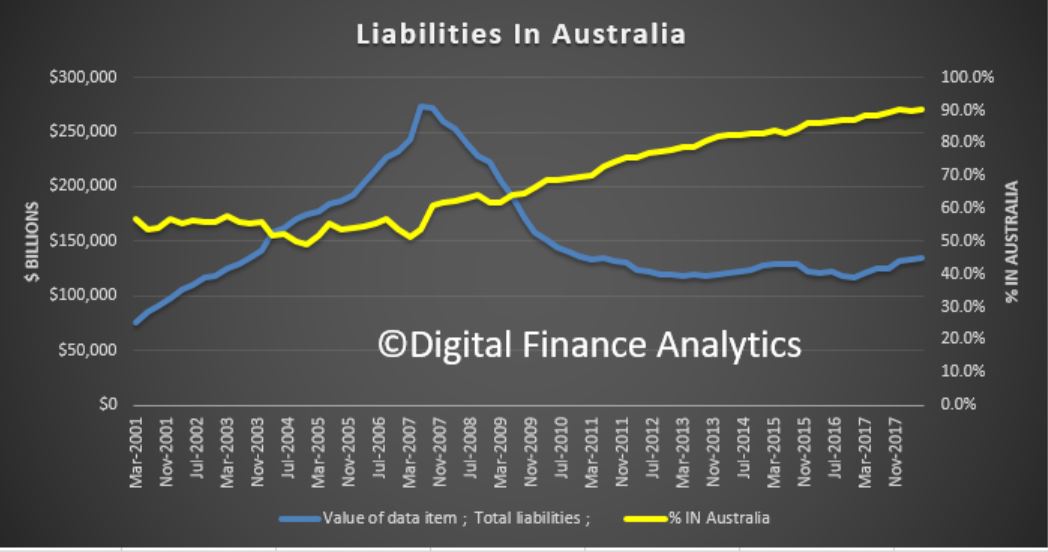 This includes a range of sophisticated investors, including super funds, wealth managers, banks, and high-net worth individuals. But the point to make is that if home price falls continue, the risks in the securitised pools will grow, and this risk is fed back to the investor pools.