We review the latest data from the RBA, and the June results from our household surveys relating to mortgage stress.
See more at:
Digital Finance Analytics (DFA) Blog
"Intelligent Insight"

We review the latest data from the RBA, and the June results from our household surveys relating to mortgage stress.
See more at:
We have released the June 2019 mortgage stress results, based on our running 52,000 household surveys. We found that 32% of households are now dealing with mortgage stress, a record, meaning they are having cash flow issues managing their finances and mortgage repayments.
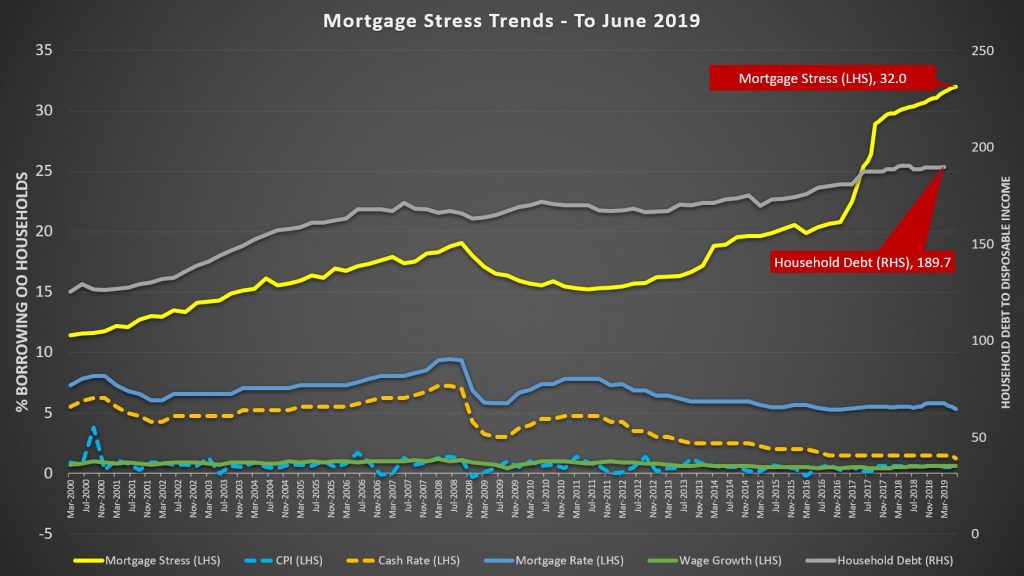
This translates into more than 1,063,000 households spread across the country, and nearly 71,000 risk default in the year ahead, even taking into account the fall in mortgage repayments represented by the recent rate cuts. Banks loses will rise.
This is because the costs of living continue to run ahead of incomes, while households have larger debts (and are being enticed to buy in the current complex risk environment).
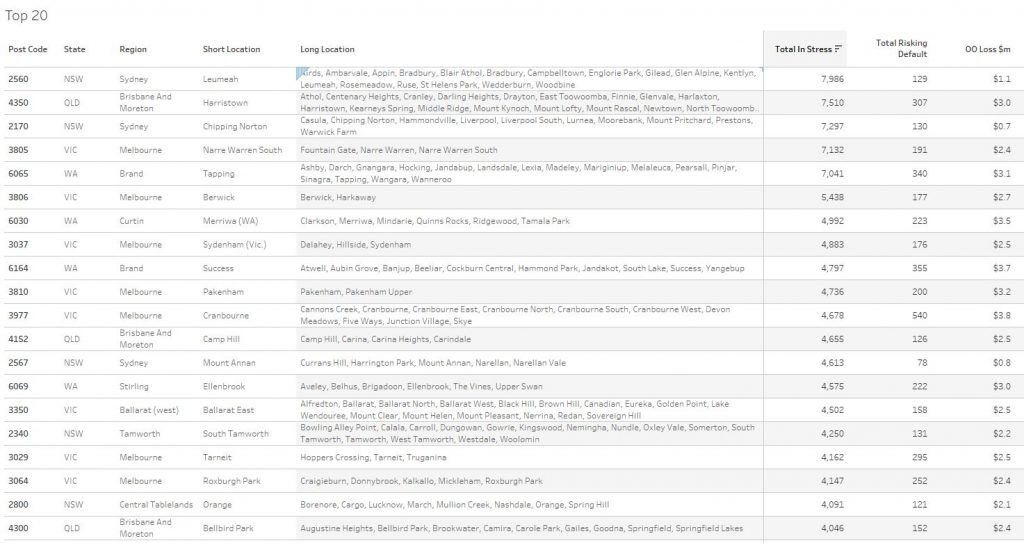
The top post codes in stress are those in the outer suburban fringe areas, where many large estates are still being built, and households are super-highly leveraged.
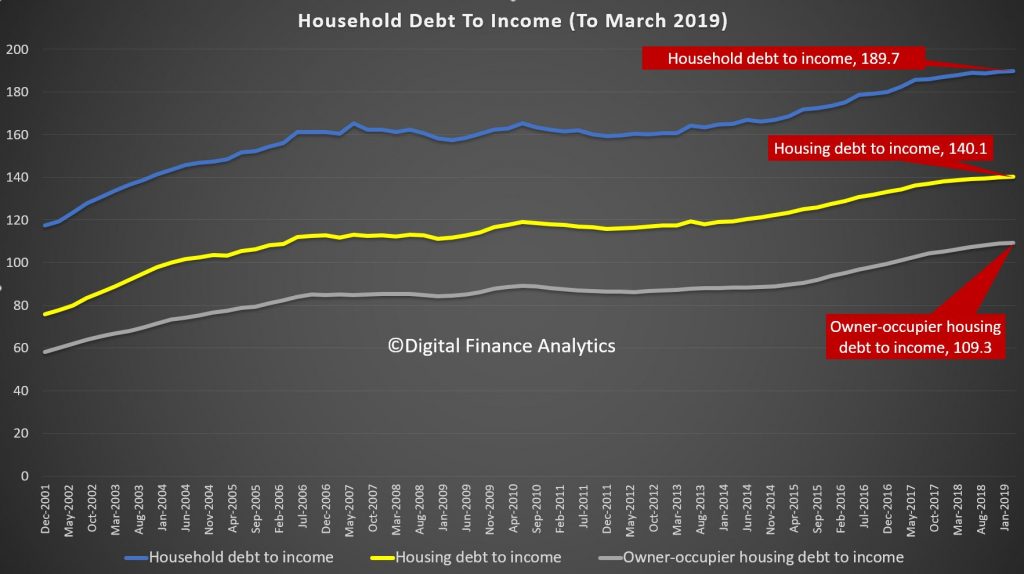
The RBA released their March 2019 data on household ratios. Whilst these series include small business finance, and include households not borrowing, the trends continue to tell the story of debt, and more debt.
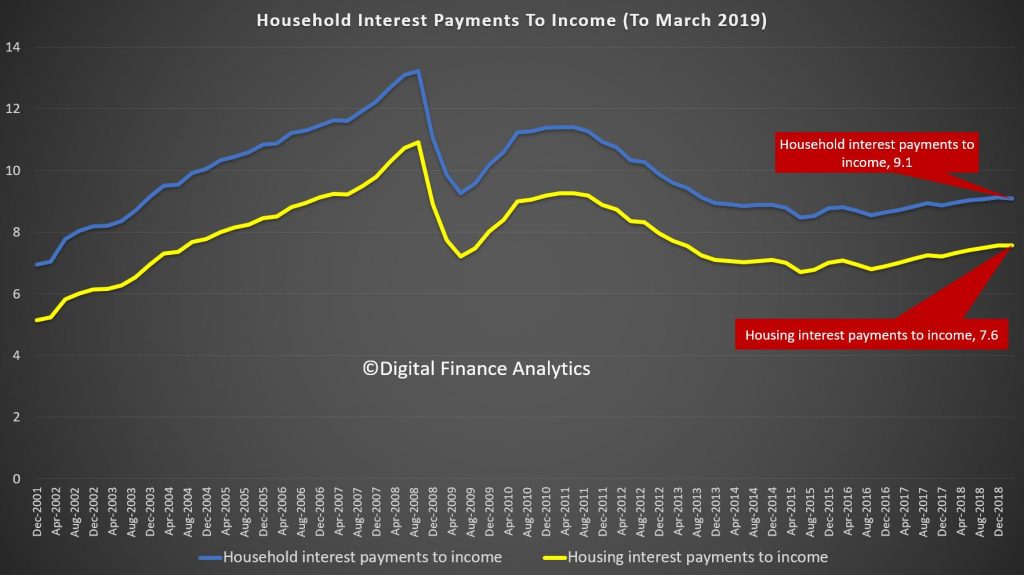
The household debt to income ratio is at a record 189.7, while the housing debt to income ratio was 140.1, again a record and the owner occupied housing debt to income ratio was also up, to 109.3. These are high numbers, on a trend and international comparable basis. Households are drowning in debt.
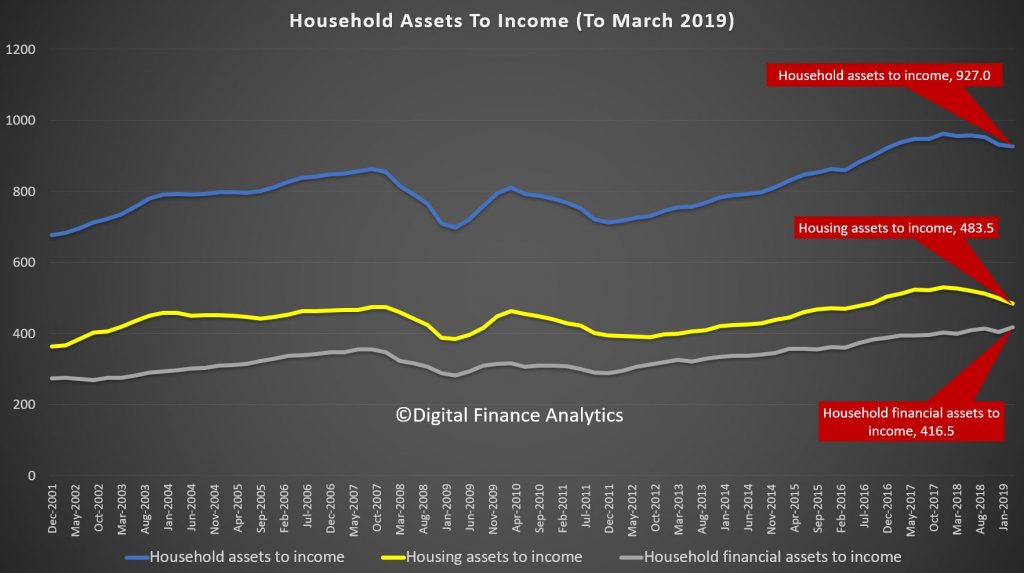
However the asset to income ratios tell another story. As home prices have fallen, so the ratio has decreased, assets are down relative to income. The exception are financial assets, which benefited from the rise in stock prices this year.
The ratio of interest to income continues to rise because households are borrowing at a faster rate than their incomes are growing, helped of course by lower interest rates. This ratio is below that before the GFC because rates have dropped. And this is the one ratio spruikers turn to to defend the high debt levels – but it is myopic, and going in the wrong direction.
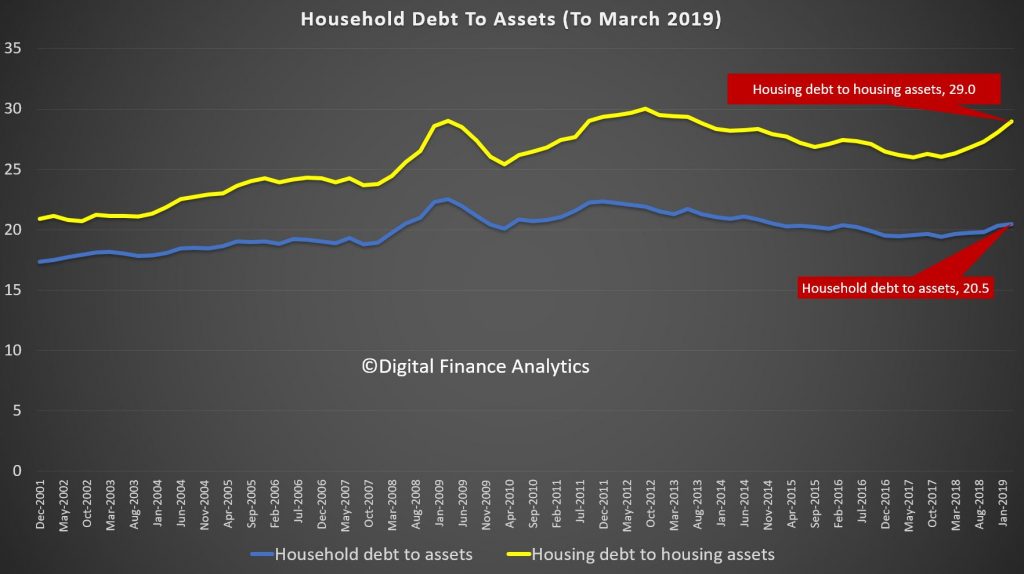
Finally, the RBA data debt to assets shows the pincer movement as home prices fall, and debt rises. This is now heading towards the highest we have seen.
The obvious conclusion is that the debt burden is too great, mortgage stress will go on rising, until the balance between debt and income is restored.
The recent loosening of lending standards simply pours more fuel on the fire. Households are being used a canon fodder in the vein attempt to keep the faltering economy afloat.
At the time of writing, cuts of 25bps had been announced by Resimac, State Custodians and Athena Home Loans. Reduce Home Loans cut its rates by 22bps, taking its lowest advertised rate to 2.89% and putting the lender in the sub 3% category with Greater Bank, HomeStar Finance and BOQ.

Unlike last month’s cut, all the majors responded to the RBA’s announcement before the day’s end.
As with last month, ANZ was the first to react, announcing a full 25bps decrease across all variable interest rates for Australian home and residential investment loans.
In June, ANZ elected to pass through just 18bps of the RBA’s 25bps cut, defying Treasurer Josh Frydenberg’s public demand for a full transference of the reduction.
CBA was next to go public, opting for a 0.19% reduction across both its owner occupied and investor P&I standard variable rate home loans.
The interest only home loans, both owner occupied and investment, received the full 25bps cut.
Last month, CBA passed through the 0.25% cut in full.
The bank also announced a special five-month term deposit rate for savers, introduced at 2.20% per year, which is a 0.20% increase.
“With official interest rate settings already at record lows, we are focused on balancing the benefits and the costs of further interest rate reductions between our 1.6 million home loan and over 6 million savings customers,” said Angus Sullivan, group executive of retail banking services.
“It is not possible to pass on the full rate reduction to over $160 billion of our deposits, including deposits where interest rates are at or already near zero,” he added.
In June, NAB also passed through the full 25bps. However, this month they elected to reduce variable home loan interest rates by 19bps, but also provided more commentary along with the decision than the other majors.
“Decisions like these are difficult and reflect the current unique circumstances, with home loan rates at record lows at the same time as deposit and savings rates also being at record lows,” said chief customer officer of consumer banking, Mike Baird.
“The difference between what we charge and how much it costs us to fund a mortgage remains under pressure and while the circumstances of each RBA cash rate decision will vary and has some influence on the cost of borrowing money, it is not the only funding cost driver for NAB.”
“Getting the balance right is an ongoing challenge for banks and, with 9 million customers, making the right decisions for our customers matters for the Australian economy,” he explained.
Westpac rounded out the responses yesterday evening, announcing a reduction of 20bps for variable rates including owner occupier paying P&I, investment p&I, and owner occupier for interest only customers.
The rate was reduced by 0.30% for residential investment property loans for customers for customers with interest only repayments.
In June, Westpac reduced rates for owner occupiers paying P&I by just 0.20%, and rates for investor customers with interest only payments by 0.35%
Courtesy of Philip Lowe, speaking in Darwin tonight. Savers do not even warrant a mention… more the shame!
As I am sure you are aware, this morning the Board decided to reduce the cash rate by a quarter of a percentage point to 1 per cent. This follows a similar adjustment last month. This easing of monetary policy will support jobs growth across the country and provide greater confidence that inflation will be consistent with the medium-term target of 2 to 3 per cent.

Our assessment is that despite the Australian economy having performed reasonably well over recent years, there is still a fair degree of spare capacity in the economy. It is both possible and desirable to reduce that spare capacity. We should be able to achieve a lower rate of unemployment than we currently have and we should also be able to reduce underemployment. If, as a country, we can do this, we could expect a further lift in wages growth and stronger growth in household incomes. These would be good outcomes. As I hope you are aware, the Reserve Bank’s monetary policy framework is centred on the inflation target, but the ultimate objective of our policies is to promote the collective economic prosperity of the people of Australia.
In the Board’s judgement, the easing of monetary policy last month and this month will help promote our collective welfare. At the same time, though, we recognise that the benefits are not evenly distributed across the community and that there are some downsides to monetary easing. Partly for these reasons, over recent times I have been drawing attention to the fact that, as a nation, there are options other than monetary easing for putting us on a better path.
One option is fiscal support, including through spending on infrastructure. This spending adds to demand in the economy and – provided the right projects are selected – it also adds to the country’s productive capacity. It is appropriate to be thinking about further investments in this area, especially with interest rates at a record low, the economy having spare capacity and some of our existing infrastructure struggling to cope with ongoing population growth.
Another option is structural policies that support firms expanding, investing, innovating and employing people. A strong, dynamic, competitive business sector generates jobs. It can help deliver the productivity growth that is the main source of sustainable increases in our wages and incomes. So, as a country, we need to keep focused on this.
To repeat the point, it is important that we think about the task ahead holistically. Monetary policy does have a significant role to play and our decisions are helping support the Australian economy. But, we should not rely on monetary policy alone. We will achieve better outcomes for society as a whole if the various arms of public policy are all pointing in the same direction.
The two cuts in interest rates the Board has delivered recently will make an important contribution to putting us on a better path and winding back spare capacity. It is also worth drawing your attention to a few other developments.
First, borrowing costs for almost all borrowers are now the lowest they have ever been. As an illustration, the Australian Government can borrow for 10 years at around 1.3 per cent, the lowest rate it has faced since Federation in 1901. It is also able to borrow for 30 years at an interest rate of less than 2 per cent. Private businesses and households also face low borrowing rates. This is not only because official interest rates are low, but because credit spreads are low too.
Second, Australia’s terms of trade have risen again, largely due to higher iron ore prices. Investment in the resources sector is also expected to increase over the next few years, after having declined steadily for almost seven years. To be clear, we are not expecting another major mining boom, but we are expecting a solid upswing in the resources sector, which will help the overall economy. I hope that, in time, the effects of this upswing will be felt here in the Northern Territory too.
Third, the exchange rate has depreciated over the past couple of years and, on a trade-weighted basis, is at the bottom end of its range of recent times. This is helping support important parts of the economy.
And fourth, we are expecting stronger growth in household disposable income over the next couple of years, partly due to the expected implementation of the low and middle income tax offset. Stronger growth in incomes should support household spending.
Together, these various developments will help the Australian economy.
At the same time, though, we need to watch global developments very closely. Over recent times, the uncertainty generated by the trade and technology disputes between the United States and China has made businesses in many countries nervous about investing. Many are preferring to sit on their hands, rather than commit to capital spending that is difficult and costly to reverse. The result is less international trade and a weakening trend in investment globally. If this continues for too much longer, the effects on economic growth are likely to be significant. For this reason, the risks to the global economy remain tilted to the downside.
The combination of these persistent downside risks and continuing low rates of inflation has led investors around the world to expect interest rate reductions by all the world’s major central banks. In Europe and Japan, official interest rates are already negative but investors are expecting the central banks to go further into negative territory. And in the United States, investors are expecting a substantial reduction in interest rates over the period ahead. This is quite a different world from the one we were facing earlier in the year.
What all this means for us here in Australia is yet to be determined.
We need to remember that the central scenario for both the global and Australian economies is still for reasonable growth, low unemployment and low and stable inflation. As I discussed a few moments ago, there are a number of developments that are providing support to the Australian economy. So we will be closely monitoring how things evolve over coming months. Given the circumstances, the Board is prepared to adjust interest rates again if needed to get us closer to full employment and achieve the inflation target in a way that supports the collective welfare of all Australians, including those who call the Northern Territory home
We discuss monetary policy in the light of today’s rate cut.
We discuss monetary policy in the light of today’s rate cut.
 Blog")
The RBA has released their statement today.

At its meeting today, the Board decided to lower the cash rate by 25 basis points to 1.00 per cent. This follows a similar reduction at the Board’s June meeting. This easing of monetary policy will support employment growth and provide greater confidence that inflation will be consistent with the medium-term target.
The outlook for the global economy remains reasonable. However, the uncertainty generated by the trade and technology disputes is affecting investment and means that the risks to the global economy are tilted to the downside. In most advanced economies, inflation remains subdued, unemployment rates are low and wages growth has picked up. The slowdown in global trade has contributed to slower growth in Asia. In China, the authorities have taken steps to support the economy, while continuing to address risks in the financial system.
Global financial conditions remain accommodative. The persistent downside risks to the global economy combined with subdued inflation have led to expectations of easing of monetary policy by the major central banks. Long-term government bond yields have declined further and are at record lows in a number of countries, including Australia. Bank funding costs in Australia have also declined, with money-market spreads having fully reversed the increases that took place last year. Borrowing rates for both businesses and households are at historically low levels. The Australian dollar is at the low end of its narrow range of recent times.
Over the year to the March quarter, the Australian economy grew at a below-trend 1.8 per cent. Consumption growth has been subdued, weighed down by a protracted period of low income growth and declining housing prices. Increased investment in infrastructure is providing an offset and a pick-up in activity in the resources sector is expected, partly in response to an increase in the prices of Australia’s exports. The central scenario for the Australian economy remains reasonable, with growth around trend expected. The main domestic uncertainty continues to be the outlook for consumption, although a pick-up in growth in household disposable income is expected to support spending.
Employment growth has continued to be strong. Labour force participation is at a record level, the vacancy rate remains high and there are reports of skills shortages in some areas. There has, however, been little inroad into the spare capacity in the labour market recently, with the unemployment rate having risen slightly to 5.2 per cent. The strong employment growth over the past year or so has led to a pick-up in wages growth in the private sector, although overall wages growth remains low. A further gradual lift in wages growth is still expected and this would be a welcome development. Taken together, these labour market outcomes suggest that the Australian economy can sustain lower rates of unemployment and underemployment.
Inflation pressures remain subdued across much of the economy. Inflation is still, however, anticipated to pick up, and will be boosted in the June quarter by increases in petrol prices. The central scenario remains for underlying inflation to be around 2 per cent in 2020 and a little higher after that.
Conditions in most housing markets remain soft, although there are some tentative signs that prices are now stabilising in Sydney and Melbourne. Growth in housing credit has also stabilised recently. Demand for credit by investors continues to be subdued and credit conditions, especially for small and medium-sized businesses, remain tight. Mortgage rates are at record lows and there is strong competition for borrowers of high credit quality.
Today’s decision to lower the cash rate will help make further inroads into the spare capacity in the economy. It will assist with faster progress in reducing unemployment and achieve more assured progress towards the inflation target. The Board will continue to monitor developments in the labour market closely and adjust monetary policy if needed to support sustainable growth in the economy and the achievement of the inflation target over time.
We look at the latest lending statistics from both RBA and APRA. Not much evidence of a rebound so far!
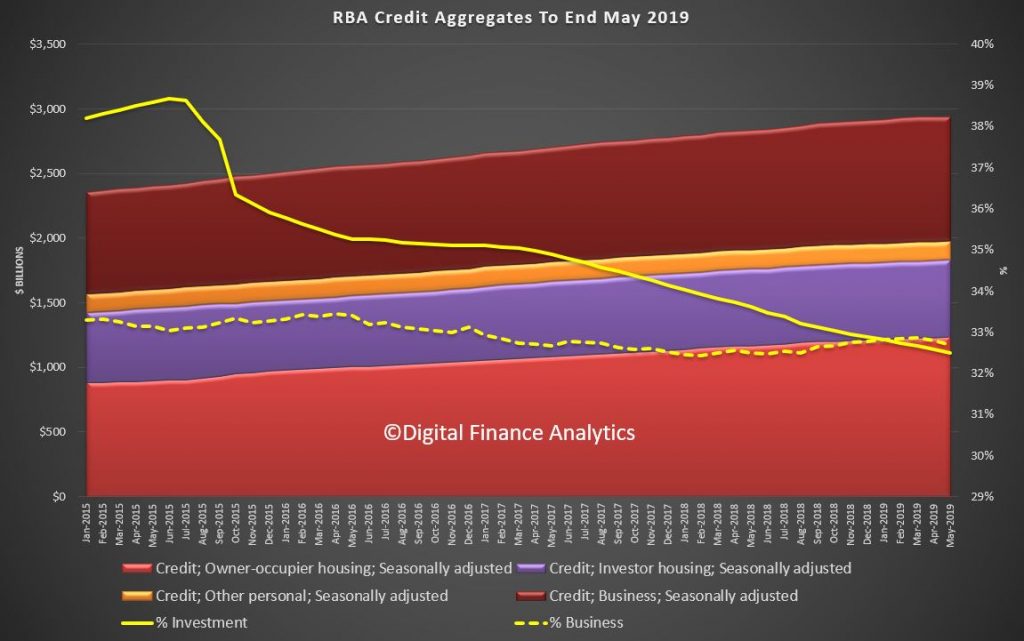
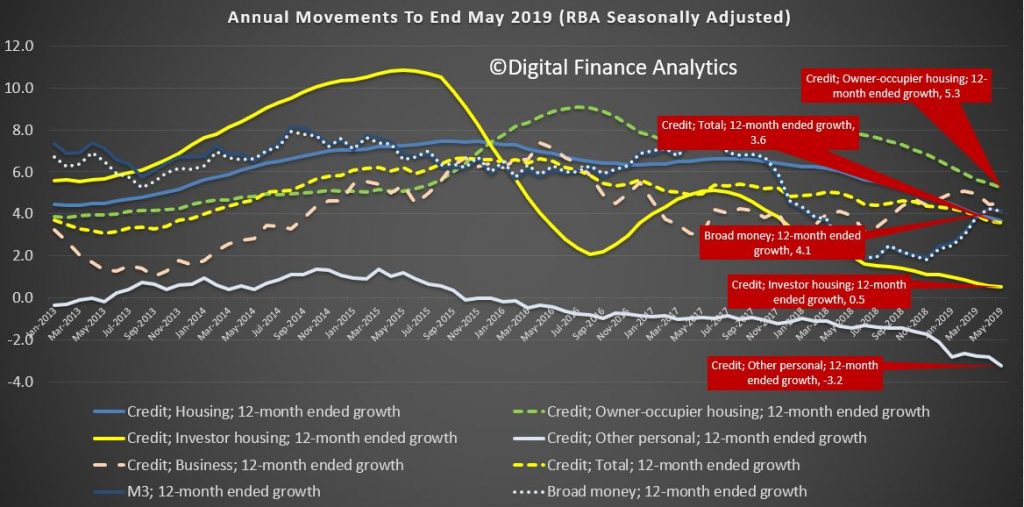
The RBA released their credit aggregates to May 2019 today, we already covered the APRA ADI series in an earlier post.
Seasonally adjusted owner occupied housing rose by 0.34% to $1.24 trillion dollars while investment lending slid 0.04% to $595 billion dollars, and comprises 32.5% of all household finance, in seasonally adjusted terms. Business lending was down 0.35% to $959.6 billion dollars and was 32.7% of credit, the lowest for the past six months. Personal credit fell again, down 0.59% to $145.8 billion dollars.
The monthly movements were quite volatile once again.
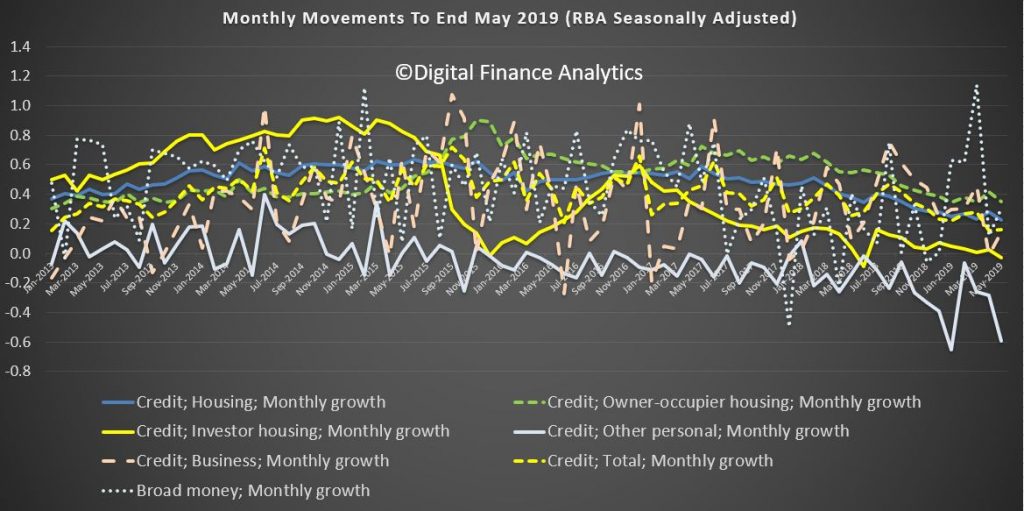
However the annual movements paint a clearer picture. Over the past year owner occupied lending rose 5.3%, investor lending rose just 0.5% while personal credit fell 3.2%. Business lending grew 4.5%. Broad money grew 4.1%, the earlier acceleration in the first past of the year has not been explained.
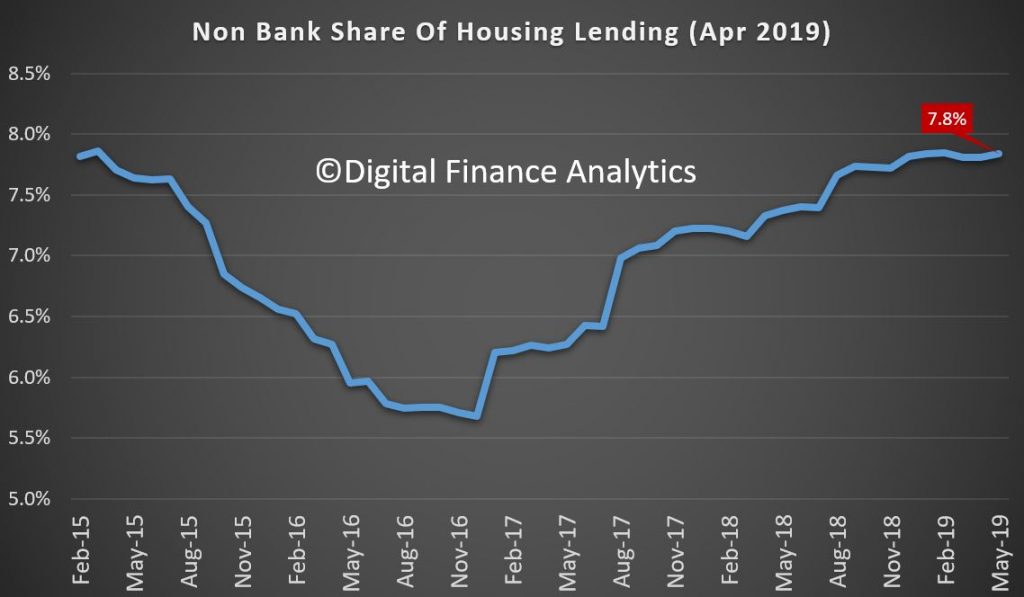
We can proxy the growth in the non bank sector by comparing the APRA and RBA dataset. Whilst only approximate, it does give a fair indication. Non-bank lending recorded an estimated 7.8% rise over the year, significantly higher than the ADI’s.
Overall growth in the non-bank, non-ADI sector for mortgages was an impressive 7.8% annualised.
Further analysis by category shows that owner occupied lending by non-banks rose 10.7% over the past year, while investment loans rose 5.8%. Both are higher than the ADI’s, suggesting the non-bank sector is able and willing to lend.
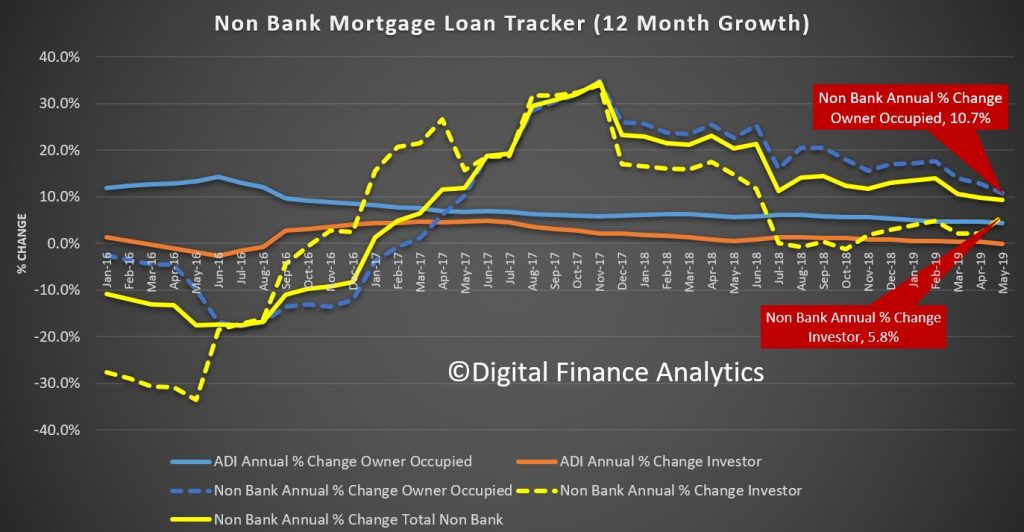
Total household credit growth remain above both inflation and wages, so households are getting mired further into debt, the sustainability of which we question. And again, we think regulators are not looking at the non-bank sector sufficiently hard.
Next month we will see the post-election post-rate cut situation. Many are expecting credit to rebound, and home prices to follow – we will see.
It is also worth noting the RBA will be changing the reporting on the credit aggregates ahead. You can read about their plans. But essentially it will provide more granularity, and make some “significant” revisions to past results. The RBA plans to start publishing the financial aggregates from August 2019 using an improved conceptual framework and a new data collection.
The New Economic and Financial Statistics Collection
Over the past few years, APRA, the ABS and the RBA have worked to modernise the existing set of forms, and banks and other reporting institutions have adapted their infrastructure to be able to report on the new versions of these forms. This has been a large scale and complex project, involving considerable collaboration between the three agencies and the industry. The new set of forms are called the Economic and Financial Statistics (EFS) collection and will better meet the data needs of policymakers.
The EFS collection will be implemented in three phases.
The first phase will focus on data used for the financial aggregates and national accounts finance and wealth estimates.
The second phase will update current forms on housing and business loan approvals. It will also provide much more granular information on banks’ and other reporting institutions’ lending, their liabilities and interest rates.
The third phase will provide information on other aspects of reporting institutions’ activity and performance, including profits, fees charged and activity in specific financial products and markets. The first phase national accounts aggregates will be used in addition to this performance data in the compilation of Australia’s Gross Domestic Product (GDP).
The EFS collection will increase the reliability and accuracy of the inputs used to calculate the aggregates. One of the most important changes in the EFS is more detailed and precise definitions of the data to be reported. These definitions are accompanied by comprehensive guidance to assist institutions in reporting consistent data.
In the June RBA Bulletin, there was an article which describes how the RBA executes its market interventions to effect a cash rate change. It is important to understand these inner workings, despite it appearing complicated on first blush.
And consider this, this tool box is being used by many central banks around the world to direct the financial system.
In summary, the RBA’s operations in domestic markets support the implementation of monetary policy. The most important tool to guide the cash rate to the target set by the Board is the interest rate corridor. To support this, the RBA pursues daily open market operations in order to keep the pool of exchange settlement (ES) balances at the appropriate level for the cash market to function smoothly. The daily market operations are conducted to offset the effects on liquidity of the many transactions between the banking system and the Australian Government. Open market operations are primarily conducted through repos and FX swaps. These provide flexibility for liquidity management and also help to manage risk for the RBA’s balance sheet.
The cash rate is a key determinant of interest rates in domestic financial markets and hence underpins the structure of the interest rates that influence economic activity and financial conditions more generally.
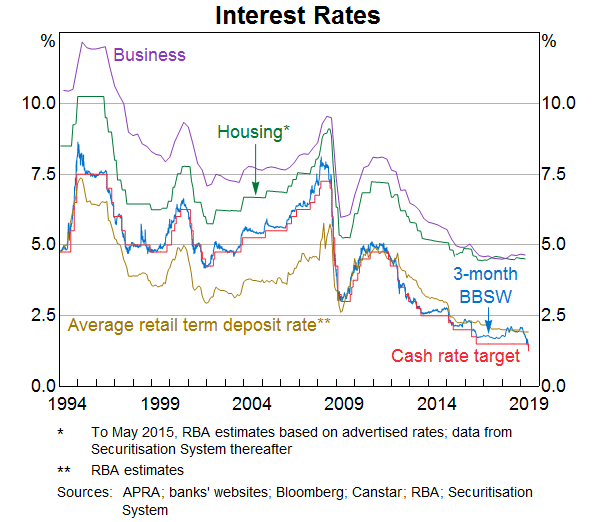
This helps to explain the sharp falls in the BBSW rates, which are now around 87 basis points lower than the recent peak. Such a fall has been engineered.
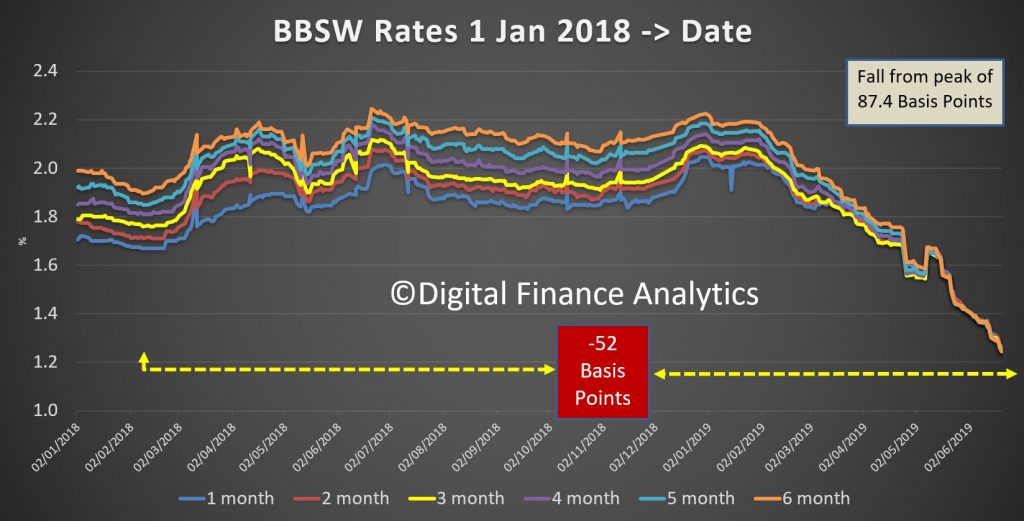
The cash rate is an effective instrument for implementing monetary policy because it affects the broader interest rate structure in the domestic financial system. The cash rate is an important determinant of short-term money market rates, such as the bank bill swap rate (BBSW), and retail deposit rates (Graph 1). These rates – as well as a number of other factors – then influence the funding costs of financial institutions and the lending rates faced by households and businesses. As a result, the cash rate influences economic activity and inflation, enabling the RBA to achieve its monetary policy objectives. However, while changes in the cash rate are very important, they are not the only determinant of market-based interest rates. Other factors, such as expectations, conditions in financial markets, changes in competition and risks associated with different types of loans are also important.
The RBA implements monetary policy by setting a target for the cash rate. This is the interest rate at which banks lend to each other on an overnight unsecured basis, using the exchange settlement (ES) balances they hold with the RBA. ES balances are at-call deposits with the RBA that banks use to settle their payment obligations with other banks. Banks are required to have a positive (or zero) ES balance at all times, including at the end of each day. It is difficult for institutions to predict whether they will have adequate funds at the end of any particular day, which generates the need for an interbank overnight cash market. Those banks that need additional ES balances after they have settled all payment obligations of their customers, borrow from banks with surplus ES balances. The interbank cash market is the mechanism through which these balances are redistributed between participants.
The RBA sets the supply of ES balances to ensure that the cash market functions smoothly by providing an appropriate level of ES balances to facilitate the settlement of interbank payments. The RBA manages the supply of ES balances available to the financial system through its open market operations (see below). Excessive ES balances could lead institutions to lend below the target cash rate, while a shortage might result in the cash rate being bid up above the target.
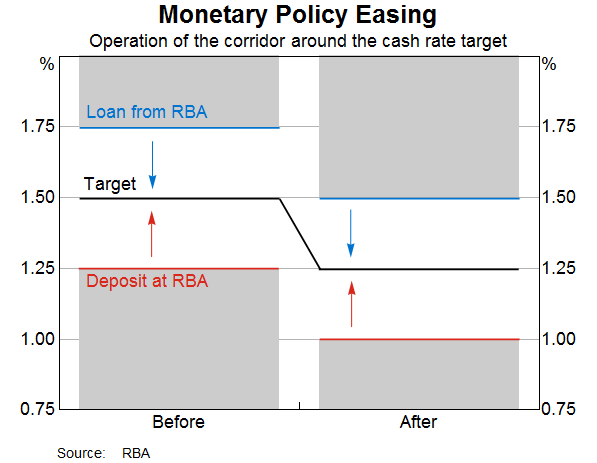
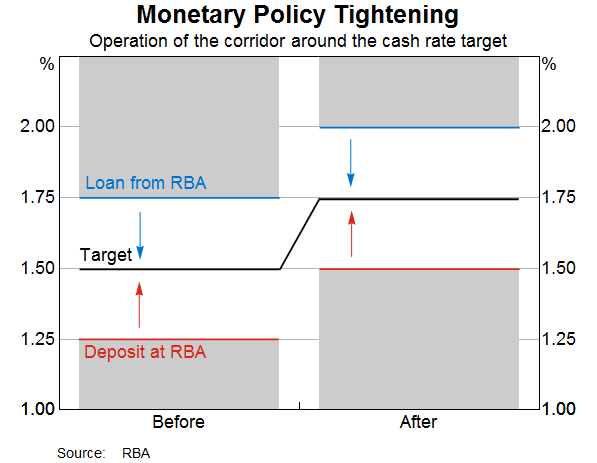
The interest rate corridor ensures that banks have no incentive to deviate significantly from the cash rate target when borrowing or lending in the cash market. Banks can borrow ES balances overnight on a secured basis from the RBA at a margin set 25 basis points above the cash rate target. As a result, banks have no need to borrow from other banks at a higher rate. Similarly, banks receive interest on their surplus ES balances at 25 basis points below the cash rate target. Therefore, they have no incentive to lend to other banks at a lower rate.
The operation of the interest rate corridor means that there is no need for the RBA to adjust the supply of ES balances to bring about a change in the cash rate (Graph 2 and Graph 3). For example, when the RBA lowered the cash rate target by 25 basis points from 1.5 per cent to 1.25 per cent in early June, the rates associated with the corridor also moved lower, to be 1.0 per cent on overnight deposits and 1.5 per cent on overnight loans (down from 1.25 per cent and 1.75 per cent). A bank that would have previously required a return above 1.25 per cent to lend ES balances in the cash market is, under the new corridor, willing to lend at a lower return. And so a bank wanting to borrow cash pays a lower rate than before. Similarly, if the RBA had instead raised the cash rate by 25 basis points from 1.5 per cent, the corridor would have moved up, to be 1.5 per cent to 2.0 per cent. A bank that would have previously lent surplus ES funds to another in the cash market at 1.50 per cent would, under the new corridor, no longer have an incentive to do so. Indeed, it would require a higher return to lend ES balances, rather than leaving those funds in its ES account and receiving 1.50 per cent from the RBA. Hence, a bank wanting to borrow in the cash market would have to pay a higher interest rate than it did previously.
In other words, interbank transactions automatically occur within the interest rate corridor without the RBA needing to undertake transactions beyond its usual market operations to manage liquidity.
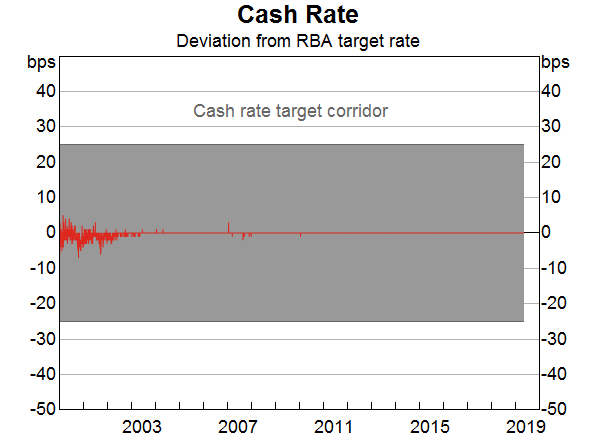
The incentives underlying the corridor guide the cash rate to the target and ordinarily all transactions occur at the rate announced by the RBA. The last time there was a small deviation in the published cash rate (which is a weighted average of all transactions in the cash market) from the target (of 1 basis point for two days) was in January 2010 (Graph 4). The lack of deviation of the cash rate from the target has brought about a self-reinforcing market convention where both borrowers and lenders in the cash market expect to transact at the prevailing target rate. This market convention helps to address the uncertainty that banks would otherwise face about the price at which they can borrow sufficient ES balances to cover their payment obligations each day. In 2018, daily transactions in the overnight interbank market were typically between $3 billion and $6 billion.
As in Australia, many other central banks implement monetary policy with an interest rate corridor to guide the policy rate. The width of the corridor tends to differ, typically from 50 to 200 basis points. The choice of the width of the corridor is seen as a reflection of a trade‐off between interest rate control and the desire to avoid the central bank becoming an intermediary in the money market. All other things being equal, cross-country studies suggest that a narrower corridor is preferred by central banks that have a strong preference for low volatility of short-term interest rates, whereas a wider corridor is usually preferred by central banks that seek to encourage more interbank trading activity.
Over the past 10 years, many central banks (other than the RBA) have significantly expanded their balance sheets. This has resulted in significantly more liquidity in their respective systems and so banks typically do not need to borrow funds in the overnight cash market. In these cases, the policy rate typically converges toward the rate on deposits paid by the central bank; this is often referred to as a ‘floor system’. Small changes in liquidity in such a system do not tend to have much effect on the policy rate.
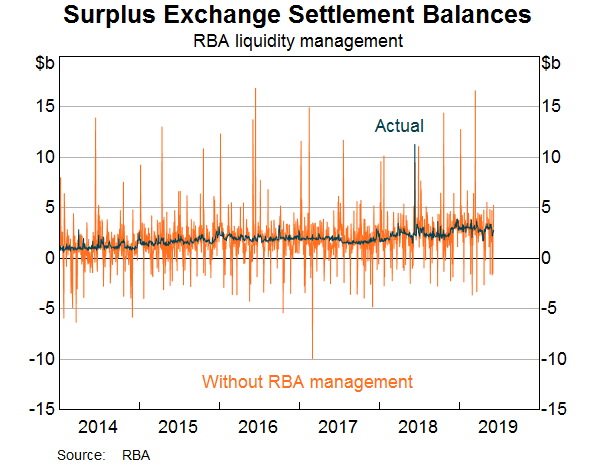
Transactions between the government (which banks with the RBA) and the commercial banks would, by themselves, change the supply of ES balances on a daily basis. ES balances in accounts of commercial banks increase whenever the government spends out of its accounts at the RBA. Similarly, when the government receives cash into its accounts at the RBA, such as from tax payments or debt issuance, ES balances decline. The RBA monitors and forecasts these changes actively through the day. It offsets (i.e. ‘sterilises’) these changes in ES balances with its daily open market operations so that government receipts and payments do not affect the aggregate level of ES balances. If transactions that affect system liquidity were not offset by the RBA, ES balances would be much more volatile and the payments system would suffer frequent disruptions (Graph 5). Ultimately this is likely to lead to a more volatile cash rate.
The main tools used in open market operations are repurchase (repo) agreements and foreign exchange swaps. Both repos and foreign exchange swaps involve a first and a second leg (Figures 1 and 2):
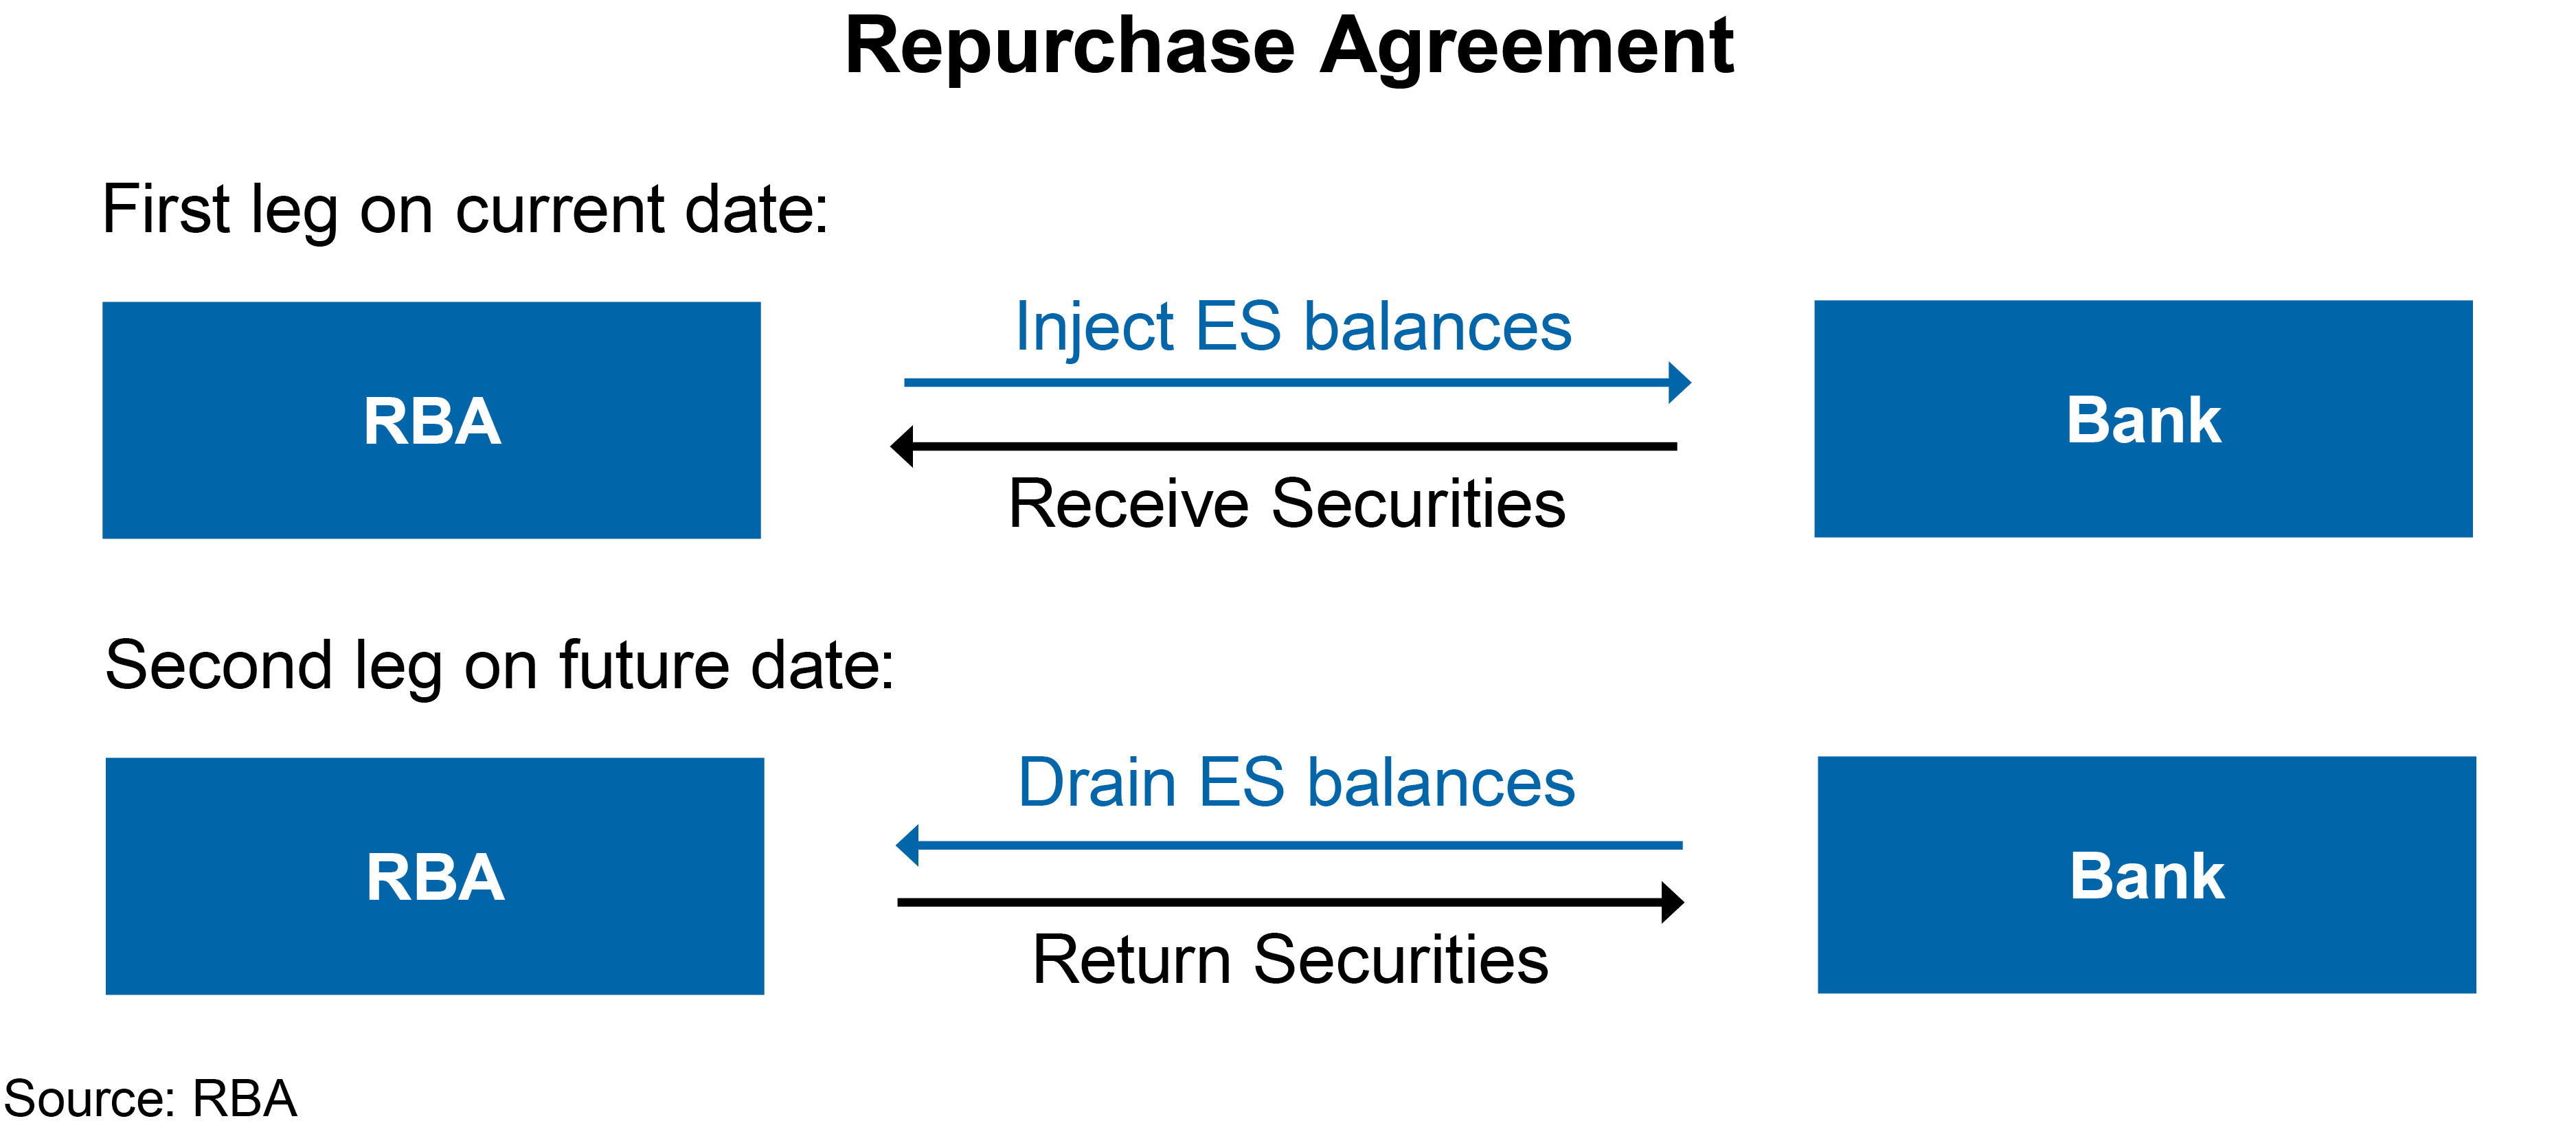
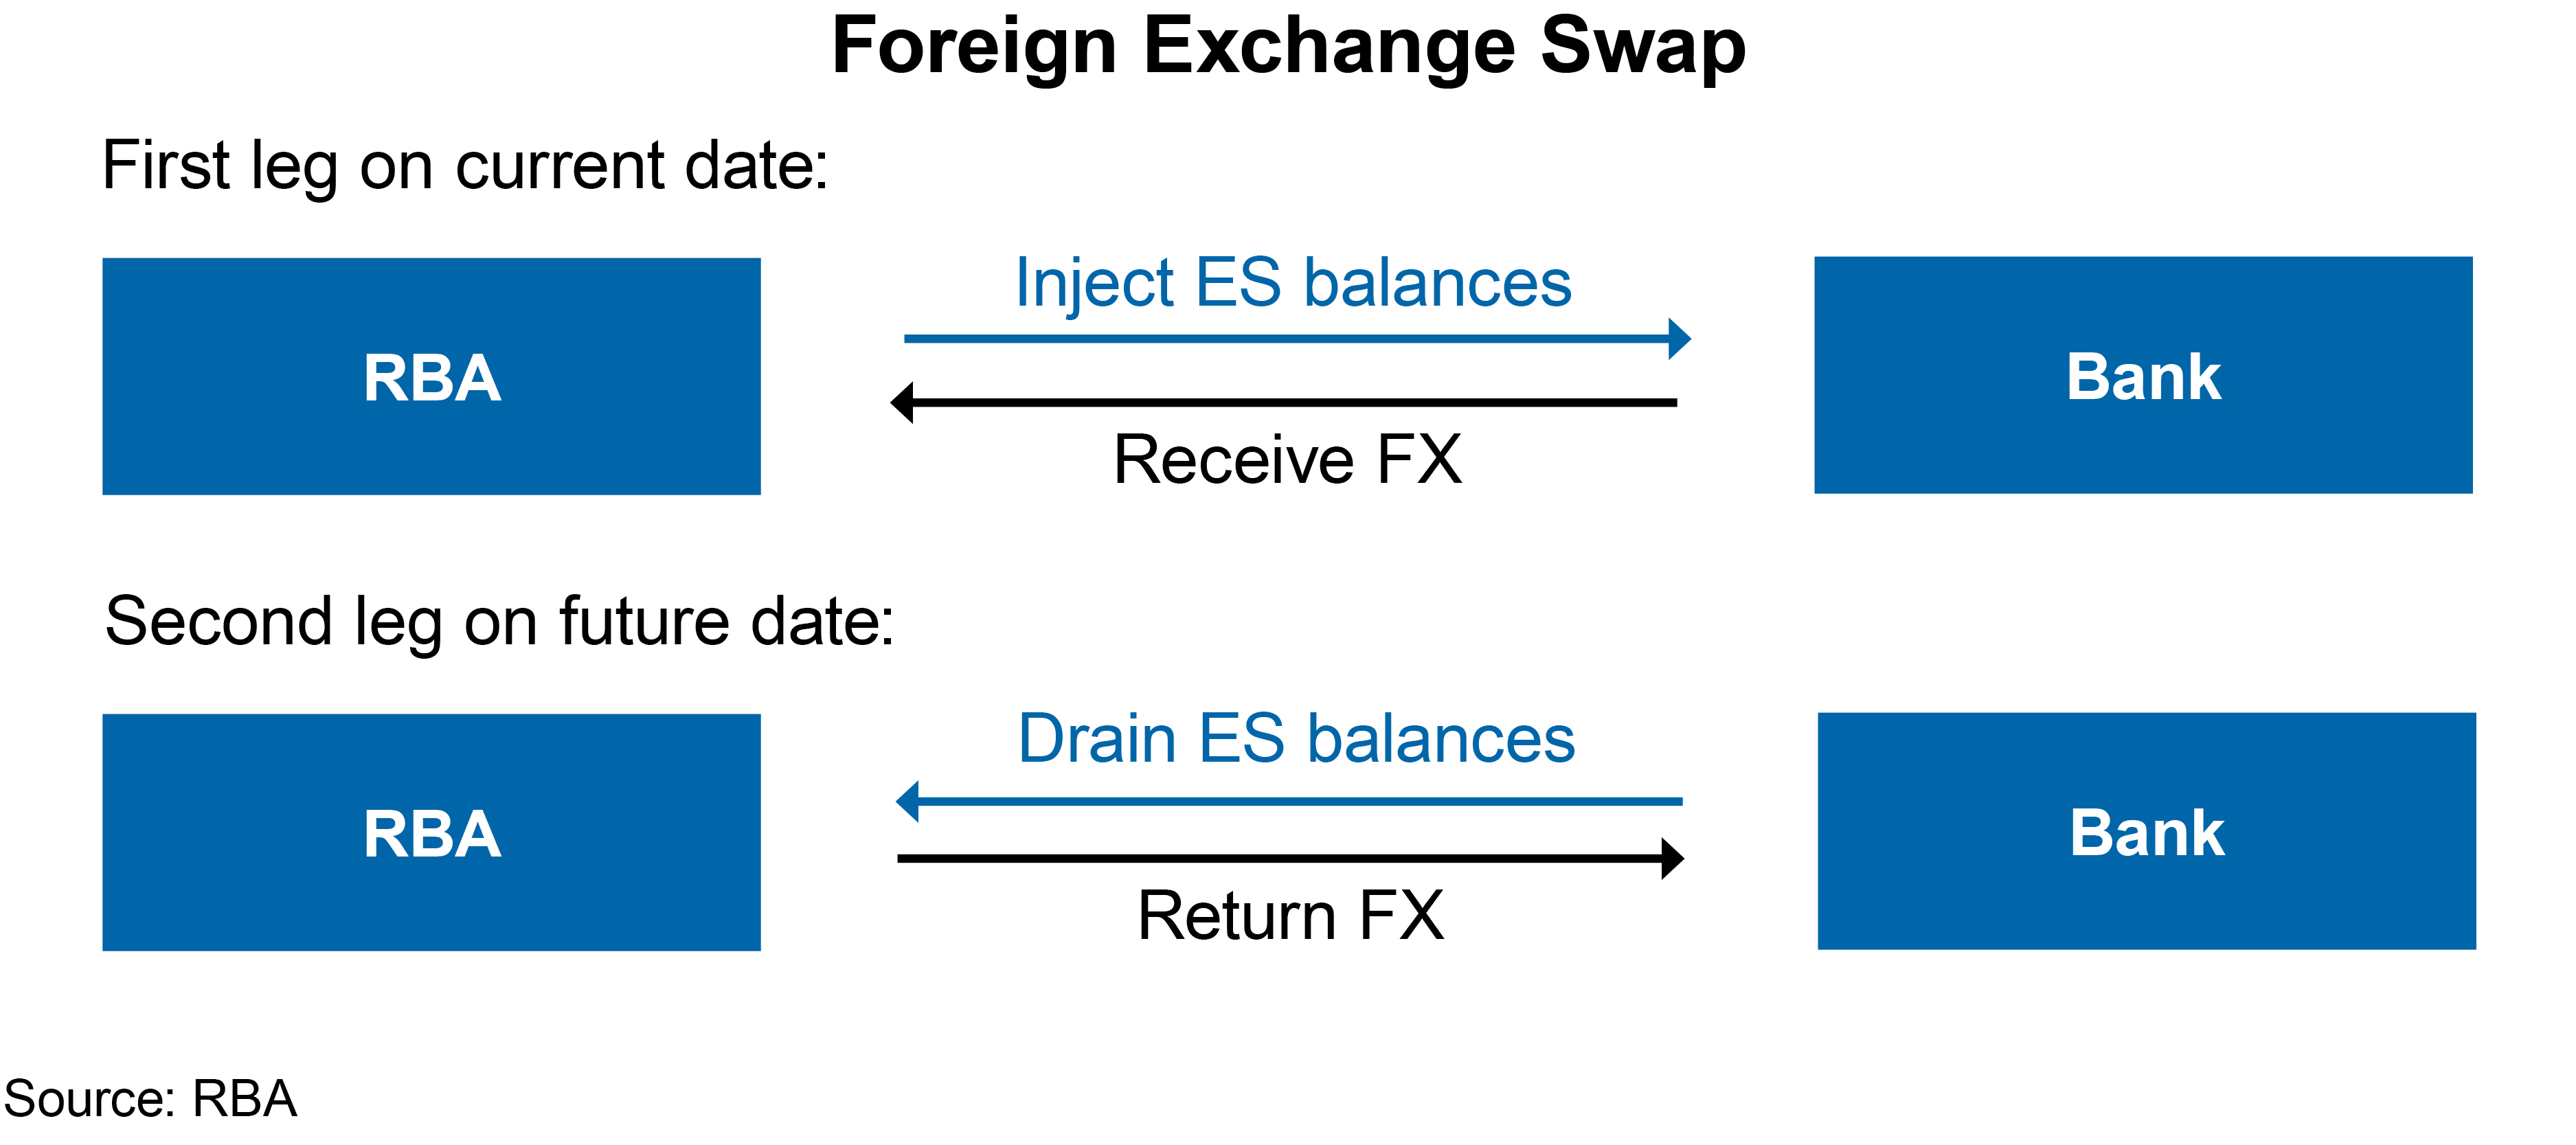
Repos and swaps provide more flexibility for liquidity management than outright purchases or sales of assets since they involve a second leg (when the transaction unwinds) with a date chosen to support liquidity management on that day. It also allows the RBA to accept a much broader range of collateral, such as unsecured bank paper, than it would be willing to purchase outright. By contrast, buying (and then selling) securities outright requires the RBA to take on the price and liquidity risk associated with owning the assets outright. Conducting open market operations by buying and selling government securities outright, while also ensuring that the RBA’s market operations do not affect liquidity in the bond market, would require more government securities than are available in Australia.
The size of daily open market operations is based on forecasts of daily liquidity flows between the RBA’s clients (mainly the Australian Government) and the institutions with ES accounts. In a typical round of market operations, a public announcement is made at 9.20 am that the RBA is willing to auction ES balances against eligible collateral for a certain number of days (ranging from two days to several months, with an average term of around 30 days). Institutions have 15 minutes to submit their bid. The RBA ranks these bids from highest to lowest repo rate and then allocates ES balances to the highest bidders until the amount the RBA intends to auction has been dealt. All auction participants are informed electronically about their allocation. If they have been successful, they will pay the rate at which they bid for the amount allocated. The aggregate results of the auction, including the amount dealt, the average repo rate and the lowest repo rate accepted are published.
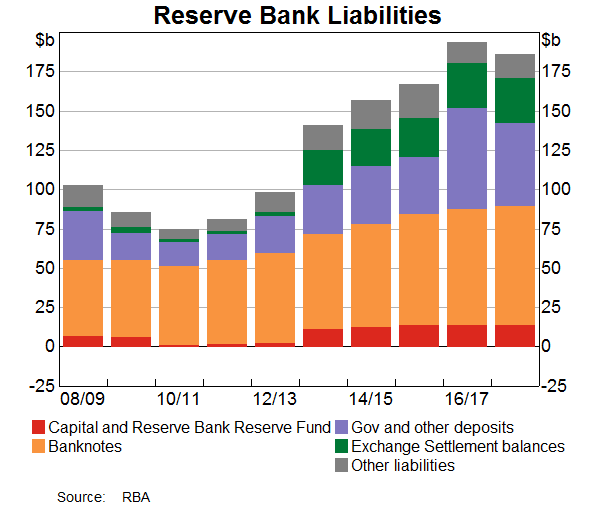
The transactions entered into as part of open market operations are reflected in changes in the RBA’s balance sheet. Changes in the size and composition of liabilities (mainly issuance of banknotes and government deposits) may need to be offset via open market operations to ensure that the availability of ES balances remains appropriate for the smooth functioning of the cash market (Graph 6).
Open market operations affect the asset side of the balance sheet (Graph 7). When the RBA purchases securities under repo, it has a legal claim on the security that was transferred as collateral for the duration of the repo. These claims appear as assets on the balance sheet, along with outright holdings of domestic government securities. When the RBA uses foreign exchange swaps to supply Australian dollars into the local market, the foreign currency-denominated investments associated with the swap are also reflected as assets on the balance sheet. The choice between using repo, foreign exchange swaps or outright purchases to adjust the supply of ES balances is determined by market conditions and pricing. When a large amount of ES balances needs to be supplied or drained, such as when a government bond matures, the RBA might choose to do so using a combination of instruments.
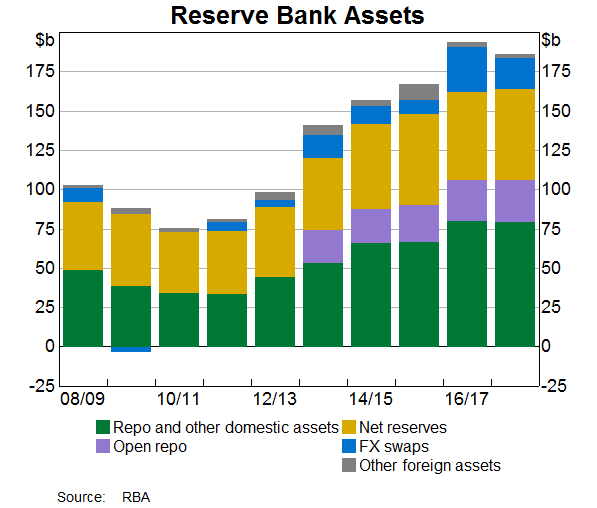
The RBA supplies ES balances not only for monetary policy implementation but also to facilitate the functioning of the payment system. Over recent years, the RBA has been providing more ES balances to banks to enable the settlement of payments outside normal banking hours, such as through direct-entry and the New Payments Platform. These ES balances are supplied under ‘open repos’. An open repo is set up in a similar way to the repo explained in Figure 1, with the initial leg transferring ES balances to banks in return for eligible debt securities as collateral. However, the date of the second leg is not specified, so it is open ended. The ES balances are available (and the claim on securities remain on the RBA’s balance sheet) until the open repo is closed out. These ES balances provided under open repo are held purely to facilitate the effective operation of the payments system after hours and cannot be lent overnight in the cash market. As a result, they have no implications for the implementation of monetary policy. Currently, these balances are around $27 billion. The remainder of ES balances that are available for trading in the cash market are referred to as ‘surplus ES balances’, and are the focus of daily open market operations. Recently, surplus ES balances have been around $2–3 billion. This amount has increased in recent years as demand for balances has risen, partly in response to new prudential regulations on liquidity.