
Please consider supporting our work via Patreon
Please share this post to help to spread the word about the state of things….

/
RSS Feed
Digital Finance Analytics (DFA) Blog
"Intelligent Insight"

We look at Westpac’s poor home lending practice
Please consider supporting our work via Patreon
Please share this post to help to spread the word about the state of things….
We discuss the latest data and its implications
Back in January I published a video entitled “To Buy, Or Not To Buy, That IS indeed the Question” which addressed the question of should I buy property now. It’s still available, and as current as ever it was.
 But as we have seen prices slide further, which we showed in yesterday’s edition of the Property Imperative Weekly, one question is coming up more often from our community. That is, should I SELL now – ever more relevant as the future direction looks to be south, so reducing the paper value of property – to which the answer is, it depends.
Once again, a necessary caveat, as this is not financial advice, and your mileage may vary, but I think there are some principles which are worth exploring in general terms. So today, I am going to touch on some of the most important ones.
First, I think the answer will vary by the type of property holder. For those owning a property to live in – for owner occupation – to provide shelter – you may have reason to switch properties perhaps because of moving with a job, or to trade up, to get more space, or to trade down, to get a smaller place, and possibly release capital on the way through.
Now here is an important point. One property is worth one property. You only need one property. Just one. So at any point in the market cycle, if you sell to buy, you are crystallising value in your existing property at the point in time you sell, and commit to buy a new place at the same time. So in a relative sense, if you buy and sell, you transact at a specific point in time. And even if values have fallen, so you have lost some paper equity in your existing place, the property you are buying may well have fallen also, though of course different markets may be moving at different rates, and even different types of property may have moved differentially. But generally, selling and buying can actually be done at any time, provided of course there are properties to buy, and prospective purchasers for your existing place. It might be much harder if the market itself has frozen.
But often you will have a mortgage on your existing place and you are selling, and often that needs to be repaid from the proceeds of sale. That’s fine provided you have sufficient equity, even if the capital value has fallen, but could be a real barrier if the value of the mortgage is higher than the property – so called negative equity. And if fact, it is negative equity which can become the barrier to switching property, as we have seen in other markets where prices fell 30-40%.
But if you have sufficient equity to repay the mortgage, and need a mortgage on a new place, you may have to apply afresh. Of course bear in mind that lending standards may have become tighter so you might not be able to get the same value of loan as previously, and this is also true if your circumstances have changed. So it is worth checking this out early. Generally, mortgage borrowing power has been reduced in recent months.
Or perhaps your mortgage is portable.
In fact, loan portability is often a standard on all home loans – but you may have to ask, and sometimes it’s not obvious. This means if you choose to move houses, you can take your loan with you. So in this case you are to transfer your existing loan to another property without having to go through the process of refinancing. But you will need to ask the lender for the “hidden” rules and parameters, and generally, you may have to pay slightly more for the flexibility of portability. And overseas, some lenders even allowed negative equity to be transferred to facilitate a move.
Sometimes people will try to sell, rent, and wait for the market to fall further, before buying. That might work, but you are essentially taking a bet on the market. You might be right; you could be wrong. As I have said before predicting future home price movements is a mugs game, and most predictions will be wrong. There are too many moving parts.
Finally, if you are trading down, – seeking a smaller place, to release capital, you may want to bring the transaction forward, because larger value homes are falling faster than smaller ones. On the other hand, those seeking to trade up, and get a larger place might do better to wait, as prices may fall so you can get a larger place for less money. But again, you are betting on the market, and you may be wrong.
One other scenario to consider is being forced to sell, perhaps because the mortgage repayments are just too demanding. In fact, given we have nearly 1 million households in mortgage stress, and flat incomes, the number facing difficulty is increasing. Now the banks have an obligation to assist in cases of hardship, and they may be able to restructure the loan, or even waive interest payments for a bit in this case. They are also loathe to push people out of their homes – as a forced sale – as this risks significant negative publicity and also may reduce the value of the property in the process. But they often “encourage” stressed households to sell, and we are seeing a rise among these households. So households come to accept there is no way out but to sell. In this situation it is probably better to sell sooner rather than later, as in our experience in the current environment the cure rate is very low, unless the problem is created by a short term health or employment hiatus. But often it’s a matter of the income just consistently not covering expenditure. So selling in these circumstances can be a positive circuit breaker, and in a falling market, selling sooner may yield higher net returns.
So now to property investors. The equation here is quite different. We are already seeing some sassy property investors selling, to realise the capital gains they have achieved, remember value is not true value until it is crystallised. In some cases, this is to reinvest in the smaller markets of Adelaide and Hobart, where capital gains are for the moment still being seen. Though that may change.
For some investors, its simply that the net rental yield – the flow of rental payments, less the costs of managing and maintaining the property are now net negative, so unless you can see rapid capital growth and offset losses again other income it might be time to sell.
Our latest data shows that about half of all rentals are underwater on a cash flow basis, especially in Victoria and NSW. Some other states, such as Queensland are doing somewhat better, mainly because values have not lifted so high, and so mortgages relative to rental streams are smaller. So it pays to shop around – as the outcomes are remarkably different. The fact is for many, the true “all in” returns, even allowing for capital appreciation, are remarkably low – and many investors do not do the calculations to know the real picture. They would get a nasty surprise. And if capital values continue to fall, yields will drop also. And in addition, rental rates are more connected with incomes, than home prices, so changes in capital value, or even mortgage rates, do not get reflected in the majority of rents. This is a pre-tax picture by the way.
Talking of tax, the current generous tax incentives are used by many, especially more affluent households, to reduce their effective taxable income. This is why the Government can say that the majority of negatively geared investors do not have large incomes – it is stating the obvious, as net taxable income is after all the tax manipulation!
Some investors are choosing to sell, to lock in significant capital gains (and again the tax breaks are generous), fearing that values may fall ahead. Others are being forced to sell to meet or avoid higher mortgage repayments as they move from interest only loans to principal and interest loans. This is especially true for those holding multiple properties – and many have more than 5, and some more than 20 leveraged investment properties. So they sell to cover the costs on the remaining ones.
And once again it is important to remember mortgage underwriting standards are much tighter now – including a 20% haircut on rental streams to cover times when the property is vacant, a repayment assessment made on a pre-tax not post-tax position and on a principal and interest basis – even if applying for an interest only loan. And significantly more questions, and evidence required to get a loan if you are materially dependent on the rental streams to cover the costs of the mortgage.
Remember too that Labor would freeze negative gearing for most new transactions (but they do not plan retrospective changes, so existing negatively geared loans would be more attractive to retain) and they may still have tax breaks for newly built property. There are no details as yet.
Generally, in a downturn, its investors who flee the market first – as data from Ireland and the UK both show. This is why investor mortgages are more risky – the Bank of England says four times more likely to default.
So my perspective would be investors might seriously want to review their portfolios, and estimate the true net returns. Given many will have paper profits on capital gains over recent years, there is a strong logic to sell.
But again, it does depend on your view of future home price movements. As you know, we hold the view that prices are correlated with loan availability, and as because loans are now harder to come by, property prices have further to fall. They are at least 30% overvalued compared with their true economic value.
So the bottom line is this. Property Investors have more of a burning platform to take action and consider selling before prices fall further. Down Traders also would be in a similar position as they are also seeking to lock in capital growth. On the other hand, Up Traders may prefer to wait – assuming prices will fall further. And those owners occupied sellers, who need to move, should probably, do so in any case, with the caveat that the mortgages available now will be smaller than they were a few months again.
Again, to reiterate, this is not financial advice, and it’s just my – hopefully informed – opinion, but you would need to get more specific guidance based on your individual circumstances.
Welcome to The Property Imperative Weekly to 12 May 2018.
 In this week’s review of the latest finance and property news we look at the impact of the impending credit crunch. Watch the video or read the transcript.
The evidence is mounting that we are entering a credit crunch, driven by tighter lending restrictions, and the recent revelations from the Royal Commission. And the implications of this are profound, not just in terms of the immediate impact on home prices, but also, and perhaps more significantly, on the broader economy. Housing and finance for housing has formed a significant plank in the trajectory of the economy over recent years and when coupled with construction activity it has supported the transition from the mining boom. But now that could change, and the impact on households and the broader economy is potentially profound, as borrowers deal with massively higher debt levels, and the inability to spend as a result; and new loans harder to get. As a result, home prices will fall, further and harder. Let’s look at the evidence.
First there is a quite a strong relationship between auction volumes and home price growth. This is why we watch the auction results so closely. Now we know there is a lot of noise in the system because of the way auction volumes are reported – for more on that watch our separate video – Auction Results Under The Microscope, but CoreLogic reported that the auction volumes fell last week. There was a total of 2,311 auctions held, which returned a final clearance rate of 62.1 per cent. Over the same week last year, the clearance rate was much stronger with 73.0 per cent of the 1,689 auctions cleared. Melbourne’s final clearance rate has been fairly stable over the last 3 weeks. Last week’s final clearance rate came in at 63.7 per cent across 1,144 auctions, compared to 63.9 per cent across 1,334 auctions the previous week. This time last year, 792 homes went under the hammer, returning a clearance rate of 77.5 per cent. Sydney’s final auction clearance rate increased to 63.1 per cent across 797 auctions last week, after falling to 55.8 per cent across 829 auctions over the previous week, the lowest clearance rate recorded across the city all year. Over the same week last year, 592 homes went to auction and a clearance rate of 73.8 per cent was recorded. Across the smaller auction markets, Canberra was the only city to see an increase in auction volumes with 102 auctions held, up from 92 over the previous week. Clearance rates were varied with Adelaide, Brisbane and Perth recording lower clearance rates week-on-week. Of the non-capital city auction markets, Geelong returned the highest final clearance rate of 75.0 per cent across 58 auctions.
They are expecting lower auction volumes this Saturday with Melbourne, the busiest city at 1,012 auctions being tracked so far, down from 1,144 last week while Sydney has 696 auctions scheduled this week, down from 797 last week.
Lending criteria are tighter now with a focus on real expenses, supported by evidence. (Why this was not happening previously is a whole other discussion). Our household surveys reveal that more households simply cannot meet the current new and tighter borrowing requirements. Borrowing power has been reduced – significantly. For example, in one scenario, take a household with incomes of close to $200k. Previously they might have been able to get a $1million loan, but now if they provide more detailed expenses – including the fact they pay for child care, their borrowing power will now be scaled back closer to $650,000. Most lenders are applying stricter criteria – though we see in our data the non-banks are still more flexible. But the lending tap is being turned down, significantly.
It is already impacting the ABS housing finance data to March 2018. The trends are pretty clear, lending is slowing, and bearing in mind our thesis that lending and home prices are inextricably linked, this signals further home price falls ahead, which will be exacerbated by even tighter lending standards we think are coming. You can watch our recent video “The Absolute Link Between House Prices and Credit” for more on this. And remember debt is still rising faster than inflation or wages, so household debt will continue to rise from its already overextended level. The rolling 12 month rolling trend says it all, and we see that both owner occupied and investor loan flows are slowing, with investor lending shrinking faster. You can watch our separate video on the data “Housing Credit Goes into Reverse”. The proportion of investor loan flows slid again (excluding refinance) to 43.6%.
CoreLogic did a neat piece of analysis showing the strong correlation between home prices and investor property lending. They said that since macro prudential measures were announced and implemented by APRA, the trends in housing related credit have changed remarkably. Soon after APRA announced the ten percent annual speed limit for investment lending in December 2014, investment housing finance commitments peaked at 55% of mortgage demand and investment credit growth moved through a cyclical peak rate of annual growth at 10.8%. Around the same time, the quarterly rate of home value appreciation peaked in Sydney and Melbourne; the two cities where investment has been most concentrated. As credit policies were tightened in response to the APRA limits, then loosened as lenders overachieved their APRA targets, the housing market responded virtually in concert. Interest rate cuts in May and August of 2016 helped to support a rebound in the pace of capital gains, however as lenders came close to breaching the 10% limit, at least on a monthly annualised basis, credit once again tightened and the second round of macro prudential, announced in March 2017, saw credit availability restricted further. The result of changes in credit availability has been evident across most housing markets, but is very clear in Sydney and Melbourne; dwelling values started to track lower in Sydney from July last year and peaked in Melbourne in November last year.
And the latest trends in home price movements shows further falls in Sydney and Melbourne. In fact, from the start of the year, only Brisbane has shown any increase, all other capital cities fell with an average of 0.26%, and this before the tighter lending standards have started to bite. But of course, whilst we see some slippage now, this is small beer relative to the average gained since May 2012 of 46.7% with the strongest gains in Sydney at 60.9% followed by Melbourne at 43.8%.
Others are now revising their forecasts on future home price momentum with SQM research downgrading their estimates for Sydney, Melbourne, Brisbane, Darwin, Canberra and The Capital City Average. They have tended to be more bullish than some other analysts, but gravity is finally catching up and they also said property prices in Sydney and Melbourne are massively overvalued against fundamentals – by up to 45% we agree.
UBS also published analysis which suggests that home prices are likely to fall, on the back of weaker credit. Once again, gravity will win.
You may remember the RBA warned recently of the potential for credit availability to become more constrained. And economists are now all beginning to highlight the potential impact – the question now is, how tight will lending become? Will the regulators try to alleviate the impact, for example freeing up property investor lending, and will the next move in interest rates be up, or down in the months ahead. More importantly, if lending tanks as we expect, then the spill over effects on the broader economy, growth, home prices, all compound the problems. We are in for a credit crunch, so my scenario 2 – see our video on “Four Potential Finance and Property Scenarios – None Good”.
And if you want more evidence of the economic indicators, look at Retail turnover from the ABS this week which showed further evidence of the stress on households. Retail turnover showed no growth in March, in seasonally adjusted terms following a 0.6 per cent rise in February 2018. Our preferred trend estimates for Australian retail turnover rose 0.3 per cent in March 2018, following a rise (0.3 per cent) in February 2018. Compared to March 2017, the trend estimate rose 2.6 per cent. And across the states there were some significant variations, with NSW up 0.3%, VIC. Up 0.5%, QLD and SA up 0.1%, WA and flat, the Northern territories up 0.3% and ACT 0.4%.
And this is consistent with our Household Finance Confidence Index, to the end of April 2018, which showed that households remain concerned about their financial situation. This is consistent with rising levels of mortgage stress, as we reported recently. The index fell to 91.7, down from 92.3 in March. This remains below the neutral 100 setting, and continues the decline since October 2016. You can watch our separate video “Household Financial Confidence Takes Another Dive” Again, we continue to see little on the horizon to suggest that household financial confidence will improve. Currently, wages growth will remain contained, and home prices are likely to slide further, while costs of living pressures continue to grow. Whilst banks have reduced their investor mortgage interest rates to attract new borrowers, we believe there will also be more pressure on mortgage interest rates as funding costs rise, and lower rates on deposits as banks trim these rates to protect their net margins. In the last reporting round, the banks were highlighting pressure on their margins as the back-book pricing benefit from last year ebbs away.

We got half year results from Westpac this week which were an interesting counterpoint to recent announcements, with stronger NIM, including from Treasury. Their CET1 ratio fell a little, but they are still well placed. Mortgage delinquencies were a little higher but and they had been able to lift margin by reducing rates on some deposits, though they did signal higher funding at the moment and the risks of higher rates ahead. They defended the quality of their mortgage portfolio. One slide in the investor presentation said “Australian mortgages performing well”. The data showed that Westpac originated $5 billion in mortgages in the first half 18, or about $10 billion over a year, or the same as the bank funded as far back as 2014. Compare that with the $18 billion in 2017 and 17 billion the year before that. Momentum is slowing. Analysts, UBS, who called out potential “liar loans” at the bank said they say they remain concerned with the findings of APRA’s ‘Targeted Review’ into WBC’s mortgage serviceability assessment and in particular comments from Wayne Byres (APRA Chairman) that WBC was a “significant outlier” and WBC’s Board Papers which stated its performance was “poor, both absolutely and relative to peers”. Further, WBC stated in the March quarter ~20% of loans were approved with Debt-to-Income (DTI) > 6x. This as a very high level especially given the concerns that mortgagor gross household income appears to be overstated across the industry, and the total debt position of customers is not yet fully visible (the mandatory comprehensive credit reporting regime begins 1 July 2018). You can watch our separate video “Westpac and The Liar Loans Incident”
CBA reported their Q3 unaudited trading results, with a statutory net profit of approximately $2.30bn, in the quarter and unaudited cash net profit of approximately $2.35bn in the quarter. This is down 9% on an underlying basis compared with 1H18. We see some signs of rising consumer arrears, and a flat NIM (stark contrast to WBC earlier in the week!). Expenses were higher due to provisions for regulatory and compliance. They reputation is in question.
The impact of reputational risk is highlighted by AMP’s Q118 results. They said cashflows were subdued in Australian wealth management but there was continued strength in AMP Capital and AMP Bank. AMP Bank’s total loan book up 2 per cent to A$19.8 billion during the quarter. The portfolio review of manage for value businesses continues. In response to ASIC industry reports, AMP continues to review adviser conduct, customer fees, the quality of advice, and the monitoring and supervision of its advisers. They anticipate that this review will lead to further customer remediation costs and associated expenses and they will provide a further update at or before the 1H 18 results. This will include enhancements to AMP’s control frameworks, governance and systems.
AMP’s share price has fallen significantly, to levels not seen since 2003, and in a vote of no confidence, Australian Ethical has announced it will completely divest from AMP following revelations of “systemic prudential and cultural issues” at the royal commission. They will not reinvest until AMP demonstrates they have addressed their underlying issues. And they are watching the two of the four major banks they have holdings in, in the light of the findings from the royal commission too.
Finally, It’s worth looking at the impact of higher interest rates on the market. The Bank of England made small adjustments from a low base recently, and the results have been negative and predictable. The UK economy remains in the doldrums, so no surprise, the cash rate remained unchanged this month. In fact, the small rises made before have translated directly to lower home prices, reflecting the highly leverage state of many households. GDP is expected to grow by around 1¾% per year on average over the forecast period. Household consumption growth remains subdued. CPI inflation fell to 2.5% in March, lower than expected.
Indeed, Fitch Ratings says the UK household sector’s worsening financial health reduces consumer resilience to income or interest rate shocks and presents risks for UK consumer loan portfolios. Consumer credit has been a key driver of rising household debt. But weaker household finances reduce the resilience of consumer spending – by far the largest demand component of UK GDP – to shocks. A major interest rate shock appears unlikely (they forecast the UK base rate to rise gradually, to 1.25% by end-2019), but a more immediate shock could come from tightening credit supply. The impact of the Brexit referendum on real wages may be fading, but Brexit uncertainty creates risks of a bigger shock to growth and employment. They say that UK banks are highly exposed to UK households, but mostly through mortgages, with consumer credit accounting for just 10% of banks’ lending to the sector. High household debt is a constraint on UK banks’ operating environment. Does this sound familiar?
Digital Finance Analytics (DFA) has released the April 2018 mortgage stress and default analysis update.
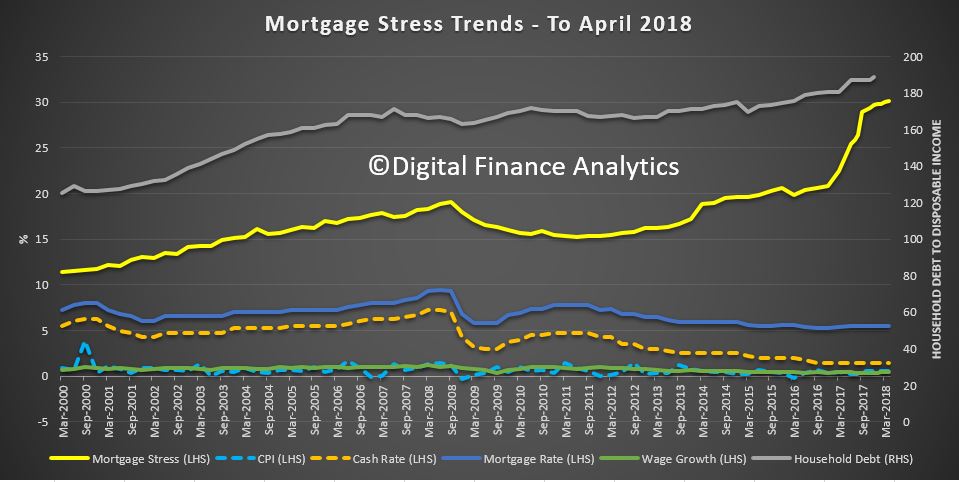
Across Australia, more than 963,000 households are estimated to be now in mortgage stress (last month 956,000). This equates to 30.1% of owner occupied borrowing households. In addition, more than 21,600 of these are in severe stress, up 500 from last month. We estimate that more than 55,600 households risk 30-day default in the next 12 months. We expect bank portfolio losses to be around 2.8 basis points, though losses in WA are higher at 5 basis points. We continue to see the impact of flat wages growth, rising living costs and higher real mortgage rates.
 Martin North, Principal of Digital Finance Analytics says “overall, risks in the system continue to rise, and while recent strengthening of lending standards will help protect new borrowers, there are many households currently holding loans which would not now be approved. The recent Royal Commission laid bare some of the industry practices which help to explain why stress is so high. This is a significant sleeping problem and the risks in the system remain higher than many recognise”.
News On the Finance Sector Is Set to Get Worse.
Australia is horrified by what they are learning from the Royal Commission; yet this is only the beginning. News on the finance sector is set to get much worse.
Gill North, a Professor of law at Deakin University and Principal at DFA, suggests “the issues highlighted by the RC represent only the tip of the iceberg and Australia is in for a bumpy and uncomfortable ride”. The systemic risks across the financial sector and economy are now much higher than most participants realise, and these risks are exacerbated by the concentration of the finance sector and its many interconnections, the laxity of the lending standards over the last decade, the high levels of household debt (and the distribution of this debt), and the heavy reliance of the Australian economy on the health of the residential property market.
At some point down the road, the true resilience of the financial institutions, their consumers, and the broader economy will be tested and put under extreme pressure. And when this occurs, the high levels of household debt and financial stress, and the large disparities between the population segments that have considerable income, savings and wealth buffers, and those who have no such buffers, will become starker. “When the next housing or financial crisis hits (and the question is when and not if), the ensuing impact on the finance sector, many Australian households, and the broader economy will be severe. Yet most, if not all, of the financial institutions, the regulators, policy makers, and consumers still remain largely oblivious to what lies ahead.”
Martin North says: “We continue to see the number of households rising, and the quantum is now economically significant. Things will get more severe, especially as household debt continues to climb to new record levels. Mortgage lending is still growing at two to three times income. This is not sustainable and we are expecting lending growth to continue to moderate in the months ahead as underwriting standards are tightened and home prices fall further”. The latest household debt to income ratio is now at a record 188.6.[1]
Our analysis uses the DFA core market model which combines information from our 52,000 household surveys, public data from the RBA, ABS and APRA; and private data from lenders and aggregators. The data is current to end April 2018. We analyse household cash flow based on real incomes, outgoings and mortgage repayments, rather than using an arbitrary 30% of income.
Households are defined as “stressed” when net income (or cash flow) does not cover ongoing costs. They may or may not have access to other available assets, and some have paid ahead, but households in mild stress have little leeway in their cash flows, whereas those in severe stress are unable to meet repayments from current income. In both cases, households manage this deficit by cutting back on spending, putting more on credit cards and seeking to refinance, restructure or sell their home. Those in severe stress are more likely to be seeking hardship assistance and are often forced to sell.
The forces which are lifting mortgage stress levels remain largely the same. In cash flow terms, we see households having to cope with rising living costs – notably child care, school fees and fuel – whilst real incomes continue to fall and underemployment remains high. Households have larger mortgages, thanks to the strong rise in home prices, especially in the main eastern state centres, and now prices are slipping. While mortgage interest rates remain quite low for owner occupied borrowers, those with interest only loans or investment loans have seen significant rises. We expect some upward pressure on real mortgage rates in coming months as international funding pressures mount, a potential for local rate rises and margin pressure on the banks thanks to a higher Bank Bill Swap Rate (BBSW).
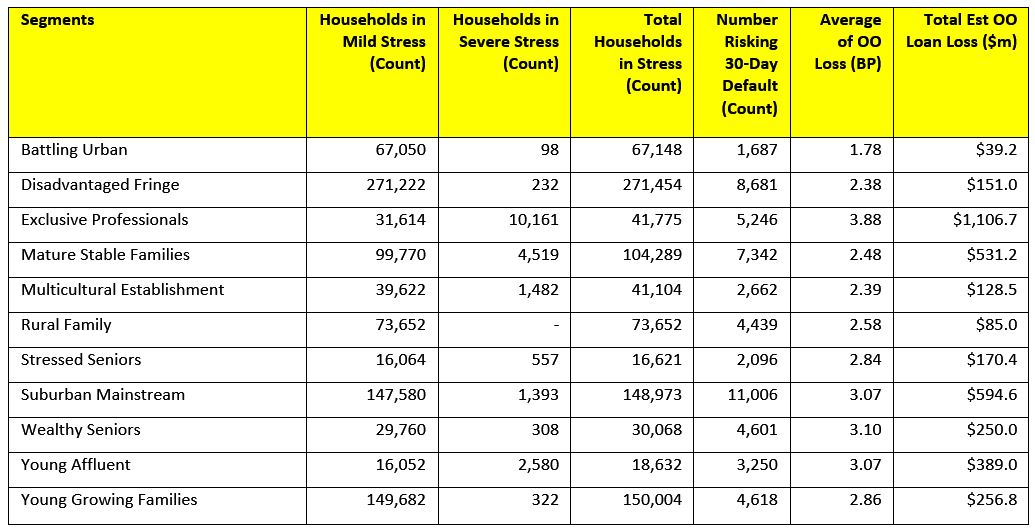
Probability of default extends our mortgage stress analysis by overlaying economic indicators such as employment, future wage growth and cpi changes. Our Core Market Model also examines the potential of portfolio risk of loss in basis point and value terms. Losses are likely to be higher among more affluent households, contrary to the popular belief that affluent households are well protected.
 Stress by The Numbers.
Regional analysis shows that NSW has 262,577 households in stress (261,159 last month), VIC 256,353 (258,303 last month), QLD 175,960 (176,154 last month) and WA has 128,600 (126,606 last month). The probability of default over the next 12 months rose, with around 10,513 in WA, around 10,316 in QLD, 13,830 in VIC and 14,798 in NSW.
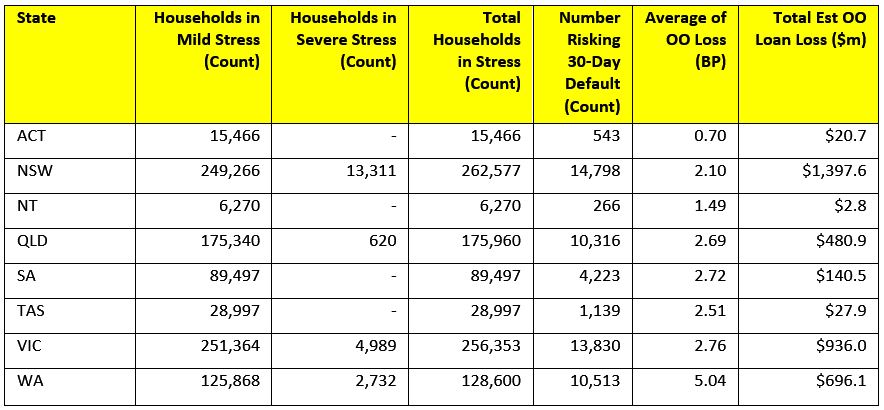 The largest financial losses relating to bank write-offs reside in NSW ($1.4 billion) from Owner Occupied borrowers) and VIC ($936 million) from Owner Occupied Borrowers, which equates to 2.10 and 2.76 basis points respectively. Losses are likely to be highest in WA at 5 basis points, which equates to $696 million from Owner Occupied borrowers. A fuller regional breakdown is set out below.
 Here are the top post codes sorted by the highest number of households in mortgage stress.
 [1] RBA E2 Household Finances – Selected Ratios December 2017 (Revised 3rd April 2018).
You can request our media release. Note this will NOT automatically send you our research updates, for that register here.
[contact-form to=’mnorth@digitalfinanceanalytics.com’ subject=’Request The April 2018 Stress Release’][contact-field label=’Name’ type=’name’ required=’1’/][contact-field label=’Email’ type=’email’ required=’1’/][contact-field label=’Email Me The April 2018 Media Release’ type=’radio’ required=’1′ options=’Yes Please’/][contact-field label=”Comment If You Like” type=”textarea”/][/contact-form]
Note that the detailed results from our surveys and analysis are made available to our paying clients.
Interesting to read Moody’s assessment of APRA’s changed stance relative to the 10% speed limit for investor loans in “Australia’s tighter bank regulation will contain risk from removal of investor lending restriction, a credit positive.” Overall they see the underwriting standards rising, reducing risk, though they recognize some potential to lift investment loan volumes, which are inherently more risky.
Last Thursday, the Australia Prudential Regulation Authority (APRA) announced its intention to remove the current 10% limit on investor loan growth, replacing it with additional requirements for bank boards to comply with APRA’s guidelines for lending policies and practices. Although removal of the cap on investor loan growth will likely spur growth in investor lending, which we view as more risky than lending to owner occupiers, APRA’s increased oversight to ensure that bank underwriting continues to strengthen contains the risk, a credit positive.
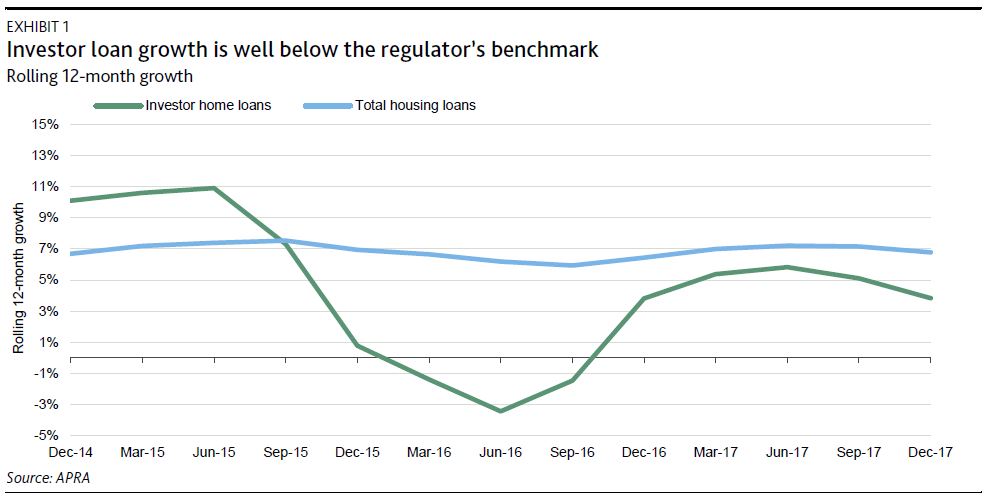
For a bank to gain an exemption from the limit on investor loan growth, the bank’s board must confirm that it has operated below the 10% limit for at least the past six months. As shown in Exhibit 1, investor loan growth for the banking system has been running at well below 10%.
The board also will have to provide written confirmation that lending policies meet APRA’s guidance on serviceability assessments as set out in Prudential Practice Guide APG 223 – Residential Mortgage Lending (APG 223). In particular, bank’s underwriting will need to include interest rate buffers comfortably above two percentage points and interest rate floors comfortably above 7%, which must apply to a borrower’s new and existing debt; haircuts on uncertain and variable income, such as, for example, at least a 20% haircut on nonsalary and rental income; and for interest-only loans, an assessment of serviceability for the remaining principal and interest repayments after the interest-only term.
Furthermore, the board also must confirm that lending practices meet APRA’s guidance on the assessment of borrower financial information and management of overrides, as set out in APG 223. In particular, banks will need to commit to the following:
- Improved collection of a borrower’s expenses to reduce reliance on benchmark estimates such as the Household Expenditure Measure
- Strengthen controls to verify a borrower’s existing debt and prepare to participate in the new comprehensive credit reporting regime that takes effect 1 July 2018. Under the new regime, information shared by banks on a customer’s credit history will be expanded beyond just reporting negative behaviour to provide a more balanced assessment
- Setting risk tolerances on the extent of overrides to lending policies
- Develop limits on the proportion of new lending at high debt-to-income levels (where debt is greater than 6x a borrower’s income), and policy limits on maximum debt-to-income levels for individual borrowers
We consider APRA’s increased focus on lending policies and practices a strong mitigant against the risk of a significant rise in investor lending. Indeed, APRA has cautioned that a return to more rapid rates of investor loan growth could warrant the application of a countercyclical capital buffer or some other industrywide measure.
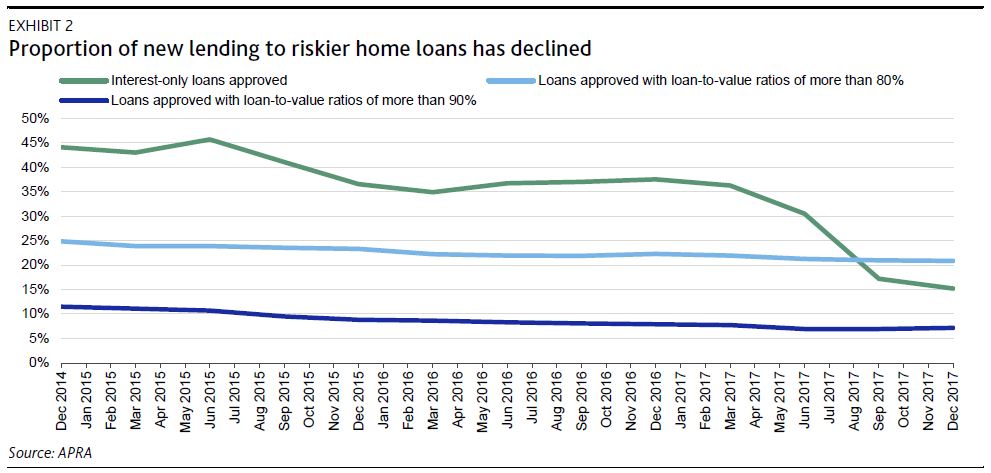
Furthermore, APRA’s announcement reflects its recognition that since the introduction of the limit in December 2014, banks’ loan underwriting and lending practices have improved, as reflected by the decline in investor interest-only and high loan-to-value lending (see Exhibit 2). APRA also cited strengthening bank capitalisation, which has been supported by higher regulatory capital requirements.
Banks will have until 31 May 2018 to provide all necessary confirmations for the removal of the investor loan growth benchmark on 1 July 2018.
Non-bank lender, Bluestone Mortgages, has announced its entry into the near prime space.

The move includes rate cuts of up to 2.25 basis points across its entire product suite, at a time when “PAYG and credit impaired customers are affected by the tightening criteria of traditional lenders”.
It comes off the back of extra funding through the acquisition of Cerberus Capital Management.
The Crystal Blue portfolio is being seen as particularly ambitious, comprising of full and alt doc products geared to support established self-employed borrowers and PAYG borrowers with a clear credit history.
Head of sales and marketing at Bluestone Mortgages, Royden D’Vaz, said, “The recent acquisition of the Bluestone’s Asia-Pacific operations by Cerberus Capital Management has enabled a number of immediate opportunities to be realised, most notably the assessment of our full range of products and to ensure they fully address market demands.
“We’re now in an ideal position to aggressively sharpen our rates based on the new line of funding, and pass on the considerable net benefit to brokers and end-users alike.
“The rate reductions have significant strategic implications as it places the company in a position to expand its operations into the near prime space as a natural extension of its specialist lending focus. This comes at an opportune time as a growing volume of self-employed, PAYG and credit impaired customers are affected by the tightening criteria of traditional lenders.
“Unlike big banks, we don’t have credit scorecards, which means we’re able to assess every borrower based on their merits and individual circumstances. We’re not one-size-fits-all by any means, which is increasingly appreciated.”
The move is being actively supported by the extension of the BDM, credit assessor and support teams to enhance access to decision makers to help brokers get more deals done, more often.
Bluestone’s is now focussed on actualising a number of imminent opportunities that address current market demands. The company says the series of rate reductions are the beginning of many initiatives that will enhance or expand the company’s portfolio.
The Reserve Bank New Zealand has released a paper “Loan-to-Value Ratio Restrictions and House Prices”.
Their analysis shows that LVR limits do have an impact on home prices. But the relationship is not linear, and needs to be binding to have significant impact.
This paper contributes to the international policy debate on the effect of macroprudential policy on housing-market dynamics. We use detailed New Zealand housing market data to evaluate the effect of loan-to-value ratio (LVR) restrictions on house prices. The main challenge in identifying these effects is that housing markets are affected by a range factors over and above LVR policy. For example, New Zealand experienced a raft of policy changes and macroeconomic shocks during the periods in which LVR policy changes were implemented. Many of these shocks and policies are likely to have affected the housing market. For example, when the first LVR policy was implemented, retail interest rates were rising alongside an increasing expectation for monetary policy tightening, while the New Zealand Treasury was adjusting housing-related policies at the time of the second LVR policy. This paper uses the exemption for new builds from the LVR restrictions as a natural experiment to identify the effect of LVR policy.
We find that, over the one year window around the new home exemption, the first LVR policy (referred to as ‘LVR 1’) had a 3 percent moderating effect on house prices, and this moderating effect is broadly similar across both Auckland and the rest of New Zealand.
Interestingly, our estimates show that LVR 2 (which tightened restrictions on Auckland properties and loosened restrictions elsewhere) did not significantly stop Auckland house prices from rising. By contrast, house prices in the rest of New Zealand (RONZ) increased by 3 percent due to the relative loosening of the LVR restriction. In LVR 3, the RBNZ further tightened the LVR restrictions on property investors nationwide. The moderating effect of LVR 3 was clearly seen in Auckland with a 2.7 percent reduction in house prices. This LVR 3 effect is both statistically and economically significant, as during the same period the average house price increased by 5.8 percent.
Overall, we estimate that the LVR policies reduced house price pressures by almost 50 percent. However, the effect of LVR policy is highly non-linear. When it becomes binding, LVR policy can be very effective in curbing housing prices.
UBS continues their forensic dissection of the mortgage industry with the release of their analysis of data from Westpac, which the lender provided to the Royal Commission. This was representative data from the bank of 420 WBC mortgages analysed by PwC as part of APRA’s recent review. APRA Chairman Wayne Byres found WBC to be a “significant outlier”, with
PwC finding 8 of the 10 mortgage ‘control objectives’ were “ineffective”.
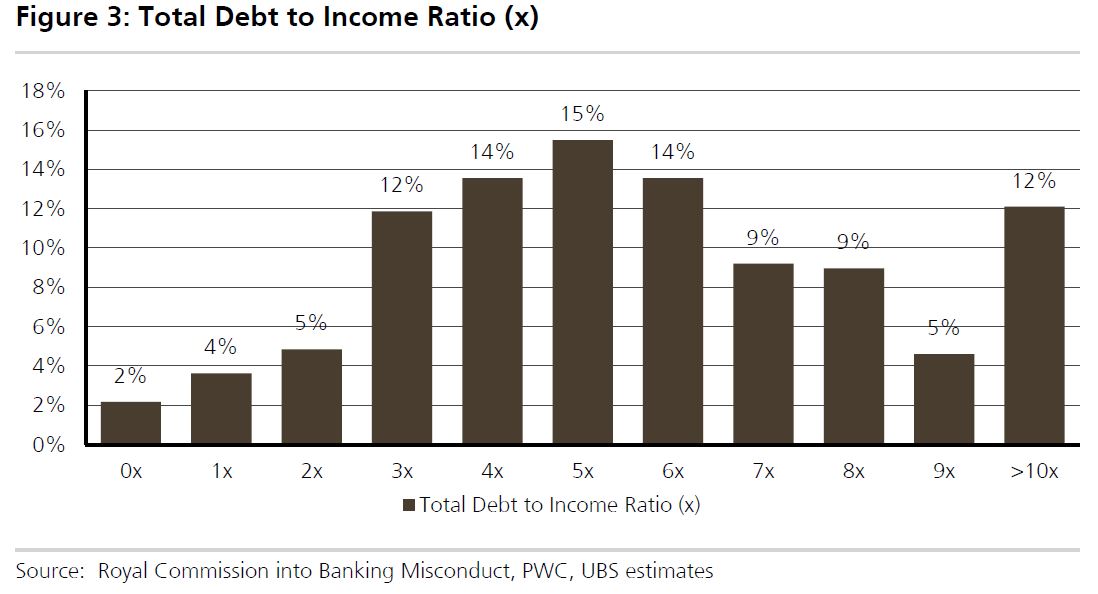
UBS says for the first time information on borrower’s Total Debt-to-Income ratios (not Loan-to-Income) has been made available. They found WBC’s median Debt-to-Income at 5.4x, with 35% of the sample having Debt-to-Income ratios of >7x. Further 46% of the mortgage applications had an assessed Net Income Surplus of <$250 per week.
This data raises questions regarding the quality of WBC’s $400bn mortgage book (70% of its loans). While WBC has undertaken significant work to improve its mortgage underwriting standards over the last 12 months, we expect it and the other majors to further sharpen underwriting standards given the Royal Commission’s concerns with Responsible Lending. This could potentially lead to a sharp reduction in credit availability.
This raises two questions. First how much tighter will credit availability now be. We continue to expect an absolute fall in loan volumes, and this will translate to lower home prices.
Second, is this endemic to the industry, or is Westpac really an outlier? From our data we see similar patterns elsewhere, so that is why we continue to believe we have systemic issues.
Combined these are significant and enduring risks. Chickens will come home to roost! Especially if rates rise.
The mortgage sector can expect a lower volume of loans in the short-term as banks tighten their lending standards, according to the CEO of an Australian property research firm.

The royal commission has found that the current process for ensuring home loan customers provide accurate information about their incomes, expenses, and debts is flawed, RiskWise Property Research CEO Doron Peleg said in a statement. This includes details gathered by mortgage brokers on the living expenses home loan customers declare in their applications.
Banks have already started to apply greater scrutiny to the living expenses disclosed by their customers. Westpac, for example, informed brokers that they need to require customers to submit more details about their spending when applying for a mortgage. They now need to break their spending down into 13 categories instead of six.
“In the short term at least, this is likely to result in a lower volume of loans, as seen in the UK which had a 9% drop in volume as a result of the 2014 Mortgage Market Review to address lax lending standards,” Peleg said.
Peleg also expects the duration of loan approvals to increase “significantly” and for borrowing capacity to drop. He pointed to figures from global investment bank UBS, which recently forecasted credit availability to drop by 21%-41%.
Peleg added that tighter standards also pose risks to property developers as some areas – especially properties at the top end of the market – are more exposed to price corrections. He said many borrowers need to rely on the current borrowing capacity to purchase these properties. “Significant reduction to the borrowing capacity may have a direct impact on these properties.”
According to the CEO, the demand of buyers on specific properties are based on lending approvals, pre-approvals, and risk assessments by independent research houses such as RiskWise.
“If the major lenders’ ‘black list’ some suburbs / postcodes or if there are multiple media releases from independent research houses that flag a certain area and property types as high-risk, based on their models, this might have a macro-impact on the market,” he added.