Productivity, Technology, and Demographics

From The IMF Blog

Hal Varian, chief economist at Google, says that if technology cannot boost productivity, then we are in real trouble.

In a podcast interview, Varian says thirty years from now, the global labor force will look very different, as working age populations in many countries, especially in advanced economies, start to shrink. While some workers today worry they will lose their jobs because of technology, economists are wondering if it will boost productivity enough to compensate for the shifting demographics—the so-called productivity paradox.

“I would say there are at least three forces at work,” says Varian. “One of these is the investment hangover from the recession—companies have been slow to reestablish their previous levels of investment. The second has been the diffusion of technology—the increasing gap between some of the more advanced companies and less advanced companies. And third, existing metrics are facing some strains in terms of adapting to the new economy.”

Varian believes demographics is important, particularly now that baby boomers, who made up most of the labor force from the 1970s through 1990s, are now retiring but will continue to be consumers.

“Today, the working labor force is growing at less than half of the rate of population growth, which is a concern in terms of how to make the amount produced equal to the amount that people want to consume,” he said.

Varian’s answer to the concern of older workers who are afraid robots will take over their jobs:

“There’s a saying in Silicon Valley that we overestimate what can happen in two years, and we underestimate what can happen in ten years—this has proven true time and again. What the 40- and 50-year-olds should be doing is continuing to learn. Lifetime learning is the norm now.”


More political and policy uncertainties as global economic recovery improves – IMF

The Communiqué of the Thirty-Fifth Meeting of the IMFC says the global economic recovery is gaining momentum, commodity prices have firmed up, and deflation risks are receding. While the outlook is improving, growth is still modest and subject to heightened political and policy uncertainties.

Crisis legacies, high debt levels, weak productivity growth, and demographic trends remain challenging headwinds in advanced economies; while domestic imbalances, sharper-than-expected financial tightening, and negative spillovers from global uncertainty pose challenges for some emerging market and developing countries.

Trade, financial integration, and technological innovation have brought significant benefits, improving living standards, and lifting hundreds of millions out of poverty. However, the prolonged period of low growth has brought to the fore the concerns of those who have been left behind. It is important to ensure that everyone has the opportunity to benefit from global economic integration and technological progress.

We reinforce our commitment to achieve strong, sustainable, balanced, inclusive, and job-rich growth. To this end, we will use all policy tools—monetary and fiscal policies, and structural reforms—both individually and collectively. We reaffirm our commitment to communicate policy stances clearly, avoid inward-looking policies, and preserve global financial stability. We recognize that excessive volatility and disorderly movements in exchange rates can have adverse implications for economic and financial stability. We will refrain from competitive devaluations, and will not target our exchange rates for competitive purposes. We will also work together to reduce excessive global imbalances by pursuing appropriate policies. We are working to strengthen the contribution of trade to our economies. Our priorities include:

Accommodative monetary policy: In economies where inflation is still below target and output gaps remain negative, monetary policy should remain accommodative, consistent with central banks’ mandates, mindful of financial stability risks, and underpinned by credible policy frameworks. Monetary policy by itself cannot achieve sustainable and balanced growth, and hence must be accompanied by other supportive policies. Monetary policy normalization, where warranted, should continue to be well-communicated, also to mitigate potential cross-border spillover effects.

Growth-friendly fiscal policy: Fiscal policy should be used flexibly and be growth-friendly, prioritize high-quality investment, and support reforms that boost productivity, provide opportunities for all, and promote inclusiveness, while enhancing resilience and ensuring that public debt as a share of GDP is on a sustainable path.

Tailored, prioritized, and sequenced structural reforms: We will advance structural reforms to lift growth and productivity and enhance resilience, while assisting those bearing the cost of adjustment. The design, prioritization, and sequencing of reforms should reflect country circumstances; aim to boost investments in infrastructure, human capital development, and innovation; promote competition and market entry; and raise employment rates.

Safeguarding financial stability: We will further strengthen the resilience of the financial sector to continue to support growth and development. This requires sustained efforts to address remaining crisis legacies in some advanced economies and vulnerabilities in some emerging market economies, as well as monitoring potential financial risks associated with prolonged low or negative interest rates and with systemic market liquidity shifts. We stress the importance of timely, full, and consistent implementation of the agreed financial sector reform agenda, as well as finalizing remaining elements of the regulatory framework as soon as possible.

A more inclusive global economy: We will implement policies that promote opportunities for all within our countries, sustainability over time, and cooperation across countries. We will implement domestic policies that develop an adaptable and skilled workforce, assist those adversely affected by technological progress and economic integration, and work together to ensure that future generations are not left to pay for the actions of the current one. Recognizing that every country benefits from cooperation through a collaborative framework that evolves to meet the changing needs of the global economy, we will work to tackle common challenges, support efforts toward the 2030 Sustainable Development Goals (SDGs), and ensure the orderly functioning of the international monetary system (IMS). We will support countries dealing with the consequences of conflicts, refugee and humanitarian crises, or natural disasters. We will work to promote a level playing field in international trade and taxation; tackle the sources and channels of terrorist financing, corruption, and other illicit financial flows; and address correspondent banking relationship withdrawal.

Watch the press conference here.

IMF More Bullish On Global Financial Stability

The IMF Transcript of the release of the April 2017 Global Financial Stability Report suggests that global financial stability has improved in the last six months. They say global growth could strengthen, and deflation risks could continue to fade. This would benefit emerging markets and advanced economies alike, even as interest rates and monetary policies normalize. [DFA Note – more upward pressure on mortgage rates!]

However, the IMF warns that failing to get the policy mix right could reverse market optimism.

As Maury Obstfeld explained yesterday at the release of the World Economic Outlook, economic activity has gained momentum. We have greater confidence in the outlook. Hopes for reflation have risen. Monetary and financial conditions remain highly accommodative. Investor optimism over the new policies under discussion has boosted asset prices.

But failing to get the policy mix right could reverse market optimism. It could also ignite new downside risks to financial stability. In the United States, policies could increase fiscal imbalances and could push up interest rates and global risk premia. A shift toward protectionism globally could drag down trade and growth, triggering capital outflows from emerging markets.

The loss of global cooperation on regulatory reforms could reverse some of the gains that have made financial systems safer. Markets expect these adverse developments will be avoided and policymakers will implement the right mix of policies. In the United States, this means policies that will invigorate corporate investment. In emerging markets, this means addressing domestic and external imbalances to enhance resilience to external shocks. Finally, in Europe, this means that policies will have to strengthen the outlook for banks by tackling the structural causes of weak profitability. That is why the focus of this report is on “Getting the policy mix right”.

Let me now turn to the key policy questions. First, can the corporate sector in the United States support a safe economic expansion? Investment spending has been languishing for over 15 years now. Recently, discussions of corporate tax reform, infrastructure spending, and reductions in regulatory burdens have boosted confidence. This could herald a much‑needed rebound in investment to build for the future.

The good news is that many firms have the capacity for capital expenditures. Increased cash flows from corporate tax reform could bring about increased investment. This would be welcome rather than financial risk taking, such as the acquisition of financial assets and using debt to pay out shareholders. The bad news is that sectors accounting for almost half of U.S. investment—namely, energy, utilities, and real estate—are already highly levered. This means that expanding investment, even with tax relief, could increase already elevated debt levels.

Why is this a problem? A sharp rise in interest rates—for example, owing to increased financial imbalances—could push corporate debt servicing capacity to its weakest level since the crisis. Under such a scenario, corporates with some $4 trillion of assets may find servicing their debt challenging. This is almost a quarter of the assets we capture in our analysis.

In an integrated world, what happens in advanced economies has repercussions for emerging markets. We all remember the taper tantrum in 2013, when interests rose sharply and emerging markets suffered badly. Is this time different? With the right policy mix, it can be.

Global growth could strengthen, and deflation risks could continue to fade. This would benefit emerging markets and advanced economies alike, even as interest rates and monetary policies normalize. So far, we have been on this good path. But emerging market economies could face trying times. In fact, political and policy uncertainty in advanced economies opens new channels for negative spillovers.

A sudden reversal of market sentiment could reignite capital outflows and hurt growth prospects, as could a global shift toward protectionism. We estimate that debt held by the weakest firms in emerging markets could rise to $230 billion under such a scenario. In turn, banks in some countries would need to rebuild their buffers of capital and provisions. Those are the banks that are already experiencing a decline in asset quality after a long credit boom.

China is a key contributor to global growth but has also notable vulnerabilities. Credit in relation to China’s economy has more than doubled in less than a decade, to over 200 percent. Credit booms this big can be dangerous. The longer booms last and the larger credit grows, the more dangerous they become. The Chinese authorities continue to adjust policies to limit the growth of the banking and shadow banking systems, but more needs to be done to slow credit growth and reduce vulnerabilities. The authorities’ progress and success are essential for global financial stability.

Turning to Europe, policymakers need to make further progress in addressing structural impediments to profitability in the banking system. Significant advances have already been made. European banks hold higher levels of capital, regulations have been strengthened, and supervision has been enhanced. Over the past six months, bank equity prices have risen as yield curves steepened and the economic recovery has firmed.

But this is not the end of the story. As we established in the last GFSR, a cyclical recovery is unlikely to fully resolve the profitability challenge that many banks face. Why is this important? Weak profitability limit the banks’ ability to retain capital, thus constraining their ability to weather shocks and increasing risks to financial stability.

In this GFSR, we examine many European banks, representing $35 trillion of assets. We divide them into three groups: global, European‑focused, and domestic. Domestic banks face the greatest profitability challenges, with almost three quarters of them having very weak returns in 2016. This analysis suggests that the domestic operating environment for banks plays a significant role.

While no single structural factor clearly explains chronic low profitability, overbanking is a common challenge. Overbanking takes many different forms: for example, weak banks with low buffers, too many banks with a regional focus or narrow mandate, or too many branches and low branch efficiency. Measures are being taken to address these concerns, but countries with the biggest challenges need to make more progress. Otherwise, low profitability could impede the recovery or, worse, reignite systemic risks.

Let me sum up. What does it take to get the policy mix right? US policy proposals should aim to increase economic growth but should also avoid creating fiscal imbalances and negative global spillovers. Healthy corporate balance sheets will be essential to facilitate an increase in productive investment. Policymakers should preemptively address areas in which risk‑taking appears excessive.

Emerging market policymakers should address their external and domestic imbalances. That includes improving corporate restructuring mechanisms, monitoring corporate vulnerabilities, and ensuring that banks have healthy buffers. In Europe, more comprehensive efforts are needed to address banking system and bank business model challenges. The authorities should focus on removing system‑wide impediments to profitability. Such measures should include promoting bank consolidation and branch rationalization, reforming bank business models, and addressing nonperforming loans.

At the global level, successful completion of the Regulatory Reform Agenda is vital. It relies on continued multilateral cooperation and coordination. Completing the Reform Agenda, especially the adoption of the Basel III enhancements, will ensure that the global financial system is safe and can continue to promote economic activity and growth.

Designed For Growth

From iMFdirect.

Productivity drives our living standards. In our April 2017 Fiscal Monitor, we show that countries can raise productivity by improving the design of their tax system, which includes both policies and administration. This would allow business reasons, not tax ones, to drive firms’ investment and employment decisions.

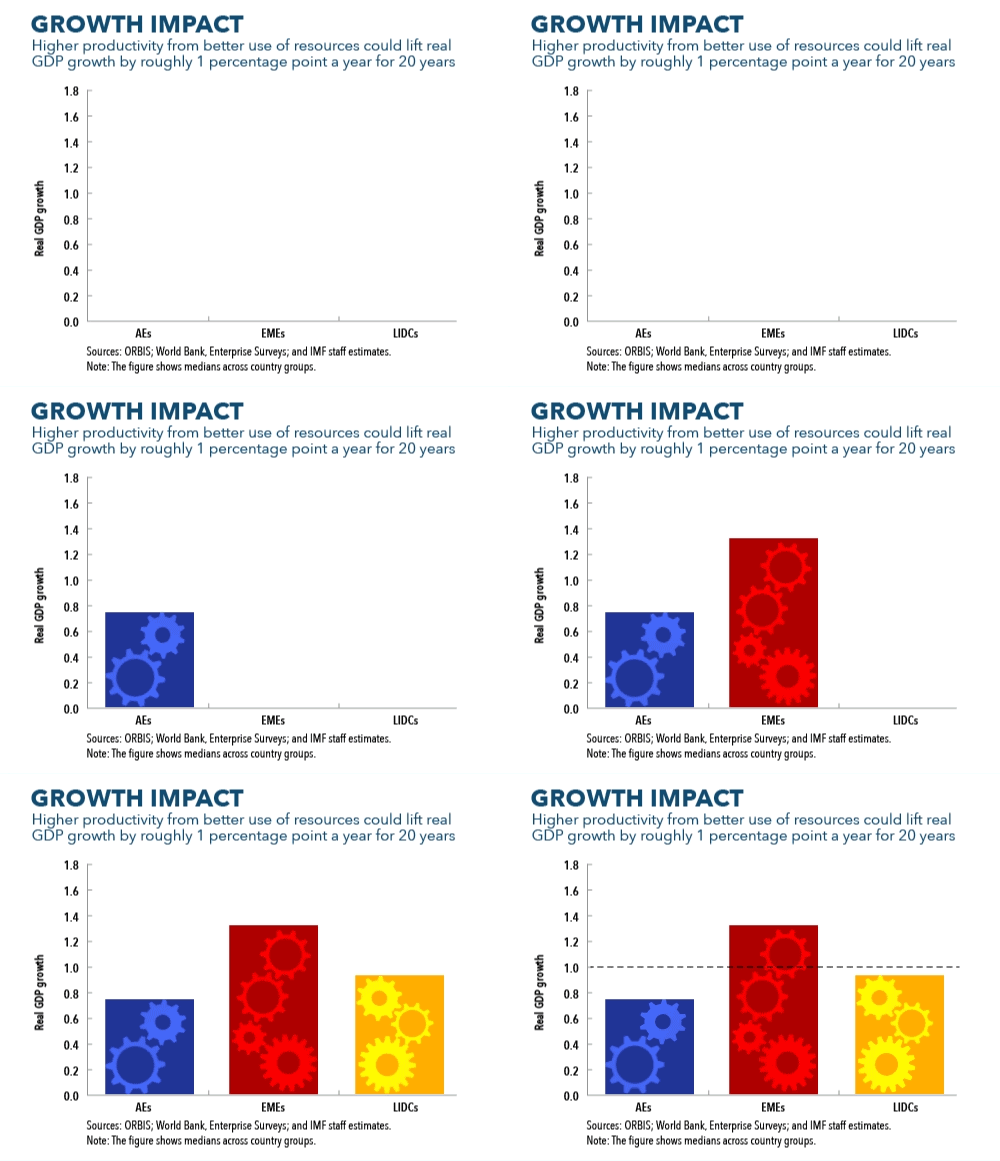
Countries can substantially increase productivity by eliminating barriers that hold more productive firms back. These barriers include badly designed economic policies, or markets that do not function as they should. We estimate that eliminating such barriers would, on average across countries, lift annual real GDP growth rates by roughly 1 percentage point over 20 years. We also find that emerging market and low-income countries can achieve one quarter of these gains by improving the design of their tax policies and revenue administrations.

Chapter2_Chart1_GrowthImpact_NoFooter (002)

Doing more with the same

Countries can increase productivity by tackling the barriers that give rise to poor use of existing resources within countries—resource misallocation. Such barriers prevent productive firms from expanding and allow unproductive ones to survive.

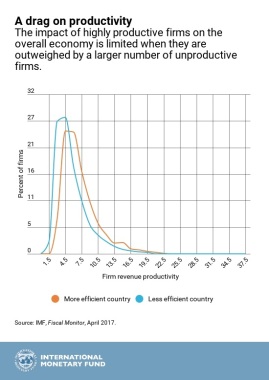
When comparing a less efficient country with another closer to the world’s productivity frontier, the contrast is stark. As the figure below illustrates, the less efficient country does have several highly productive firms. The main difference stems from the fact that the less efficient country has many more unproductive firms.

ENG_Apr_10_fiscal_monitor_2

How can a better allocation of resources across firms raise productivity?

Imagine two firms that produce software, with identical technologies but different behavior towards taxation. Because of a weak tax administration, one firm avoids detection by the tax authority and doesn’t pay taxes, therefore facing a lower user cost of capital. The other firm is tax-compliant due to greater scrutiny from the tax authority, therefore facing a higher user cost of capital. The difference in user cost means that the tax-evading firm can afford to undertake investments in lower-return projects, while the fully taxed firm can only undertake investments in higher-return projects. In this example, aggregate output would be higher if capital were to move from the untaxed firm to the fully taxed firm, allowing for more investment in higher-return projects.

How governments tax matters for productivity

What drives the misallocation of resources? Misallocation arises when government policies or poorly functioning markets favor some firms over others. Examples include tax incentives that depend on firm size or type of investment, weak tax enforcement, tariffs applied to particular goods, product market regulations that limit market access, preferential loans granted to specific firms, and financial markets that are not fully developed. Tackling all these policies and practices is very complex.

The Fiscal Monitor explores a selection of tax policies that discriminate against firms in different ways, giving rise to resource misallocation. In this blog, we focus on one: tax evasion. This example is especially relevant for emerging market and low-income developing countries. It illustrates clearly that a weak tax administration not only hurts revenue collection, but it also hurts productivity.

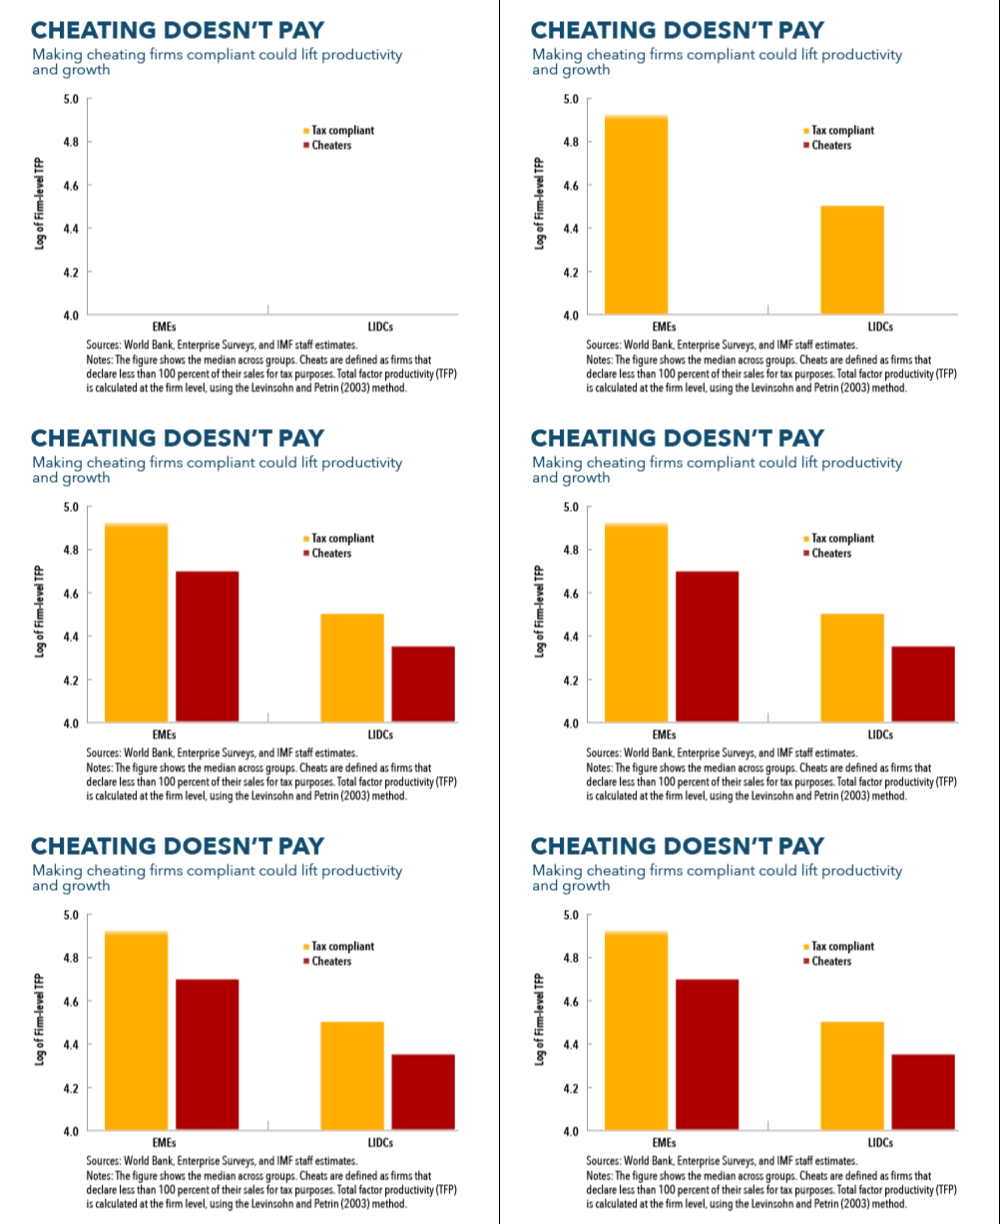
Through tax evasion, “cheats”—by which we refer to firms that are registered with the tax authority but underreport their sales for tax purposes—enjoy a potentially large implicit subsidy that allows them to stay in business despite low productivity. As a result, “cheats” gain market share even if they are less productive, reducing the market share of more productive, tax compliant businesses.

Chapter2_Chart2_Cheating_NoFooter (002)

Our empirical results show that a stronger tax administration reduces the prevalence of cheats. By getting rid of the implicit subsidy, the less productive “cheats”, unable to compete, will go out of business. This makes room for productive, tax-compliant firms to gain market share and absorb greater amounts of labor and capital, raising aggregate productivity.

Our estimates show that in emerging market and low income developing countries, closing the productivity gap between tax compliant firms and cheats would add ½ to 1 percentage points to aggregate productivity.

All countries have much to gain from removing the policies and practices that prevent resources from going to where they are most productive. Upgrading the tax system can play an important part.

Drivers of Declining Labor Share of Income

From iMFdirect.

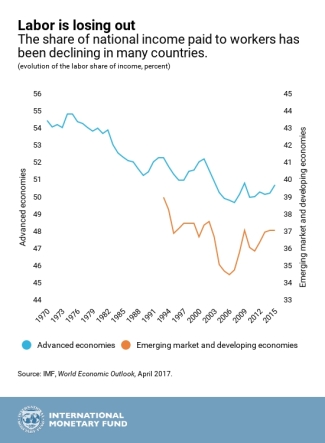
After being largely stable in many countries for decades, the share of national income paid to workers has been falling since the 1980s. Chapter 3 of the April 2017 World Economic Outlook finds that this trend is driven by rapid progress in technology and global integration.

IMF.WEOChap3.Apr2017_chart1

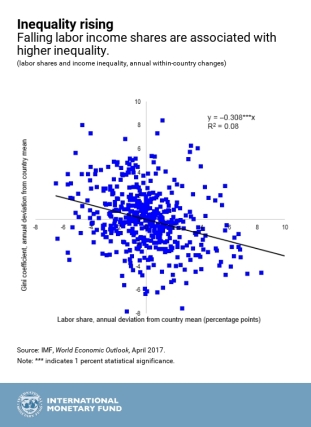
Labor’s share of income declines when wages grow more slowly than productivity, or the amount of output per hour of work. The result is that a growing fraction of productivity gains has been going to capital. And since capital tends to be concentrated in the upper ends of the income distribution, falling labor income shares are likely to raise income inequality.IMF.WEOChap3.Apr2017_chart2.jpg

Trending down

In advanced economies, labor income shares began trending down in the 1980s. They reached their lowest level of the past half century just prior to the global financial crisis of 2008, and have not recovered materially since. Labor income shares now are almost 4 percentage points lower than they were in 1970.

Despite more limited data, labor shares have also declined in emerging market and developing economies since the early 1990s. This is especially the case for the larger economies in this group. In China, for example, despite impressive gains in poverty reduction over the past two decades, labor shares still fell by almost 3 percentage points.

Indeed, as growth remains subpar in many countries, an increasing recognition that the gains from growth have not been broadly shared has strengthened a backlash against economic integration and bolstered support in favor of inward-looking policies. This is especially the case in several advanced economies.

Our study takes an in-depth look at the symptoms and drivers of this downward trend in labor share of income.

Technology: a key driver in advanced economies

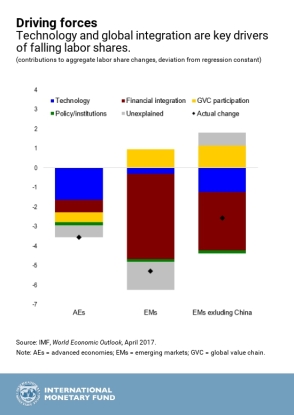
In advanced economies, about half of the decline in labor shares can be traced to the impact of technology. The decline was driven by a combination of rapid progress in information and telecommunication technology, and a high share of occupations that could be easily be automated.

IMF.WEOChap3.Apr2017_chart3

Global integration—as captured by trends in final goods trade, participation in global value chains, and foreign direct investment—also played a role. Its contribution is estimated at about half that of technology. Because participation in global value chains typically implies offshoring of labor-intensive tasks, the effect of integration is to lower labor shares in tradable sectors.

Admittedly, it is difficult to cleanly separate the impact of technology from global integration, or from policies and reforms. Yet the results for advanced economies is compelling. Taken together, technology and global integration explain close to 75 percent of the decline in labor shares in Germany and Italy, and close to 50 percent in the United States.

Global integration: largely benign in emerging market economies

In emerging markets and developing economies, global integration has allowed for expanded access to capital and technology and, by raising productivity and growth, has led to a rise in living standards and lifted millions from poverty.

However, these forces may also be associated with declining labor income shares, by shifting the production in emerging market and developing economies towards more capital-intensive activities. We find that global integration, and more specifically participation in global value chains, was the key driver of declines in labor shares in emerging markets.

This effect could, however, be interpreted as benign: it is the result of capital deepening that is not necessarily accompanied by dislocation of employment or reduction in wages.  In Turkey, for example, the decline in labor income share of around 5 percentage points is explained almost exclusively by the rapid rise in participation in global value chains.

Technology, in contrast, has played a small role in these economies. This reflects a smaller decline in the relative price of investment goods as well as a lower share of automatable jobs.

Hollowing out of the middle-skilled labor share

Another key finding of our research is that the decline in labor shares in advanced economies has been particularly sharp for middle-skilled labor. Routine-biased technology has taken over many of the tasks performed by these workers, contributing to job polarization toward high-skilled and low-skilled occupations.

This “hollowing-out” phenomenon has been reinforced by global integration, as firms in advanced economies increasingly have access to a global labor supply through cross-border value chains.

Dealing with disruption

We conclude that although technological advancement and global economic integration have been key drivers of global prosperity, their effects on labor shares challenge policymakers to find ways to spread those benefits more broadly. The design of specific policy responses, of course, will have to depend on country circumstances and be anchored in their social contracts.

With Global Financial Markets, How Much Control Do Countries Have Over Economic Policies?

From iMFdirect.

The outlook for further interest-rate increases by the US Federal Reserve revives interest in a compelling question: In an increasingly integrated global financial system, how much control do countries outside of the US retain over their economic policies? 

For policymakers around the world, the question is more than academic. Their concern:

Global events have such a large impact on financial markets that there’s little scope left to pursue their own objectives, such as full employment or low inflation.

Unwelcome development

Here’s a simple example of why that’s the case. A decision by the Fed to raise interest rates increases yields on US assets, attracting capital from other countries. As a result, interest rates in those countries may go up, making it harder for consumers and companies to obtain the credit they need to buy more goods or invest in new machinery. That could be an unwelcome development in a country that is trying to keep borrowing costs low to combat unemployment, for example, or sustain economic growth.

To find out how much freedom central banks still have to pursue their own policy objectives, the latest IMF Global Financial Stability Report develops indexes that measure changes in financial conditions in a broad array of advanced and developing economies. Financial conditions refer to how easy or difficult it is to borrow money, and they can be influenced by bond prices and exchange rates. A measure of those conditions is a useful tool for assessing the likely impact of policy decisions.

IMF.GFSRch3-Apr2017.chart


Financial shocks

Our indexes show that global events account for between 20 percent and 40 percent of local conditions across countries, leaving policymakers considerable scope for action. And even as financial markets have become more integrated, the degree of control countries exert over domestic conditions has only diminished mildly over the past two decades. Still, the rapid speed and the strength by which external financial shocks tend to affect local markets often makes it difficult for policymakers to react in a timely and effective manner.

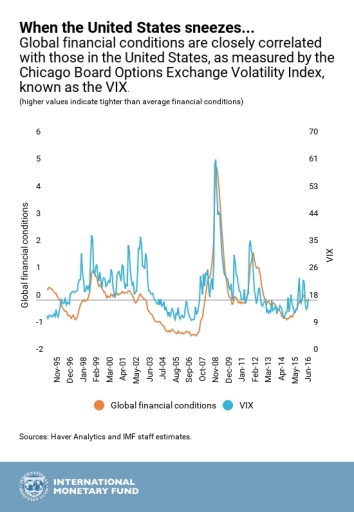
Global conditions appear to be strongly driven by the United States, in part because the dollar is the predominant currency in international transactions. We found that the global financial conditions index correlates strongly with those in the United States and with the Chicago Board Options Exchange Volatility Index, or VIX, a gauge of perceived risk in US equities.

Emerging markets, which are more sensitive to global conditions than advanced economies, should take steps to bolster their resilience to global shocks. They should deepen domestic financial markets and develop a local investor base, making their markets less susceptible to fluctuations in flows of money across borders.

Such steps are particularly important now, when financial conditions are tightening in response to the Fed’s rate hike.

The IMF will release more analysis from the Global Financial Stability Report on April 19.

Slowing Productivity: Why It Matters and What To Do

From The IMFBlog.

Output per worker and total factor productivity have slowed sharply over the past decade in most advanced economies and many emerging and developing countries.

Even before the global financial crisis, productivity growth showed signs of slowing in many advanced economies. But in the aftermath of the crisis, there was a further, abrupt deceleration.

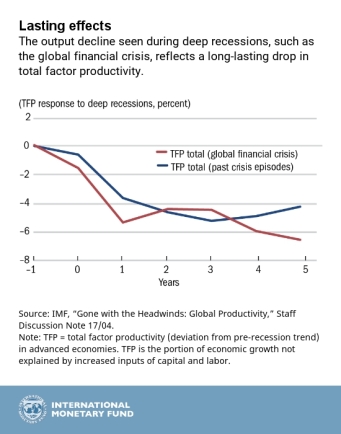
Unlike normal economic slowdowns, deep recessions leave long-lasting scars on total factor productivity, as this chart shows. The global financial crisis was no different.

IMF.Productivity_chart

Consider, for example, the impact of the credit crunch on advanced economy firms that had entered the crisis with high levels of debt. These companies were often forced into fire sales of assets and deep cuts in investment, including in innovation—with lasting effects on their own and aggregate productivity.

Subdued productivity is a cause for concern, according to a new IMF paper. Another decade of weak productivity growth could seriously threaten progress in raising global living standards. Slower growth would also make it more difficult to sustain existing private and public debt levels in some countries—which could jeopardize their financial stability.

Moving the productivity needle should be a policy priority.

For advanced economies, this starts with boosting demand and investment where it remains weak; helping firms restructure debt and strengthen bank balance sheets; and giving clear signals about future economic policy, in particular fiscal, regulatory, and trade policies.

Structural reforms are also needed to tackle the structural headwinds that will constrain productivity growth—aging, the global trade slowdown, and slowing improvements in educational attainment.

Read about slowing productivity and what can be done about it in this new IMF paper.

You can also read the speech by the IMF Managing Director Christine Lagarde on “Reinvigorating Productivity Growth.”

Union of Labor and Growth

From The IMFBlog.

John Evans is Head of the Trade Union Advisory Committee to the Organisation for Economic Cooperation and Development, which represents some 65 million organized workers worldwide. In this podcast, he says that the labor market works much like any other market, driven by supply and demand, and the latter is very dependent on how well the economy is doing.

“On the demand side, the labor markets globally haven’t fully recovered from the Great Recession after the [U.S. investment bank] Lehman Brothers crash in 2008. We still have 200 million people unemployed. We still have very sluggish growth. On the income side, what we’ve seen globally, but particularly in certain countries, is a generalized rise to greater inequality of labor incomes in the last 30 to 35 years.”

Is this only a problem for developing countries?

“I think it affects everyone,” says Evans. “The Gini coefficient increased very significantly in some of the industrialized countries. The post-World War II years was a period of falling income inequality, whereas now we’ve seen a jump back to some of the levels that existed in the 1920s.”

Evans says the IMF’s analysis of advanced economies shows that half the increase in inequality between the top decile and bottom decile is due to weaker unions and declining unionization. As such, there’s a strong case for advocating more broadly-based inclusive growth, which is what most institutions now say is their key policy.

“Sixty percent of people globally work outside formal employment. So, how the labor market institutions re-attach them to the labor force is crucially important.”

While technology is transforming the labor force, Evans says technology will have less impact in the short term on increasing jobs, but more impact on the quality of work, and potentially on income distribution.

“If we look at past waves of technological change in different countries—trying to make sure workers have new skills, that there are policies to help them move to new jobs, and that they have a sense of security and protection in that change process—it’s sometimes been managed well, and sometimes badly. But it’s certainly a feature of history.”

Evans believes governments are looking at labor markets as crucial to delivering jobs and reducing inequality. Research by institutions like the IMF and World Bank has found new results about labor markets, and policymakers are listening. “The models we’ve seen in some countries of good social dialogue, social partnerships, and high levels of trust between both management and workers and their unions, and also a recognition of that by governments, is making the process better.”

Listen to the podcast

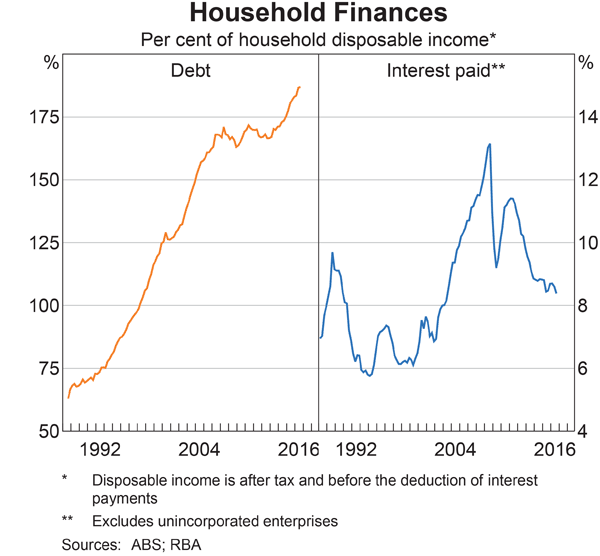
The High Household Debt Hangover

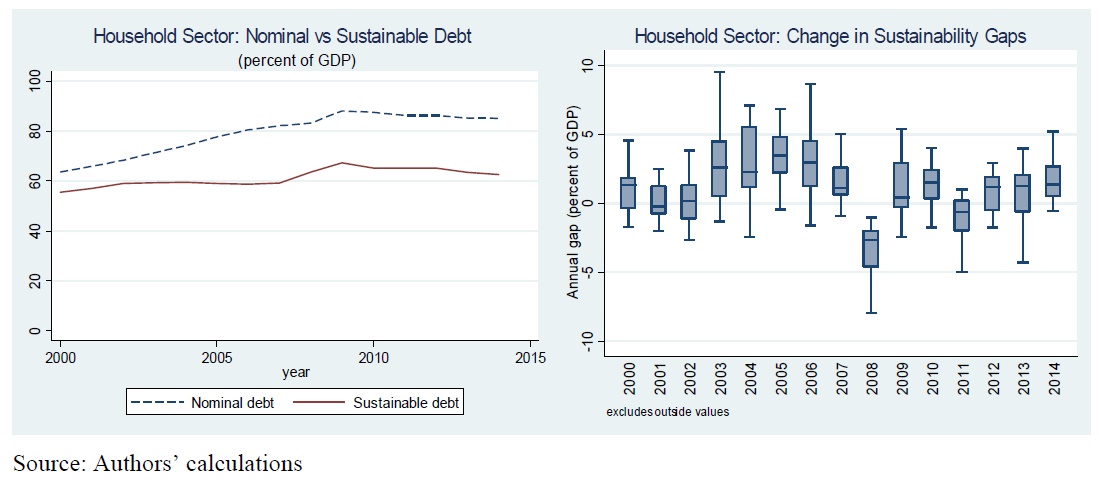
A new IMF working paper “Excessive Private Sector Leverage and Its Drivers: Evidence from Advanced Economies“, aims to provide a quantitative assessment of the gaps between actual and sustainable levels of debt and identifies the key factors that drive excessive borrowing.

They explain why high household debt – such as we have in Australia – should be a cause for concern. It seems to sum up the current state of play here, very well.

High private debt can have a substantial adverse impact on macroeconomic performance and stability. It hinders the ability of households to smooth consumption and affects investment of corporations. In addition, elevated debt levels can create vulnerabilities as well as amplify and transmit macroeconomic and asset price shocks throughout the economy. Excessive private debt increases the likelihood of a financial crisis, especially when it is driven by asset price bubbles fueled by lending. The subsequent deleveraging could be potentially disruptive for economic activity.

Long-term growth prospects deteriorate significantly following debt-related financial crises. Furthermore, the accelerated pace of private debt accumulation can lead to economic and financial instability, which often coincides with great risk-taking and poorly regulated and supervised financial sector. Finally, spillovers from private balance sheets to the public sector due to government interventions, either direct in the form of targeted programs for debt restructuring or indirect through the banking sector, weaken the fiscal position and increase interest rates. All the above factors may potentially compromise public debt sustainability.

They assess the extent of excessive leverage in advanced economies, and conclude that private sector debt overhang is relatively large, with significant heterogeneity across developed economies. Household excessive leverage is found to be higher in countries with lower interest rates and higher share of working population, but importantly also in countries with rising house prices and greater uncertainty as captured by unemployment. Corporate debt overhang is estimated to be higher in countries with lower profitability, stronger insolvency frameworks and absence of thin capitalization rules.

In assessing the situation, they make the point that using debt to income ratios alone, omits an important aspect of debt sustainability – the strength of the borrower’s balance sheet. Debt can be repaid not only from future income but also by selling assets; hence, solvency indicators, such as the debt to asset ratio, are widely used in debt sustainability analyses.

They apply a “deflated” approach to assessing debt, starting from a base year, and compare the subsequent growth. The sum of deflated financial and non-financial assets represents total notional assets. Similar to financial assets, deflated debt is obtained by adding debt transactions to the initial stock of debt. Deflated sustainable debt is then calculated as deflated debt in the initial year, increased by the change in notional assets and corrected for transitory changes in the nominal debt-to-asset ratio (which is assumed stationary). In other words, deflated debt is considered sustainable when it evolves with deflated assets. Excessive leverage is measured by the difference between the actual and sustainable debt.

The results from our empirical analysis suggest that in a number of advanced economies household and corporate debt has increased to levels that may not be sustainable. Most of the debt build-up took place before the financial crisis, but with a few exceptions, there has been little deleveraging in the post-crisis period. In a number of countries, the gap between actual and sustainable debt, calculated on the basis of notional assets continues to grow. The gaps are larger in the household sector; the borrowing behavior of non-financial corporations does not seem to have changed much on aggregate, although there is significant cross-country
heterogeneity.

Drawing on the theoretical literature on household and corporate debt determinants and building on earlier empirical work, we try to identify the main drivers of excessive leverage. Most of the variables that have been found important in previous studies focusing on indebtedness, turn out to be significant in explaining the debt sustainability gaps as well. In particular, low interest rates and unemployment along with high house prices tend to be associated with larger gaps in the case of household. This implies that policymakers should pay attention to excessively low interest rates and inflated house prices to avoid imbalances that may ultimately pose risks to macroeconomic stability. While we find evidence for importance of institutions, the tax treatment of mortgage debt does not appear to be significant, although the latter could be due to difficult measurement issues. Still, this does not mean that there is no role for policies in containing leverage. For example, generous mortgage-related tax incentives that favor ownership over renting can induce excessive borrowing by households and boost asset prices which, as discussed above, are positively correlated with the sustainability gaps. Furthermore, such incentives have important distributional implications and can be costly in terms of foregone revenue for the budget.

In the case of non-financial corporations, profitability is a significant factor behind leveraging, while thin capitalization rules tend to reduce the debt overhang. Thin capitalization rules can be an effective instrument to limit excessive borrowing but they need to be well designed. In many countries such rules provide escape clauses that effectively limit them to related party debt, implying that these measures aim to reduce debt shifting, but do not deal effectively with the debt bias. Introducing a tax system based on allowance for corporate equity (ACE) would not only reduce the incentives to incur debt but would also stimulate investment as it is effectively a tax only on excess returns or rents. There is also some role for institutions because countries with stronger insolvency  regimes are typically characterized by lower debt overhang.


Note: IMF Working Papers describe research in progress by the author(s) and are published to elicit comments and to encourage debate. The views expressed in IMF Working Papers are those of the author(s) and do not necessarily represent the views of the IMF, its Executive Board, or IMF management.

Global House Prices—Where is the Boom?

From iMFdirect.

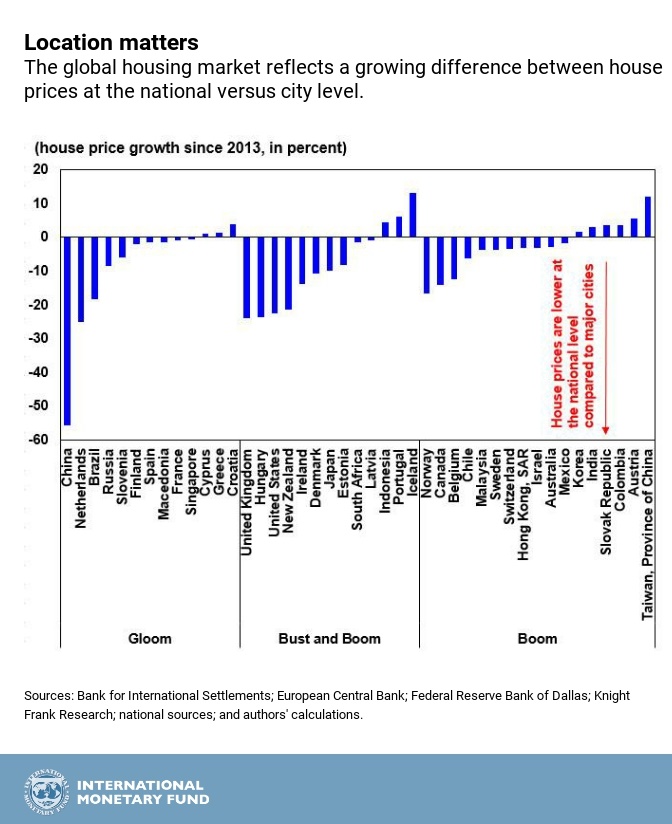
While house prices around the world have rebounded over the last four years, a closer look reveals that this uptick is dependent on three things: location, location, location.

The IMF’s Global House Price Index—an average of real house prices across countries—has been rising for the past four years. However, house prices are not rising in every country. As noted in our November 2016 Quarterly Update, house price developments in the countries that make up the index fall into three clusters: gloom, bust and boom, and boom.

The first cluster—gloom—consists of countries in which house prices fell substantially at the onset of the Great Recession, and have remained on a downward path.

The second cluster—bust and boom—consists of countries in which housing markets have rebounded since 2013 after falling sharply during 2007–12.

The third cluster—boom—consists of countries in which the drop in house prices in 2007–12 was quite modest, and was followed by a quick rebound.

This chart shows that house prices varies within a cluster and within a country. Recent IMF assessments provide a more nuanced view of the within-country house price developments.

For example, in Australia, the strongest house price increases continue to be recorded in Sydney and Melbourne, where underlying demand for housing remains strong.

In Austria, the cumulative increase in the house price index over 2007–2015 was nearly 40 percent. To a large extent, this increase was driven by price dynamics in Vienna.

Looking at Turkey, the housing market exhibits significant variations across cities. Regional variations have been further accentuated by the presence of almost 3 million Syrian refugees since March 2011. Cities near the Syrian border, which have absorbed larger masses of Syrian refugees, have seen significant rises in local housing prices since 2011, though they have moderated in recent years.


Country/region and city clusters

Gloom = Brazil (Rio de Janeiro); China (Shanghai); Croatia (Zagreb); Cyprus (Nicosia); Finland (Helsinki); France (Paris); Greece (Athens); Macedonia (Skopje); Netherlands (Amsterdam); Russia (Moscow); Singapore (Singapore); Slovenia (Ljubljana); and Spain (Madrid).

Bust and Boom = Denmark (Copenhagen); Estonia (Tallinn); Hungary (Budapest); Iceland (Reykjavik); Indonesia (Jakarta); Ireland (Dublin); Japan (Tokyo); Latvia (Riga); New Zealand (Auckland); Portugal (Lisbon); South Africa (Johannesburg); United Kingdom (London); and United States (San Francisco).

Boom = Australia (Melbourne); Austria (Vienna); Belgium (Brussels); Canada (Toronto); Chile (Santiago); Colombia (Bogota); Hong Kong, SAR (Hong Kong); India (New Delhi); Israel (Tel Aviv); Korea (Seoul); Malaysia (Kuala Lumpur); Mexico (Mexico City); Norway (Oslo); Slovakia (Bratislava); Sweden (Stockholm); Switzerland (Zurich); and Taiwan, Province of China (Taipei City).

Read more on IMF global house price studies and check out the Global Housing Watch site.