A Softer New Year for New Home Sales

The first key new housing update for 2017 provides a softer update, said the Housing Industry Association.

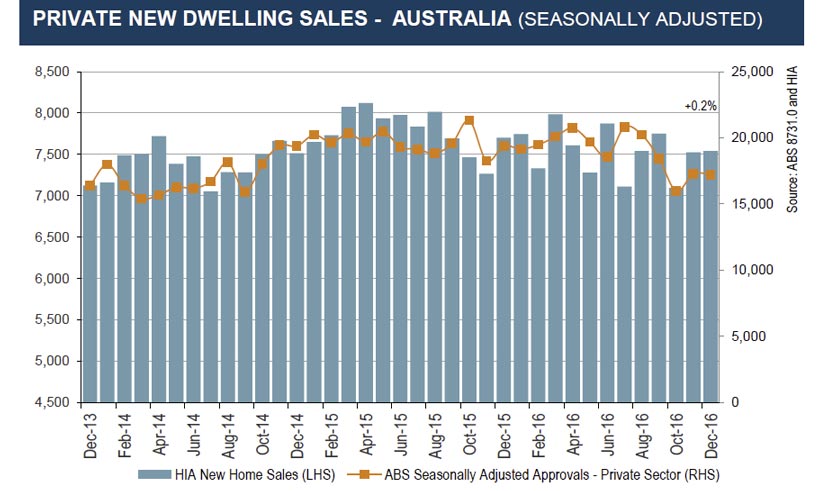
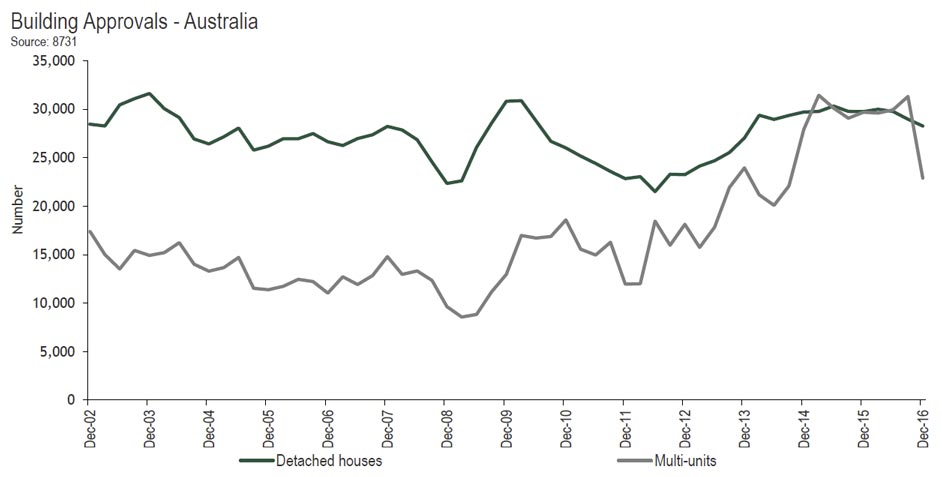
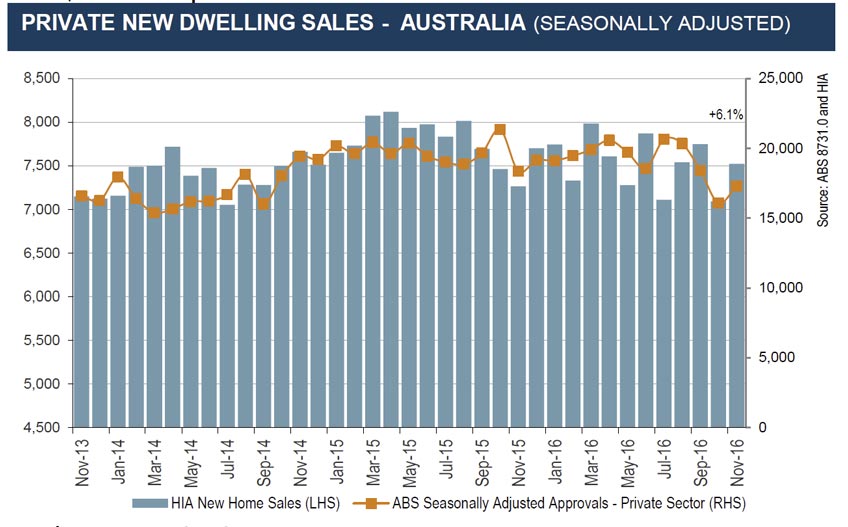
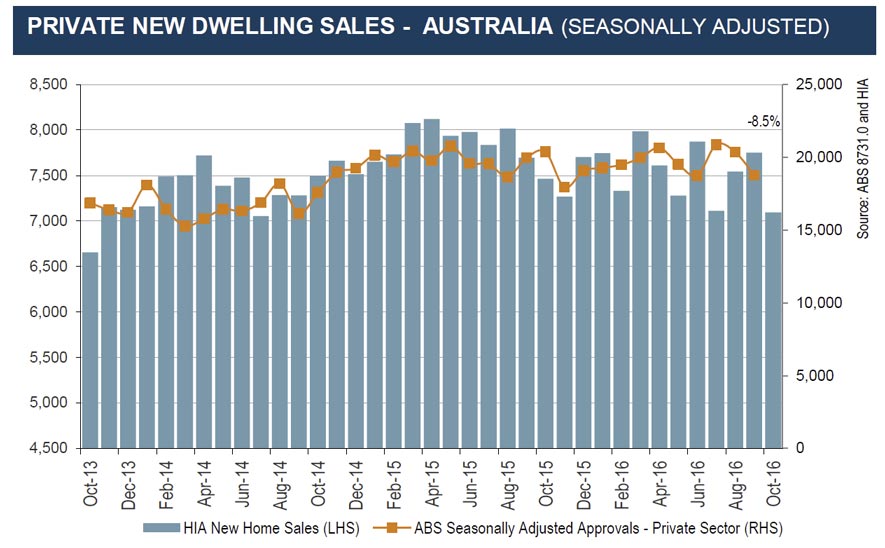
The January 2017 update for the HIA’s monthly New Home Sales survey reveals a decline of 1.5 per cent in detached house sales following a similar fall of 1.6 per cent in December last year. Detached house sales fell by a very modest 1.1 per cent over the three months to January 2017 to be down by 4.0 per cent when compared to the same period 12 months previously. The sale of ‘multi-units’ dropped by 4.3 per cent in January following an increase of 6.4 per cent in December 2016. Over the three months to January 2017 multi-unit sales increased by 4.8 per cent to a level 9.0 per cent higher than the comparable period a year earlier.

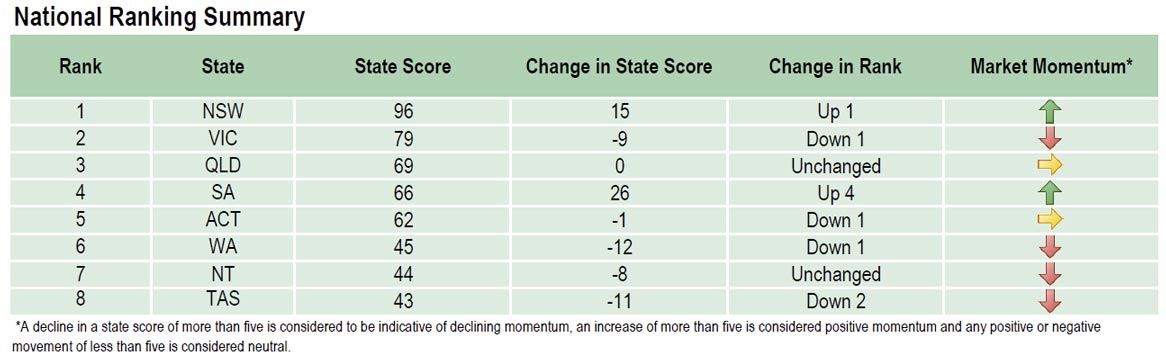
Seasonally adjusted new detached house sales increased by 12.1 per cent in Western Australia in January 2017 following a sharp dip of 9.1 per cent last December. In the month of January 2017 detached house sales fell by 6.8 per cent in New South Wales, 4.1 per cent in Victoria, 2.0 per cent in Queensland, and 1.4 per cent in South Australia.

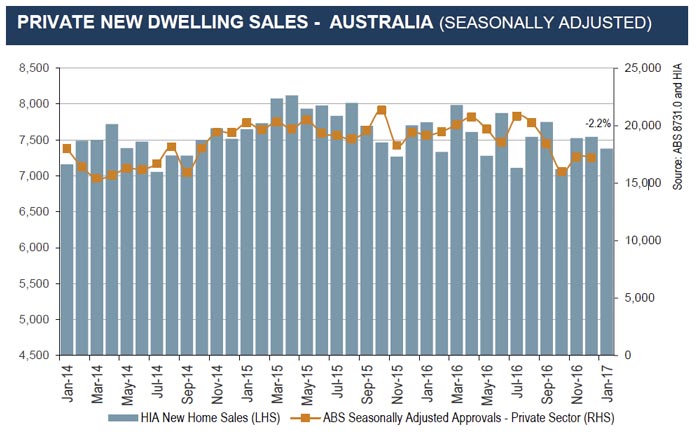
“The HIA New Homes Sales Report – a survey of Australia’s largest home builders showed a moderate decline of 2.2 per cent in January 2017,” said HIA Chief Economist, Dr Harley Dale. “This weaker update does follow a relatively decent run home for new home sales in late 2016.”

“Given that Australia is tailing off from the largest and longest new home building cycle in history, both the total and sub-component profiles for new home sales are still in very good shape,” said Harley Dale.

“There aren’t many sectors punching above their weight in the nation’s economy right now, so the profile for new home sales is also good news for Australia as a whole.”

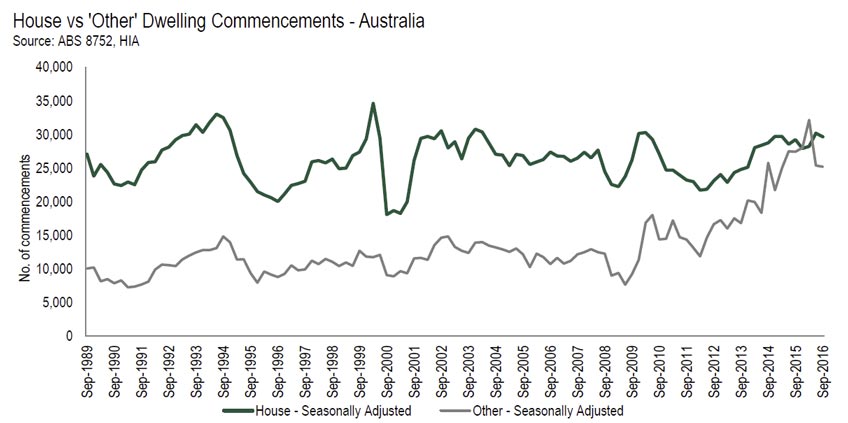
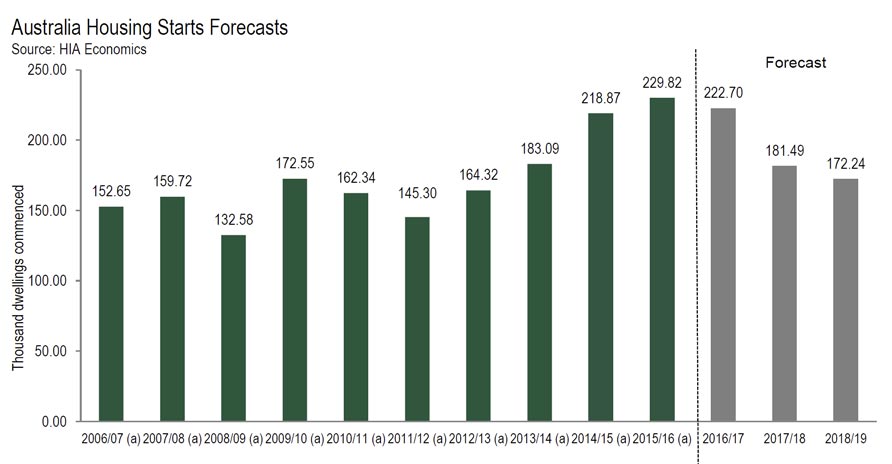
“HIA’s latest forecasts for new dwelling commencements will be released on Thursday and they will paint a healthy short term picture for residential construction. There is nothing to be seen in this latest update for new home sales or from any other recent leading indicator results to deter us from this outlook,” concluded Harley Dale.


Land Sales Recover, as prices rise

Residential land sales increased for the second consecutive quarter as prices reached a new high during the three months to September 2016 according to the latest HIA-CoreLogic Residential Land Report published today by Housing Industry Association and CoreLogic.

Today’s HIA-CoreLogic Residential Land Report shows that the land lot price nationally rose by 3.3 per cent during the September 2016 quarter to another record high of $243,585. During the quarter, 18,510 land lot transactions are estimated to have occurred across Australia, 6.4 per cent higher than the previous quarter but 7.3 per cent lower than a year earlier. During the six months to September 2016, land transactions experienced the largest increase in Perth (+5.5 per cent) compared with the same period year earlier. Land turnover also increased in Hobart (+2.1 per cent) over the same period. Land sales saw the largest reduction in Sydney (-29.9 per cent) over the same period. Turnover also fell back in Melbourne (-13.5 per cent), Adelaide (-5.1 per cent) and Brisbane (-3.3 per cent).

“During the September 2016 quarter, the volume of land sales increased by 1,121 lots compared with the June 2016 quarter,” said HIA Senior Economist, Shane Garrett.

“However, the number and size of government taxes, fees, levies and charges on new residential land needed to accommodate our growing population continues to weigh down on our national housing affordability challenges,” explained Shane Garrett.

“In addition to removing the excessive taxes on new land, long term commitment from all levels government in the areas of planning, land release and infrastructure funding is necessary.”

“Price pressures in the residential land market are greatest in the capital cities, with Sydney prices now approaching $1,000 per square metre,” concluded Shane Garrett.

According to CoreLogic research director Tim Lawless, “with median land prices rising consistently since mid-2013 it is clear that one of the primary drivers of broader housing market growth has been the underlying appreciation of land values, which is pushing the overall value of housing higher. The median dollar value per square metre of vacant land was recorded at $927 in Sydney, which is 32 per cent higher than the next most expensive capital city, which is Perth where the rate per square metre is $701. The high land costs are a significant contributor to the unaffordability of housing across Australia’s largest capital city.”

“With housing affordability one of the most topical housing market issues, the underlying drivers of high land costs need further scrutiny. Government policies around land release and headworks costs are central to the debate around housing affordability and the cost of vacant land,” continued Tim Lawless.

“The trend towards a larger number of land sales over the September and June quarters of last year is very welcome, however land sales remain more than 7 per cent lower than their previous 2015 peak. With capital city transactions rising by almost 10 per cent over the September quarter compared with a 1.1 per cent rise across the combined regional markets, it is clear that demand for vacant land is most concentrated across the capital city markets where economic conditions are generally stronger,” concluded Tim Lawless.

New Home Sales Grew In December – HIA

The HIA New Homes Sales Report – a survey of Australia’s largest home builders – highlights a relatively healthy end to 2016, said the Housing Industry Association.

New detached house sales fell by 2.3 per cent in the December 2016 quarter, while the sale of multi-units grew by 3.2 per cent.

The December update for the HIA’s monthly New Home Sales survey shows growth of 0.2 per cent in total seasonally adjusted new home sales in December 2016. This result follows faster growth of 6.1 per cent in November. Multi-unit sales increased by 6.4 per cent in December 2016. Detached house sales fell by 1.6 per cent, within which there was strong gains for New South Wales and Victoria.

Seasonally adjusted new detached house sales increased in two out of five mainland states in December 2016, compared to four out of five states in November. Detached house sales increased in the month of December by 2.4 per cent in New South Wales and by 5.8 per cent in Victoria. The monthly fall in detached house sales was 9.1 per cent in Queensland, 1.9 per cent in South Australia, and 9.0 per cent in Western Australia.

“New home sales hit a two year low in October last year, but recovered well in November and December,” said HIA Chief Economist, Dr Harley Dale. “The late 2016 results were strong for the sales of ‘multi-units’, while detached house sales remained in reasonable shape.”

“The strong finish to 2016 for new home sales admittedly follows a very weak month in October,” said Harley Dale. “Obviously it is better that new home sales bounced back rather than kept falling!”

“The overall profile for both HIA New Home Sales and ABS Building Approvals is consistent with the first stage of the down cycle in new home commencements being a mild one. We expect this down cycle to begin in 2017.”

“As has been the case all cycle, new home sales (and building approvals) highlights the large differences in new home building conditions between the five mainland states,” concluded Harley Dale.

Building Approvals Past Peak – HIA

The December 2016 update for ABS Building Approvals confirms we are well passed the peak for the cycle, said the Housing Industry Association.

In December 2016 total seasonally adjusted building approvals fell by 1.2 per cent with detached houses down by 2.2 per cent and ‘other dwellings’ sitting flat at +0.1 per cent. On a three month annualised basis total approvals remain above the 200,000 threshold at 204,692.

In December 2016, seasonally-adjusted building approvals increased by 19.5 per cent in Tasmania and 17.0 per cent in Victoria, while in trend terms there was an increase of 1.2 per cent in the Northern Territory. Building approvals fell in Western Australia (-16.3 per cent), New South Wales (-13.2 per cent), South Australia (-5.4 per cent), and Queensland (-0.1 per cent). In trend terms approvals fell by 2.1 per cent in the Australian Capital Territory.

“While a downward trend in building approvals is firmly entrenched, residential construction activity itself will hold up well throughout 2016/17,” said HIA Chief Economist, Dr Harley Dale. “From 2017/18 we will see a sharper decline in new home building activity, primarily due to the medium/high density segment of the market.”

“Building approvals peaked in July 2016, but by December last year were only 18 per cent lower than that peak. Given approvals reached an all-time high last year that’s a modest fall – we can take that away and bank it as a good outcome for the Australian economy.”

“This has been an extraordinary cycle for new home building – the biggest and longest in history. A long tail to the cycle will be helpful for the Australian economy.”

“It is important to focus in 2017 on ensuring Australia has the correct longer term policy settings to ensure we adequately house our growing and ageing population. The recent appointment of Michael Sukkar as Assistant Minister to the Treasurer, with a focus on housing affordability allows the Federal Government to lead from the front in meeting this crucial national objective.”

Housing Affordability Takes Another Dive

The latest Housing Industry Association (HIA) Affordability Report shows how further gains in dwelling prices have caused housing affordability to deteriorate sharply during the December 2016 quarter.

Affordability worsened in six of the eight capital cities during the December 2016 quarter. The biggest deterioration was in Melbourne (-11.6 per cent), followed by Canberra (-10.7 per cent) and Sydney (-7.3 per cent). Affordability has also become more difficult in Darwin (-3.8 per cent), Brisbane (-2.9 per cent) and Adelaide (-2.3 per cent) during the December 2016 quarter. Only Perth (+2.1 per cent) and Hobart (+1.2 per cent) saw affordability improve during the quarter.

Based on the HIA Affordability Index scores for December 2016, affordability conditions are the most challenging in Sydney (54.7), followed by Melbourne (66.0), Canberra (76.6), Brisbane (85.3) and Darwin (85.3). By some margin, Hobart (117.8) is the most affordable capital city. Perth (96.6) is the second most affordable capital, followed by Adelaide (93.0).

“During the December 2016 quarter, housing affordability across Australia worsened by some 7.3 per cent due to the recent uplift in dwelling prices,” explained HIA Senior Economist, Shane Garrett.

“However, Perth experienced a further improvement in affordability and today’s report also shows how home purchase remains particularly accessible in markets like Tasmania, regional South Australia, regional Western Australia and regional parts of the Northern Territory,” added Shane Garrett.

“Nationally, housing affordability has managed to move in the wrong direction in many major cities despite the fact that interest rates are at very low levels. The sluggish pace of earnings growth in the economy has been an impediment to better affordability,” Shane Garrett pointed out.

“Achieving sustained improvements in affordability requires stepping back and looking at the big picture.

Housing affordability is front and centre in everyone’s mind once more. Whilst there is no single solution, there are some key policy levers that governments could use to provide some relief,” concluded Shane Garrett.


New Home Sales Bounce Back in November

The HIA New Homes Sales Report – a survey of Australia’s largest home builders – shows a strong bounce in November 2016.

In November 2016 new detached house sales increased by 5.2 per cent, while sales of multi-units were up by 9.3 per cent. Seasonally-adjusted new detached house sales increased in four out of five mainland states in November 2016. New South Wales was the exception with a decline of 5.9 per cent. In November last year detached house sales increased by 17.9 per cent in Queensland, 4.7 per cent in Victoria, 4.2 per cent in Western Australia, and 4.0 per cent in South Australia.

The November update for the HIA’s monthly New Home Sales survey shows a 6.1 per cent bounce in seasonally-adjusted new home sales. Over the three months to November 2016 the total number of new home sales fell by 0.7 per cent to be down by only 0.2 per cent when compared to the same three month period in 2015.

“Following a dip to a two year low last October, the November bounce in new home sales is a reminder that the national new home construction sector remains in strong shape,” said HIA Chief Economist, Dr Harley Dale. “The sector may have just passed its peak, but the short term outlook is a healthy one, a conclusion supported by other leading indicators such as the ABS measures of Building Approvals and Housing Finance.”

“At this stage of the new home building cycle that’s a very impressive result – this is already the largest and longest national new home construction cycle in history.”

“A healthy outlook for new home construction in the first half of 2017 is good news for the Australian economy, because of the huge impact that new home construction has on broader economic activity.

Without the boost from housing over the last five years the domestic economy would have at some point slipped into recession.”

“You wouldn’t want to be seeing signals of an imminent and sharp slowdown in national new home building activity, and we’re not. Looking further out, the declines in construction activity will inevitably become chunkier,” concluded Harley Dale.

New Home Starts continue to Ease from Peak

ABS data on building activity indicate that new dwelling starts have passed their record peak, said the Housing Industry Association (HIA).

During the September 2016 quarter, only New South Wales (+5.4 per cent) and Queensland (+6.3 per cent) saw increases in new dwelling commencements. The largest decline was in the ACT (-39.6 per cent) followed by South Australia (-20.0 per cent). There were also large reductions in Western Australia (-13.6 per cent) and Victoria (-9.6 per cent). Falls in new dwelling starts also occurred in the Northern Territory (-7.6 per cent) and Tasmania (-0.6 per cent) during the September 2016 quarter.

“New dwelling starts hit all-time record levels during 2016, but today’s data provides further evidence that we’ve left the peak behind,” commented HIA Senior Economist, Shane Garrett.

During the September 2016 quarter, new dwelling commencements fell by 2.8 per cent in seasonally-adjusted terms to 55,070. Detached house starts were down by 1.8 per cent compared with the previous quarter, while multi-unit commencements dipped by 3.9 per cent. Over the year to September 2016, new dwelling commencements totalled some 229,336.

“The result for the September 2016 quarter represents the second consecutively quarterly decline in new dwelling starts, with a substantial portion of the reduction happening on the multi-unit side,” explained Shane Garrett.

“In contrast, detached house starts have been holding up quite well. The upturn in new home building between 2012 and 2016 was heavily influenced by increased apartment building with output more than doubling,” Shane Garrett pointed out.

“With new home building set to move lower over the next few years, we expect that the higher density market will have to absorb the bulk of the reduction. From a peak of over 230,000 starts during 2015/16, we anticipate that new home starts will continue to ease over the next couple of years and bottom out at around 172,000 during the 2018/19 financial year,” Shane Garrett concluded.

NSW Tops latest HIA Housing Scorecard

New South Wales has widened its lead over Victoria in the latest HIA Housing Scorecard report released today. The HIA Housing Scorecard ranks each of the eight states and territories based on the performance of their housing markets.

hia-rankings-dec-16

“The large states dominate the top rankings in the latest HIA Housing Scorecard, with NSW extending its lead in first place thanks to a remarkable performance on the detached house side,” explained HIA Senior Economist, Shane Garrett.

“In second place on the HIA Housing Scorecard, Victoria was particularly strong for home renovations activity but also did well on the detached housing side,” continued Shane Garrett.

“In this edition of the HIA Housing Scorecard, Queensland grabbed the bronze medal with a solid showing on the multi-unit side,” Shane Garrett remarked.

“Outside of the Top Three, South Australia and the ACT occupied the mid-table positions. Western Australia, the Northern Territory and Tasmania are all neck-and-neck with declining market momentum on the HIA Housing Scorecard,” added Shane Garrett.

“Probably the starkest result from today’s HIA Housing Scorecard concerns the volume of First Home Buyer loans, which have fallen well below their long-term average in each state and territory. The obstacles to housing affordability for first home buyers merit a national-led response,” concluded Shane Garrett.

New Home Sales Fall to Two-Year Low

The Housing Industry Association’s monthly survey of Australia’s largest home builders indicates that new home sales dropped to a two-year low during the month of October.

hia-nov-16

“HIA New Home Sales fell by some 8.5 per cent during October 2016, the lowest volume of sales since July 2014,” remarked HIA Senior Economist, Shane Garrett.

“Sales on both sides of the market saw sizeable reductions during October,” explained Shane Garrett. “Detached house sales were down by 8.2 per cent during the month, while multi-unit sales fell by 9.2 per cent.”

“The reduction in the volume of new home sales is not unexpected, given that Australia is coming to the end of its longest and strongest new home building upturn,” Shane Garrett pointed out.

“October’s new home sales results are consistent with HIA’s latest forecasts for new home building starts which foresee a reasonably marked reduction in activity over the next couple of years. Even so, activity is projected to fall to a low point of around 172,000 new dwellings starts during 2018/19, about the same as the average of the past decade,” concluded Shane Garrett.

During October 2016, detached house sales fell in three of the five mainland states covered by the report. The largest reduction in sales volumes during the month was in Victoria (-20.4 per cent), with new detached house sales also falling in Western Australia (-5.6 per cent) and New South Wales (-2.8 per cent). New detached house sales rose by 4.5 per cent in Queensland during October, with a slight increase of 0.8 per cent in South Australia.

HIA Says Unit Construction Will Slow

HIA says from their peak of 117,000 in this calendar year multi-unit commencements are expected to fall by over 40 per cent by 2018/19.

“New residential building will slow for the next two years to bottom out at what will still be a historically healthy level of activity” said the Housing Industry Association.

The latest ”HIA National Outlook” released today takes a comprehensive look at conditions in the residential building and renovation markets around the country.

hia-construciton-nov-16

HIA Acting Chief Economist Warwick Temby said “notwithstanding the current uncertainties around the broader economic outlook, especially with the future US policy settings up in the air, HIA is forecasting a measured return to more normal levels of home building activity over the next couple of years.

“The recent peak in new home building was unprecedented: an all-time record 229,823 new residential dwellings started building in 2015/16. This record level of building has made a major contribution to Australia’s economic growth over the last few years and eased the under-supply of housing for both owner occupiers and renters that had built up over the previous ten years.

“Multi-unit building, especially apartments in the Eastern States, has driven much of the growth in this cycle and is also forecast to lead the slowdown in new activity over the next couple of years. From their peak of 117,000 in this calendar year multi-unit commencements are expected to fall by over 40 per cent by 2018/19.

“A softer landing is forecast for detached homes with 103,000 starts predicted for 2018/19, down 9 per cent on the peak this year.
“The forecast falls in new activity will not be uniform across the country; Western Australia and South Australia started their down-cycle well in advance of other states.

“Total new commencements are forecast to decline 3.1 per cent, 18.5 per cent and 5.1 per cent over the period 2016/17 – 2018/19, which would take commencements to a trough of 172,242, which is the average for the last ten years.

“Actual building activity on the ground will not decline in the same way as new starts due to the substantial volume of work under construction that will not be completed until 2018 and into 2019.

“Dwelling renovations are forecast to grow over the forecast period counteracting some of the decline in the new home building activity. By 2018/19 renovations are forecasts to have grown by 6.5 per cent to be worth $32.96 billion in that year” Mr Temby concluded.