The latest from the Federal Reserve, and the trade talks – are they connected? Why the lift in repo transactions ahead?
https://www.newyorkfed.org/markets/opolicy/operating_policy_191212
Digital Finance Analytics (DFA) Blog
"Intelligent Insight"

The latest from the Federal Reserve, and the trade talks – are they connected? Why the lift in repo transactions ahead?
https://www.newyorkfed.org/markets/opolicy/operating_policy_191212
The Fed appears to be concerned about end of the year liquidity, judging by their latest statement on their repo operations.
The Open Market Trading Desk (the Desk) at the Federal Reserve Bank of New York has released the schedule of repurchase agreement (repo) operations for the monthly period from December 13, 2019 through January 14, 2020. In accordance with the most recent FOMC directive, the Desk will conduct repo operations to ensure that the supply of reserves remains ample and to mitigate the risk of money market pressures around year end that could adversely affect policy implementation.
The Desk will continue to offer two-week term repo operations twice per week, four of which span year end. In addition, the Desk will also offer another longer-maturity term repo operation that spans year end. The amount offered in this operation will be at least $50 billion.
Overnight repo operations will continue to be held each day. On December 31, 2019 and January 2, 2020, the overnight repo offering will increase to at least $150 billion. In addition, on December 30, 2019, the Desk will offer a $75 billion repo that settles on December 31, 2019 and matures on January 2, 2020.
The Desk intends to adjust the timing and amounts of repo operations as needed to mitigate the risk of money market pressures that could adversely affect policy implementation, consistent with the directive from the FOMC.
Detailed information on the schedule and parameters of term and overnight repurchase agreement operations are provided on the Repurchase Agreement Operational Details site.
So, the NY Fed will continue to offer two-week term repo operations twice per week, four of which run across the end of the year end. Plus, they will also offer another longer-maturity term repo operation that spans year end. The amount offered in this operation will be at least $50 billion.
Beyond that, they announced that the overnight repo offering will increase to at least $150 billion to cover the “turn” in a flood of overnight liquidity. And on December 30, 2019, the Desk will offer a $75 billion repo that settles on December 31, 2019 and matures on January 2, 2020.
And they leave the door open to more if need by saying “intends to adjust the timing and amounts of repo operations as needed to mitigate the risk of money market pressures that could adversely affect policy implementation, consistent with the directive from the FOMC.”
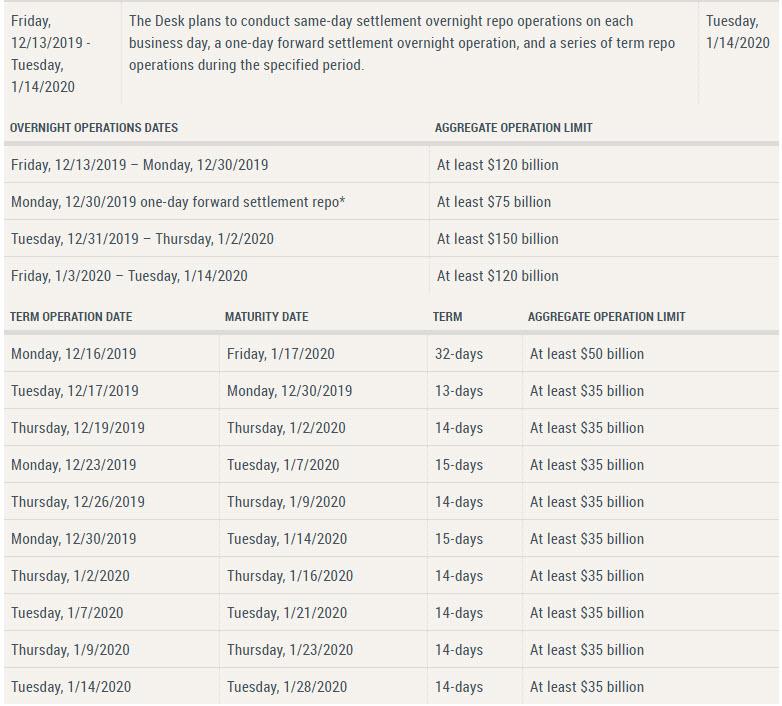
So in essence, as well has growing the size its overnight repos to $150 billion, the Fed will run nine term repos covering the year-end turn from Dec 16th to Jan 14th, 8 of which will amount to $35 billion and the first will be $50 billion, for a total injection of $365 billion in the coming month.
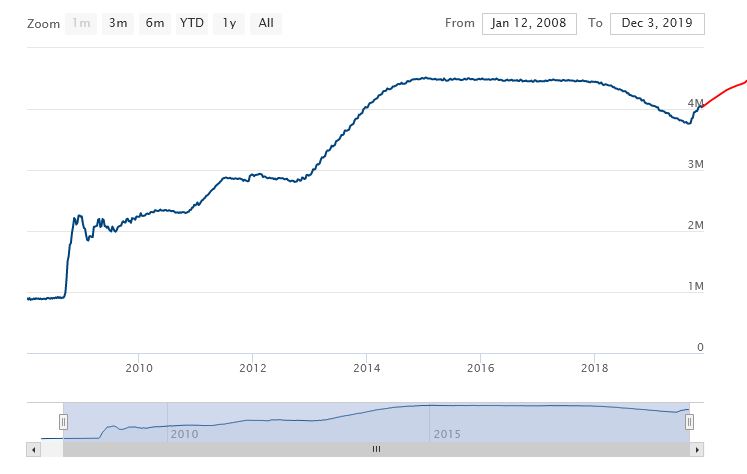
This is what the Fed Balance Sheet might look like. If this is not QE, I do not know what is….
The core question is what are they afraid of?
Information received since the Federal Open Market Committee met in October indicates that the labor market remains strong and that economic activity has been rising at a moderate rate. Job gains have been solid, on average, in recent months, and the unemployment rate has remained low. Although household spending has been rising at a strong pace, business fixed investment and exports remain weak. On a 12‑month basis, overall inflation and inflation for items other than food and energy are running below 2 percent. Market-based measures of inflation compensation remain low; survey-based measures of longer-term inflation expectations are little changed.
Consistent with its statutory mandate, the Committee seeks to foster maximum employment and price stability. The Committee decided to maintain the target range for the federal funds rate at 1‑1/2 to 1-3/4 percent. The Committee judges that the current stance of monetary policy is appropriate to support sustained expansion of economic activity, strong labor market conditions, and inflation near the Committee’s symmetric 2 percent objective. The Committee will continue to monitor the implications of incoming information for the economic outlook, including global developments and muted inflation pressures, as it assesses the appropriate path of the target range for the federal funds rate.
In determining the timing and size of future adjustments to the target range for the federal funds rate, the Committee will assess realized and expected economic conditions relative to its maximum employment objective and its symmetric 2 percent inflation objective. This assessment will take into account a wide range of information, including measures of labor market conditions, indicators of inflation pressures and inflation expectations, and readings on financial and international developments.
We look at insights from the latest BIS Quarterly Report, and examine the U.S. Repo issue. They reveal it was structural – an insight which is significant.
The BIS has released their quarterly update. It comprises a review of market developments over the past quarter, and special features that analyse topical economic and financial issues.
Overall, they say that easing trade tensions in mid-October triggered a risk-on phase in global financial markets. Equity prices rallied, reaching new highs in the United States in November. At the same time, credit spreads tightened, and yields on safe sovereign bonds edged higher. Nevertheless, the economic outlook remained tepid and inflation low, leading central banks to ease further.
The renewed risk appetite, coupled with loose financial conditions, sparked questions about the sustainability of asset valuations. Investors’ compensation for bearing risk seems to hinge on the term premium; to the extent that the premium is unusually low, it may flatter valuations.
Claudio Borio, Head of the BIS Monetary and Economic Department, commented: “Rather stretched asset valuations, high risk-taking and hard-to-read changes in the financial system: the mixture points to certain vulnerabilities in financial markets that merit close attention on the part of market participants and central banks alike.”
They offer specific analysis of the US Repo problem, and highlight a significant structural change as some US major banks become net providers of liquidity.
The mid-September tensions in the US dollar market for repurchase agreements (repos) were highly unusual. Repo rates typically fluctuate in an intraday range of 10 basis points, or at most 20 basis points. On 17 September, the secured overnight funding rate (SOFR) – the new, repo market-based, US dollar overnight reference rate – more than doubled, and the intraday range jumped to about 700 basis points. Intraday volatility in the federal funds rate was also unusually high. The reasons for this dislocation have been extensively debated; explanations include a due date for US corporate taxes and a large settlement of US Treasury securities. Yet none of these temporary factors can fully explain the exceptional jump in repo rates.
This box focuses on the distribution of liquid assets in the US banking system and how it became an underlying structural factor that could have amplified the repo rate reaction. US repo markets currently rely heavily on four banks as marginal lenders. As the composition of their liquid assets became more skewed towards US Treasuries, their ability to supply funding at short notice in repo markets was diminished. At the same time, increased demand for funding from leveraged financial institutions (eg hedge funds) via Treasury repos appears to have compounded the strains of the temporary factors. Finally, the stress may have been amplified in part by hysteresis effects brought about by a long period of abundant reserves, owing to the Federal Reserve’s large-scale asset purchases.
A repo transaction is a short-term (usually overnight) collateralised loan, in which the borrower (of cash) sells a security (typically government bonds as collateral) to the lender, with a commitment to buy it back later at the same price plus interest. Repo markets redistribute liquidity between financial institutions: not only banks (as is the case with the federal funds market), but also insurance companies, asset managers, money market funds and other institutional investors. In so doing, they help other financial markets to function smoothly. Thus, any sustained disruption in this market, with daily turnover in the US market of about $1 trillion, could quickly ripple through the financial system. The freezing-up of repo markets in late 2008 was one of the most damaging aspects of the Great Financial Crisis (GFC).
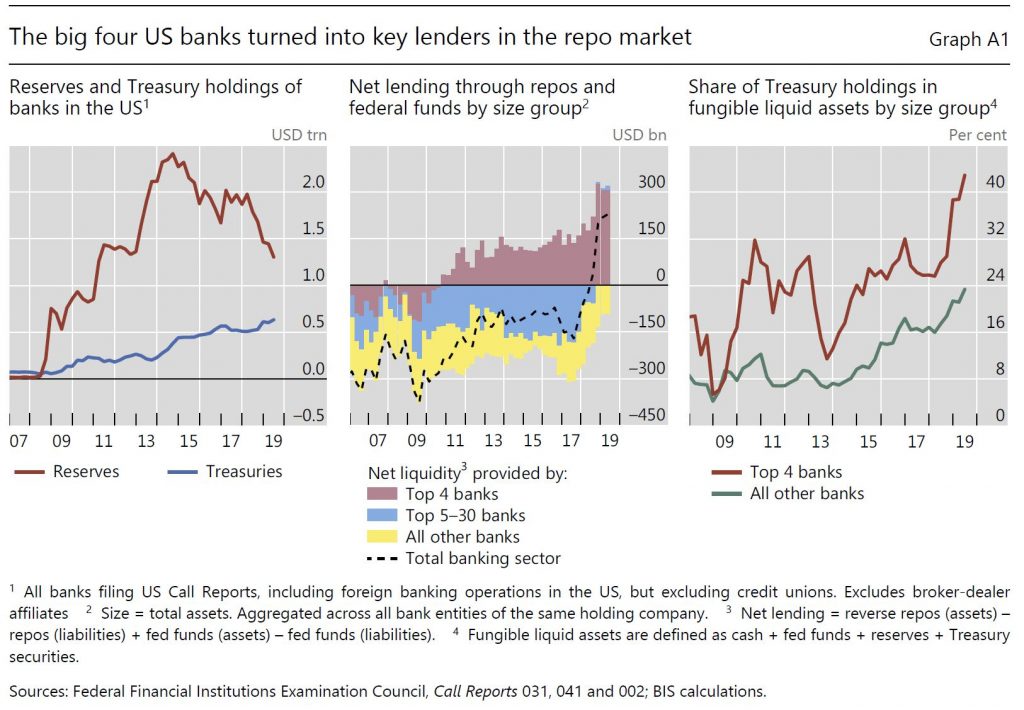
The liquid asset holdings of US banks and their composition have changed significantly since the GFC. Successive rounds of large-scale asset purchases reduced the free float of long-dated US Treasuries available to the market between the end of 2008 and October 2014. On the flip side, banks accumulated large amounts of reserve balances remunerated at the Fed’s interest on excess reserves (IOER) (Graph A.1, left-hand panel, red line). After the Federal Reserve started to run down its balance sheet in October 2017, reserves contracted, quickly but in an orderly way as intended. Alongside, banks’ holdings of US Treasuries increased, almost trebling between end-2013 and the second quarter of 2019 (blue line).
As repo rates started to increase above the IOER from mid-2018 owing to the large issuance of Treasuries, a remarkable shift took place: the US banking system as a whole, hitherto a net provider of collateral, became a net provider of funds to repo markets. The four largest US banks specifically turned into key players: their net lending position (reverse repo assets minus repo liabilities) increased quickly, reaching about $300 billion at end-June 2019 (Graph A.1, centre panel, red bars). At the same time, the next largest 25 banks reduced their demand for repo funding, turning the net repo position of the banking sector positive (centre panel, dashed line). The big four banks appear to have turned into the marginal lender, possibly as other banks do not have the scale and non-bank cash suppliers such as money market funds (MMFs) hit exposure limits (see below).
Concurrent with the growing role of the largest four banks in the repo market, their liquid asset holdings have become increasingly skewed towards US Treasuries, much more so than for the other, smaller banks (Graph A.1, right-hand panel). As of the second quarter of 2019, the big four banks alone accounted for more than 50% of the total Treasury securities held by banks in the United States – the largest 30 banks held about 90% (Graph A.2, left-hand panel). At the same time, the four largest banks held only about 25% of reserves (ie funding that they could supply at short notice in repo markets).
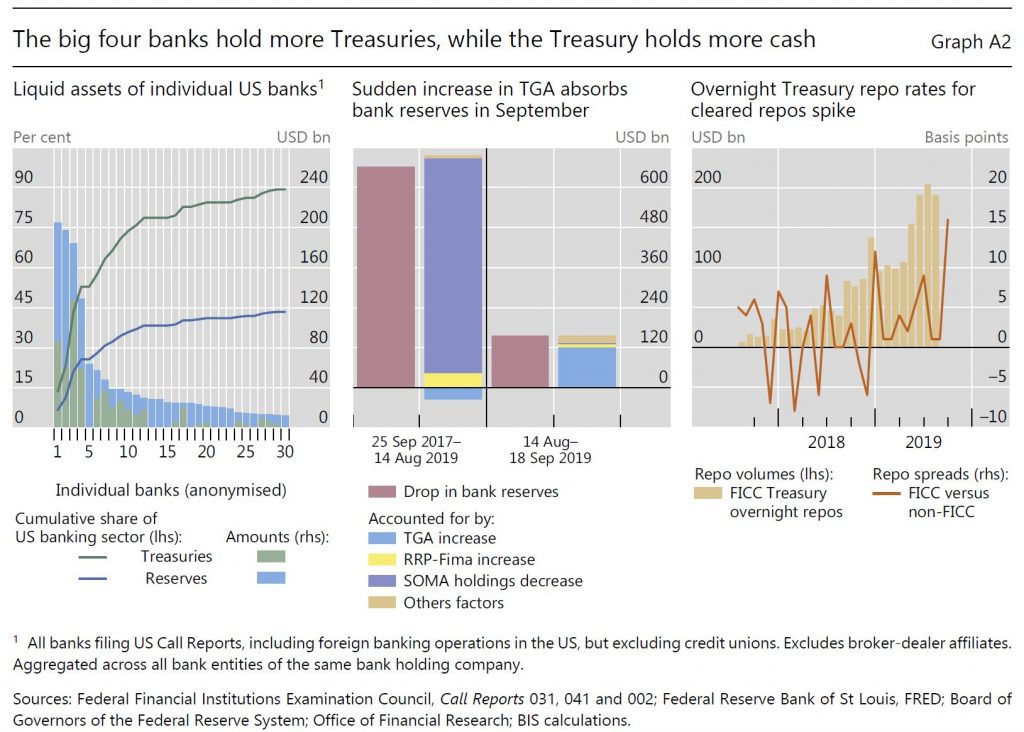
Cash balances held by the US Treasury in its Federal Reserve account (the Treasury General Account, TGA) grew in size and became more volatile, especially after 2015. The resulting drain and swings in reserves are likely to have reduced the cash buffers of the big four banks and their willingness to lend into the repo market. After the debt ceiling was suspended in early August 2019, the US Treasury quickly set out to rebuild its dwindling cash balances, draining more than $120 billion of reserves in the 30 days between 14 August and 17 September alone, and half of this amount in the last week of that period. By comparison, while the Federal Reserve runoff removed about five times this amount, it did so over almost two years (Graph A.2, centre panel).
Besides these shifts in market structure and balance sheet composition, other factors may help to explain why banks did not lend into the repo market, despite attractive profit opportunities. A reduction in money market activity is a natural by-product of central bank balance sheet expansion. If it persists for a prolonged period, it may result in hysteresis effects that hamper market functioning. For instance, the internal processes and knowledge that banks need to ensure prompt and smooth market operations may start to decay. This could take the form of staff inexperience and fewer market-makers, slowing internal processes. Moreover, for regulatory requirements – the liquidity coverage ratio – reserves and Treasuries are high-quality liquid assets (HQLA) of equivalent standing. But in practice, especially when managing internal intraday liquidity needs, banks prefer to keep reserves for their superior availability.
Shifts in repo borrowing and lending by non-bank participants may have also played a role in the repo rate spike. Market commentary suggests that, in preceding quarters, leveraged players (eg hedge funds) were increasing their demand for Treasury repos to fund arbitrage trades between cash bonds and derivatives. Since 2017, MMFs have been lending to a broader range of repo counterparties, including hedge funds, potentially obtaining higher returns. These transactions are cleared by the Fixed Income Clearing Corporation (FICC), with a dealer sponsor (usually a bank or broker-dealer) taking on the credit risk. The resulting remarkable rise in FICC-cleared repos indirectly connected these players. During September, however, quantities dropped and rates rose, suggesting a reluctance, also on the part of MMFs, to lend into these markets (Graph A.2, right-hand panel). Market intelligence suggests MMFs were concerned by potential large redemptions given strong prior inflows. Counterparty exposure limits may have contributed to the drop in quantities, as these repos now account for almost 20% of the total provided by MMFs.
Since 17 September, the Federal Reserve has taken various measures to supply more reserves and alleviate repo market pressures. These operations were expanded in scope to term repos (of two to six weeks) and increased in size and time horizon (at least through January 2020). The Federal Reserve further announced on 11 October the purchase of Treasury bills at an initial pace of $60 billion per month to offset the increase in non-reserve liabilities (eg the TGA). These ongoing operations have calmed markets.
But, I would observe, that structural change remains…
On 19 November, the US Federal Reserve, the Comptroller of the Currency, and the Federal Deposit Insurance Corporation approved a final capital rule for the largest US banks that requires them to adopt the standardized approach for counterparty credit risk (SACCR).

The rule must be adopted by those US banks which are mandated to use the Basel III advanced approaches (i.e., advanced internal ratings-based); other US banks may voluntarily adopt it. The advanced approaches banks include the eight US global systemically important banks: Bank of America, The Bank Of New York Mellon, Citigroup, Goldman Sachs, JPMorgan Chase & Co, Morgan Stanley State Street Corporation, and Wells Fargo & Company, as well as Capital One, Northern Trust Corporation, PNC Financial Services Group, and U.S. Bancorp. Many of these entities are also benefitting from the Fed’s Repo operations, which are designed to provide additional liquidity.
Moody’s says as originally proposed, SACCR would have resulted in a modest increase in risk-based capital requirements for the largest US banks but a modest decline in their leverage ratio requirements. However, in the final rule US regulators made several revisions to the original proposal which we expect will reduce both capital requirements, a credit negative.
The final rule is effective on 1 April 2020, with a mandatory compliance date of 1 January 2022. In 2014 the Basel Committee on Banking Supervision adopted SACCR as an amendment to the Basel III framework and in October
2018 US regulators proposed requiring the largest US banks to use SACCR for calculating their derivatives exposure amounts. SACCR is a more risk-sensitive approach to risk-weighting counterparty exposures than the current method and also revises certain calculations related to cleared derivatives exposures, including the measurement of off-balance-sheet exposures related to derivatives included in the denominator of the supplementary (i.e., Basel III) leverage ratio (SLR).
In the final rule, US regulators have made certain revisions to the original proposal, including reducing capital requirements for derivative contracts with commercial end-user counterparties and allowing for the exclusion of client initial margin on centrally cleared derivatives held by a bank on behalf of its clients from the SLR denominator.
Regulators explained that the reduction in capital requirements for exposures to commercial end-users is consistent with congressional
and other regulatory actions intended to mitigate the effect of post-crisis derivatives reforms on the ability of such counterparties to manage risks. Additionally, the exclusion of client initial margin on centrally cleared derivatives is consistent with the G20 mandate to establish policies that encourage the use of central clearing. The revisions may also prevent cross jurisdictional regulatory arbitrage because they would align the US with regulations in the UK and Europe on this matter, which are key jurisdictions where many of the largest US banks operate.
Nevertheless, a reduction in capital requirements would allow firms to increase their capital payouts or add incremental risk in other businesses without needing to hold more capital. Regulators estimate that the final rule would result, on average, in an approximately 9% decrease in large US banks’ calculated exposure amount for derivatives contracts and a 4% decrease in their standardized riskweighted assets associated with derivative exposures. The final rule would also lead to an increase of approximately 37 basis points (on average) in banks’ reported SLRs. If all 12 US banks subject to this rule were to maintain their SLRs at current levels instead of letting them rise as they would under the final rule, it would lead to the removal of approximately $55 billion in Tier 1 capital from the US
banking system.
Regulators also estimated that the final rule would lead to changes in individual banks’ SLRs, ranging from a decrease of five basis points to an increase of 85 basis points. Regulators did not identify which bank would receive the largest benefit. Moody’s estimate that if one of the six largest US banks is the beneficiary of an 85-basis-point increase in its SLR and the SLR was previously its binding capital constraint, allowing it to return to its shareholders an amount of capital equal to the entire benefit, it would lead to a reduction of between $9 billion and $25 billion in capital at just one bank.
In addition, on 19 November, US banking regulators published a final rule that amends the supplementary leverage ratio calculation to exclude custody bank holdings of central bank deposits. The change will only apply to The Bank of New York Mellon, State Street Corporation and Northern Trust Corporation.
Although the amended calculation is credit negative because it will allow custody banks to reduce capital and still meet one of their regulatory requirements, the practical effect is limited because other regulatory capital measures, specifically post-stress capital requirements, constrain the banks.
The final rule reflects the implementation of Section 402 of the 2018 Economic Growth, Regulatory Relief and Consumer Protection Act (EGRRCPA). Although EGRRCPA primarily aims to reduce regional and community banks’ regulatory burden, it also identifies central bank deposits held by custody banks as unique. In particular, custody banks maintain significant cash deposits with central banks to manage client cash fluctuations linked to custody and fiduciary accounts. Typically, these client cash positions are funds awaiting distribution or investment, but they can spike significantly in times of stress when custodial clients liquidate securities.
Under the final rule, only the Federal Reserve, the European Central Bank or central banks of Organization for Economic Cooperation and Development member countries that have been assigned a zero risk weight under regulatory capital rules are considered qualifying central banks. The rule also defines a custody bank as any US depository institution holding company with assets under custody to total assets of greater than 30:1. This ratio precludes other large custody providers also subject to the supplementary leverage ratio, such as JPMorgan Chase & Co., from excluding central back deposits in their capital calculation, because unlike the three qualifying firms they are not predominantly engaged in custody and asset servicing.
Looked at in isolation, the final rule would allow BNY Mellon, State Street and Northern Trust to reduce their Tier 1 capital by roughly $8 billion in aggregate – a significant 17% reduction – and still maintain the same supplementary leverage ratios. However, that ratio is just one of many capital requirements.
Indeed, regulators’ own analysis of the supplementary leverage ratio revisions, based on 2018 data, indicates that the final rule is unlikely to reduce Tier 1 capital for any of the three affected holding companies because other capital requirements are more binding.
Specifically, performance of the banks’ capital requirements under the Federal Reserve’s Comprehensive Capital Analysis and Review (CCAR) process has constrained them.
The future course of the custody banks’ capital positions is not yet clear because other aspects of the US regulatory capital framework remain in flux. In particular, regulators are developing a stress capital buffer, which we expect will be incorporated into the CCAR process. On balance, we anticipate that the custody banks are likely to face a capital regime that is less restrictive, though the extent of capital relief is still uncertain.
However, the banks’ reduced supplementary leverage ratio requirement is an early indication of the likely trajectory.
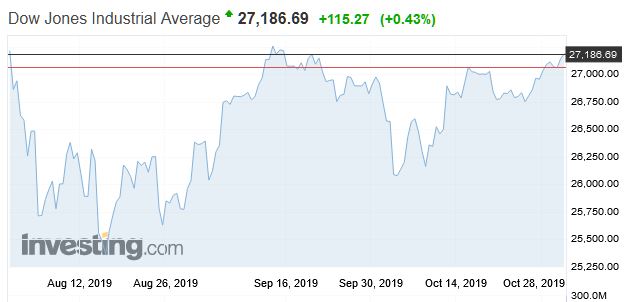
As expected, the Fed cut rates again following their latest meeting. Its worth noting a slight change of tone, which some suggest this may be the last for some time. Worth reflecting though, if we are not in an economic crisis, just why are rates so low, and what firepower remains if one emerges? Their worry centres on trade and business investment. The “Non-QE” QE continues in parallel. The Dow was higher.
Information received since the Federal Open Market Committee met in September indicates that the labor market remains strong and that economic activity has been rising at a moderate rate. Job gains have been solid, on average, in recent months, and the unemployment rate has remained low. Although household spending has been rising at a strong pace, business fixed investment and exports remain weak. On a 12-month basis, overall inflation and inflation for items other than food and energy are running below 2 percent. Market-based measures of inflation compensation remain low; survey-based measures of longer-term inflation expectations are little changed.
Consistent with its statutory mandate, the Committee seeks to foster maximum employment and price stability. In light of the implications of global developments for the economic outlook as well as muted inflation pressures, the Committee decided to lower the target range for the federal funds rate to 1-1/2 to 1-3/4 percent. This action supports the Committee’s view that sustained expansion of economic activity, strong labor market conditions, and inflation near the Committee’s symmetric 2 percent objective are the most likely outcomes, but uncertainties about this outlook remain. The Committee will continue to monitor the implications of incoming information for the economic outlook as it assesses the appropriate path of the target range for the federal funds rate.
In determining the timing and size of future adjustments to the target range for the federal funds rate, the Committee will assess realized and expected economic conditions relative to its maximum employment objective and its symmetric 2 percent inflation objective. This assessment will take into account a wide range of information, including measures of labor market conditions, indicators of inflation pressures and inflation expectations, and readings on financial and international developments.
Voting for the monetary policy action were Jerome H. Powell, Chair; John C. Williams, Vice Chair; Michelle W. Bowman; Lael Brainard; James Bullard; Richard H. Clarida; Charles L. Evans; and Randal K. Quarles. Voting against this action were: Esther L. George and Eric S. Rosengren, who preferred at this meeting to maintain the target range at 1-3/4 percent to 2 percent
Interesting article from The St. Louis Fed “On The Economy” blog titled “Has Australia Really Had a 28-Year Expansion?” Should we use Australia as a benchmark when thinking about possible duration of expansions?
They conclude we have to take it with a grain of salt because looking at just GDP growth doesn’t paint the whole picture. It is important to look at per capita GDP growth to have a broader view.
Their thesis is simple. We have had a long period of growth, thanks to very high population expansion. On a per capita basis, we have had 3 recessions!
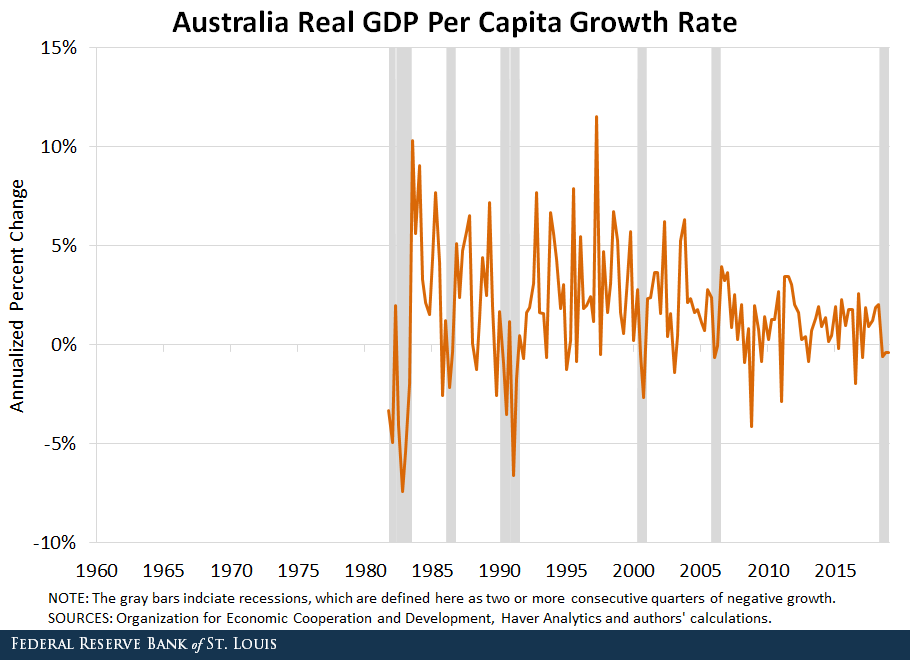
Recessions are shaded gray and defined as two or more consecutive quarters of negative growth.
As shown in the figure, Australia has had three recessions since 1991 when looking at GDP per capita, the most recent one being from the second quarter of 2018 to the first quarter of 2019.
This discrepancy between the growth rate of per capita GDP and the growth rate of GDP implies that population growth has been a key factor for Australia’s economic expansion. A rising population increases the size of the economy, and therefore total output increases, which is reflected in the level of GDP.
However, the fact that we do see economic downturns in per capita terms means that population is growing faster than GDP. For nearly 40 years, Australia has had a higher population growth rate than other industrialized economies.
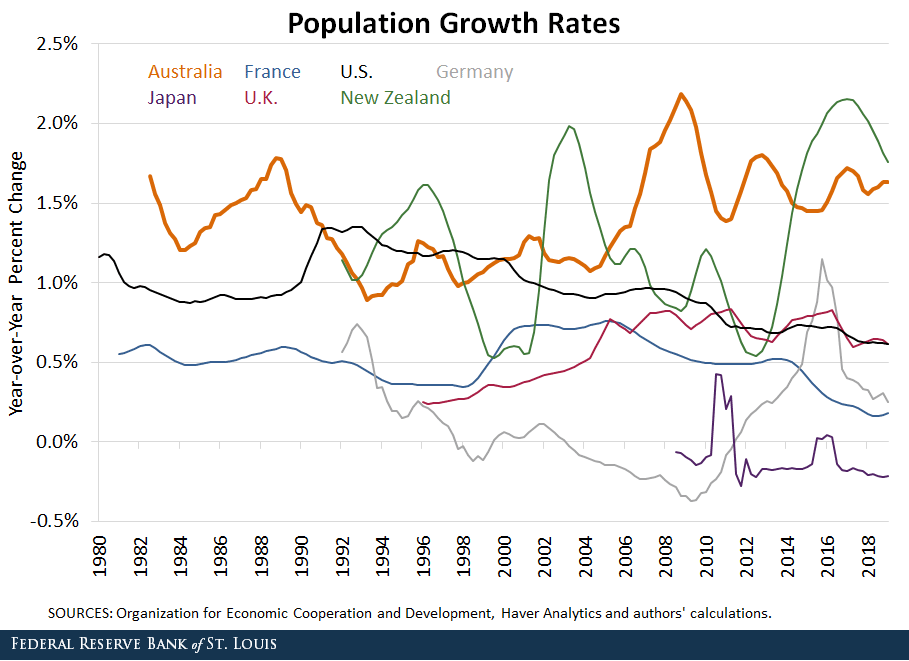
In particular, it had a surge in population around 2008—during the height of the global financial crisis—due to migration. This population growth translated to overall positive GDP growth, but its effect on GDP growth hasn’t been enough to prevent recessions in per capita terms.
We look at the latest in the “repo” drama.
 Blog")
We look at the latest in the “repo” drama.