Auction Clearances Higher

CoreLogic says the amount of auction activity across the capital cities increased this week, up from 2,916 last week to 3,147 this week; the largest number of auctions since the last week of February 2017 when 3,301 auctions were held. This time last year was the Easter long weekend, so auction volumes were substantially lower, with 554 homes taken to auction across the combined capital cities. This week’s preliminary weighted average clearance rate across the combined capitals was 77.1 per cent, increasing from 74.1 per cent over the previous week and up from 70.9 per cent one year ago. Sydney saw the highest preliminary clearance rate across the cities at 81.1 per cent, while across the remaining cities; clearance rates increased week-on week with the exception of Brisbane and Perth where clearance rates fell.

Preliminary clearance rate and auction volumes increase across the combined capital cities

From CoreLogic.

The capital city clearance rate increased this week, with preliminary results showing that 76.2 per cent of reported auctions across the combined capital cities were successful, compared to 75.1 per cent last week and 68.8 per cent one year ago. Auction activity increased over the week with 2,844 homes taken to auction, up from 1,473 last week; however this time last year, volumes were higher with 3,540 properties taken to auction. Each individual capital city market has seen a rise in auction volumes over the week, while clearance rates have been somewhat varied. The highest preliminary clearance rate was in Sydney where 83.9 per cent of auctions cleared over the week, followed by Canberra at 76.6 per cent.


Home Prices Power Away (In Places)

The latest CoreLogic Market Indicator Summary, out today, highlights the divergent home price outcomes across the states. Results to 12 March show Sydney still moving strongly ahead, with Melbourne not far behind. Perth, on the other hand remains under pressure, with falling values.

We really need different economic settings across the states, lower interest rates in the West, but higher in the East. What IS a poor regulator to do? Of, course – “monitor the situation“.

Auction Clearance Up, But Volumes Down

From CoreLogic.

This week 1,402 auctions were held across the combined capital cities, significantly lower than the 2,907 held last week and lower than one year ago (1,488). Four out of the eight states and territories have a public holiday this coming Monday which has been a key factor in the fall in auction volumes. The combined capital city clearance rate rose this week, up from 74.6 per cent last week to 80.8 per cent this week. The two largest auction markets, Melbourne and Sydney, saw their preliminary clearance rates rise, with Sydney at 83.1 per cent and Melbourne at 84.3 per cent, while the highest clearance rate was in Adelaide where 87.0 per cent of auctions cleared over the weekend.  One year ago, the combined capital city clearance rate was a lower 64.9 per cent.

No, Housing Affordability Is Hitting Households Across ALL States

CoreLogic posted an interesting blog today, in which the redoubtable Cameron Kusher says “It is really important to note that the housing affordability challenges are largely a Sydney and Melbourne phenomena”.

Now, I have to say, that just not chime with our household finance analysis. Whilst I agree affordability issues are partly a function of home price movements, other factors are in play. We discussed the distribution of those unable to afford to enter the market recently. You can read our post here.

A detailed analysis of household finances, and expectations show the affordability issues is spread across the states. It would be a mistake to address affordability in just NSW and VIC. In fact if you do, you risk excluding more from other states. You need a national plan.

He is right though when he says:

From a political perspective, politicians do not want to see the cost of housing falling.  We are taught that deflation is undesirable and deflation in the value of the country’s most valuable asset class would have a much broader impact on the economy.  Keep in mind as well that every property that is rented is owned by someone, some are owned by Government but most rental properties are owned by private citizens.

Supply and demand side reforms will be no easy feat and will require cooperation from all levels of government.


Strong Auction Results Once Again

Auction results continue their strong run into March, with Sydney and Melbourne recording an 80% clearance rate over the first week of the month, according to CoreLogic.

After recording the strongest result since June 2015 last week, the preliminary clearance rate across the combined capital cities fell slightly this week, from 78.4 per cent to 77.8 per cent, based on preliminary results. The number of auctions held across the capitals this week was lower, with 2,714 held, compared to 3,301 over the previous week which was a record high for February. In comparison, over the corresponding week last year, both the combined capital city clearance rate and the number of auctions were lower, with 2,304 auctions held and 68.6 per cent reported as successful. Sydney saw the clearance rate remain above 80 per cent for the 4th week in a row, and Melbourne for the 2nd week in a row, while across the remaining cities; week-on-week results show a fall in clearance rates with the exception of Perth where results improved, and Tasmania, which remained unchanged over the week.

Property prices at cyclical high: CoreLogic

From The Real Estate Conversation.

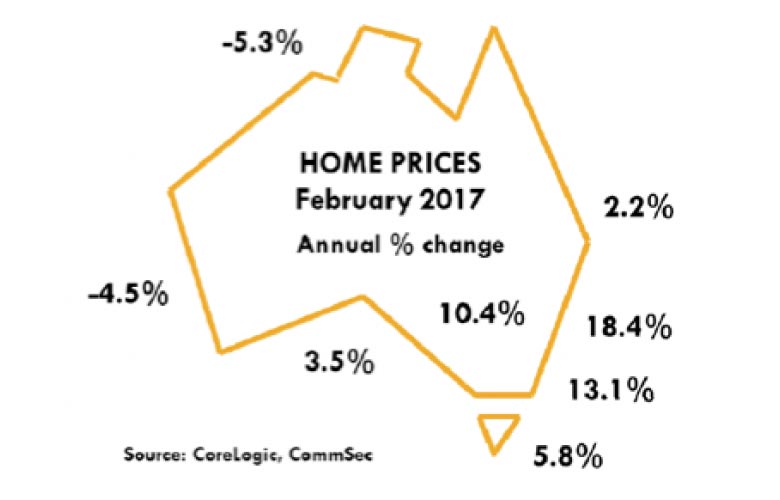
With the current cycle in its 58th month, property price growth hit a new high in February, with prices rising 1.4 per cent to be up 11.7 per cent for the year.

The monthly CoreLogic Hedonic Home Value Index showed Canberra led the way in February with prices rising 3.2 per cent, and Sydney prices were up 2.6 per cent for the month.

Darwin prices fell 4.3 per cent for the month, Perth prices were down 2.4%, and Brisbane eased 0.4 per cent.

Growth conditions have accelerated since mid-2016, said CoreLogic head of research Tim Lawless, as lower interest rates and strong demand from investors drive price increases.

“Growth conditions have been rebounding since the middle of last year when, on two separate occasions, interest rates were cut, and investor demand commenced trending higher,” he said.

Lawless said before the rate cuts, price growth was moderating.

“Prior to capital gains accelerating half way through last year, the growth trend had been moderating, reaching a cyclical low point over the twelve months ended July 2016 when the annual change in capital city dwelling values slowed to 6.1%,” said Lawless.

The February results mark a new high point in the current growth cycle, said Lawless.

“The annual growth rate across the combined capitals hasn’t been this strong since the twelve months ending June 2010,” he said.

Lawless said, “In Sydney, where the annual rate of growth is now 18.4%, this is the highest annual growth rate since the twelve months ending December 2002 when the housing boom of the early 2000’s started to slow.”

The current growth cycle is now approaching five years, being in it 58th month, according to CoreLogic. Since property prices in capital cities began rising June 2012, dwelling values have increased by a cumulative 47.3 per cent, ranging from a 74.9 per cent capital gain in Sydney, to a rise of 6.0% in Perth.

Lawless said the high price growth was bad news for those hoping to get onto the property ladder.

“The strong growth conditions across Sydney have provided a substantial wealth boost for home owners, however, the flipside is that housing costs are becoming increasingly out of reach,” he said.

Lawless said in Sydney, based on September 2016 numbers, dwelling prices are almost 8.5 times higher than gross household income. The figure for Melbourne is 7.1 times.

Craig James, chief economist of CommSec, wrote, “It may be no surprise to see that home prices continue to lift across most capital cities. But what was clearly surprising was the size of the lift in prices.”

“Policymakers will keep a close eye on the housing sector the early part of 2017,” said James, saying they “will prefer to see more balanced house price growth across the nation.”

Mortgage demand has surged in New South Wales and Victoria

From CoreLogic.

New South Wales and Victoria now account for a historically high proportion of national mortgage demand which continues to drive dwelling values much higher across these two cities compared with other regions.

The current housing market growth phase has really been all about Sydney and Melbourne. When you look at dwelling value growth, increases have been substantially higher in Sydney and Melbourne than in all other capital cities. At the same time, demand for mortgages has surged across NSW and Vic (both of which are proxies for Sydney and Melbourne) while it has barely increased across the remaining states and territories.

The first chart highlights the change in capital city dwelling values over the current growth phase. The growth phase broadly began in June 2012 and over the period, only Sydney and Melbourne have recorded value rises greater than 21%. The rise in values has been supported by low interest rates and availability of mortgage finance however, other factors such as localised economic performance, population growth and foreign demand have driven the much stronger growth in Sydney and Melbourne than across the other capital cities.

Change in capital city home values
over current growth phase

2017-02-27--image1

Looking at mortgage finance across the states and territories, in December 2016 the value of mortgage lending across each state and territory was recorded at: $14.5 billion in NSW, $9.6 billion in Vic, $5.1 billion in Qld, $1.6 billion in SA, $2.7 billion in WA, $0.3 billion in Tas, $0.2 billion in NT and $0.7 billion in ACT. Over the month, NSW (41.8%) and Vic (27.7%) accounted for a combined 69.5% of the value of all housing finance commitments which was an historic high. In June 2012 when the current growth phase commenced, 33.6% of housing finance commitments were in NSW and 27.1% were in Vic.

Value of monthly mortgage lending
by states and territories

2017-02-27--image2

The value of housing finance commitments for owner occupier housing in December 2016 across the states and territories were recorded at: $7.7 billion in NSW, $6.0 billion in Vic, $3.5 billion in Qld, $1.1 billion in SA, $2.0 billion in WA, $0.3 billion in Tas, $0.1 billion NT and $0.4 billion in ACT. Since the current value growth phase commenced in June 2012, monthly mortgage lending to owner occupiers has increased from $4.3 billion in NSW and $3.9 billion in Vic.

Value of monthly owner occupier mortgage lending
by states and territories

2017-02-27--image3

In December 2016, the value of mortgage lending to investors across the states and territories was recorded at: $6.8 billion in NSW, $3.7 billion in Vic, $1.7 billion in Qld, $0.5 billion in SA, $0.7 billion in WA, $0.1 billion in Tas, $0.1 billion in NT and $0.2 billion in ACT. More than three quarters (76.3%) of investor mortgage finance nationally in December 2016 was in NSW (49.6%) or Vic (26.7%). While the proportion of lending to investors has previously been higher in each state, combined they make up the largest share on record. At the beginning of the current growth phase, 37.3% of national investor finance commitments were in NSW and 25.1% was in NSW.

Value of monthly investor mortgage lending
by states and territories

2017-02-27--image4

The data shows just how concentrated mortgage demand nationally is currently in NSW and Vic. With the demand focused so much on those two states, it’s no wonder values in Sydney and Melbourne have increased so much more than in the other capital cities. While steps have been made to cool mortgage demand, particularly from investors in Sydney and Melbourne, the data points to the fact that demand remains unquestionably strong. With interest rates remaining at close to historic lows, it is clear that further changes will be required in order to slow mortgage demand and dampen the increases in dwelling values being experienced in Sydney and Melbourne.

Auction clearance rates reach the highest level over the calendar year to date

From CoreLogic.

Across the combined capital cities this week, the number of properties taken to auction increased dramatically, with 3,232 auctions held; significantly higher than what has been recorded over the same period across previous years, with auction volumes generally reaching their seasonal peaks around March.  The record highs for the number of auctions were confined to the Sydney and Melbourne markets, where auction numbers were the highest on record for the month of February.  Despite auctions reaching record highs for February, the combined capital city preliminary clearance rate also reached a new record high over the year to date.  78.6 per cent of auctions recorded a positive result this week, which is higher than the 71.4 per cent last year, across a lower volume of auctions (2,701). Overall activity has increased week-on-week, with volumes increasing across all the capital cities, with clearance rates also rising in most capital cities with the exception of Canberra and Perth, where clearance rates fell over the week.

Auction Volumes Surge Past 2,000 This Week

From CoreLogic.

The combined capital city preliminary clearance rate remained in the high 70 per cent range over the week, despite auction volumes reaching the highest level so far this year.  There were 2,280 dwellings taken to auction this week, significantly increasing from 1,591 over the previous week, with 77.0 per cent of auctions reported as successful.  The larger number of auctions was driven by a substantial rise across the Sydney and Melbourne markets, while the number of auctions held actually saw a decrease across the smaller capital cities over the week.  The strongest clearance rates, based on preliminary data, were in Sydney and Canberra, where 83.5 per cent and 81.5 per cent of auctions returned a successful result.  Melbourne also recorded a strong preliminary clearance rate, with 76.7 per cent of auctions clearing.  The preliminary combined capital city clearance rate was higher this week than what was seen over the same period last year, however, the number of auctions held was lower, with 2,347 auctions held over the same week last year, returning a 71.8 per cent clearance rate.