June Home Lending Flows Take A Dive

The ABS released their Housing Finance data to June 2018 today.

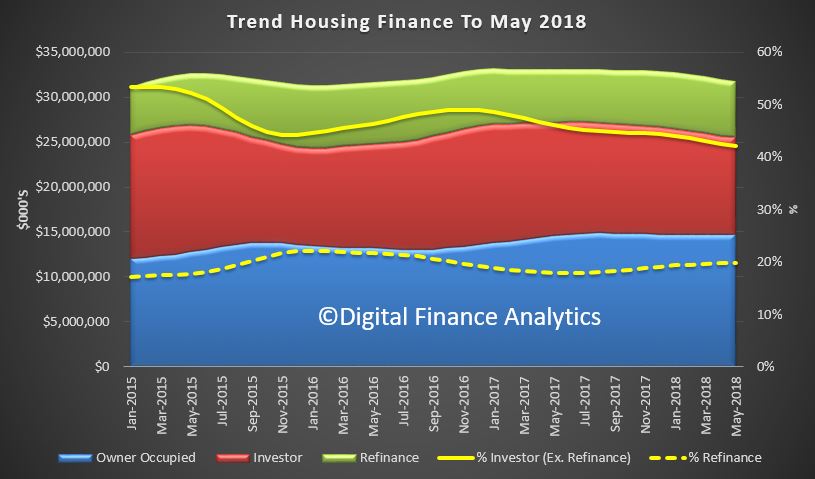
They reported that the trend estimate for the total value of dwelling finance commitments excluding alterations and additions fell 0.7%. Owner occupied housing commitments fell 0.2% and investment housing commitments fell 1.8%. In seasonally adjusted terms, the total value of dwelling finance commitments excluding alterations and additions fell 1.6%.

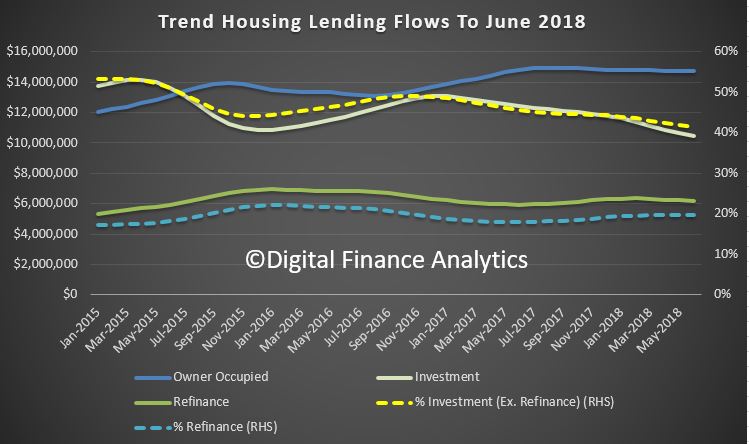
The proportion of loans for investment purposes, excluding refinance, was 41.4%, down from 53% in 2015. The proportion of refinanced owner occupied loans was 19.7%, similar to the past couple of months.

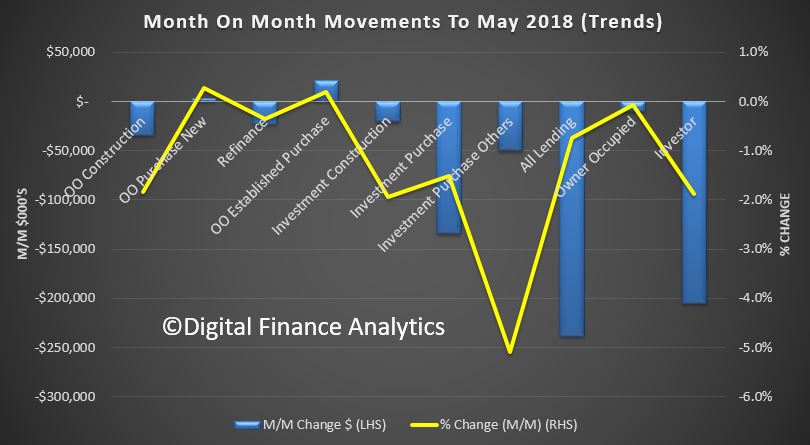
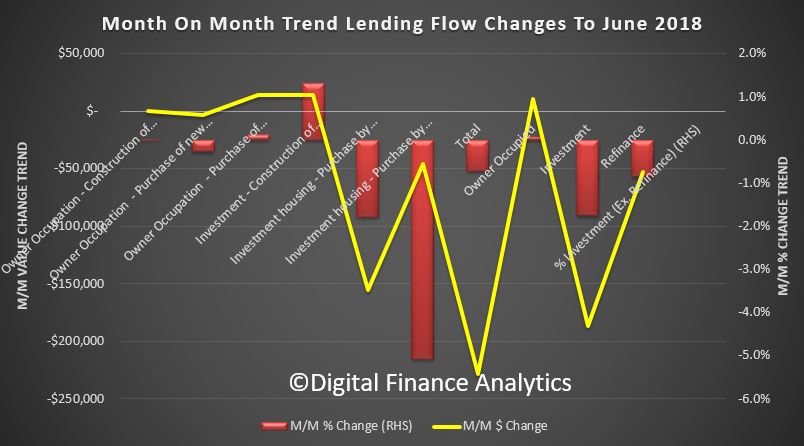
Looking at the changes month on month, owner occupied purchase of new dwellings fell 0.3%, while owner occupied purchase of established dwellings rose 0.1%, or $14,2 million.  Investment construction  lending rose 1.3%, or $14 million, borrowing for investment purposes by individuals fell 1.8%, down $154 million and investment by other entities fell 5.1% of $45.7 million. Refinance of owner occupied loans fell 0.9% or $53 million.

Overall around $31 billion of loan flows were written, down 0.7% in trend terms.

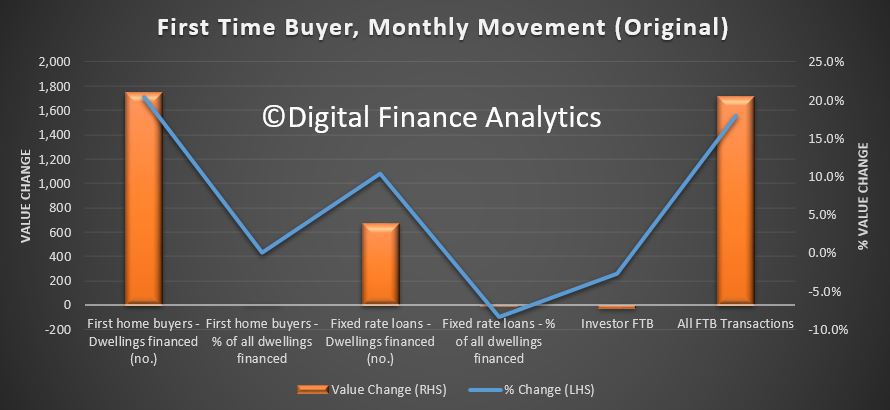
In original terms, the number of first home buyer commitments as a percentage of total owner occupied housing finance commitments rose to 18.1% in June 2018 from 17.6% in May 2018.

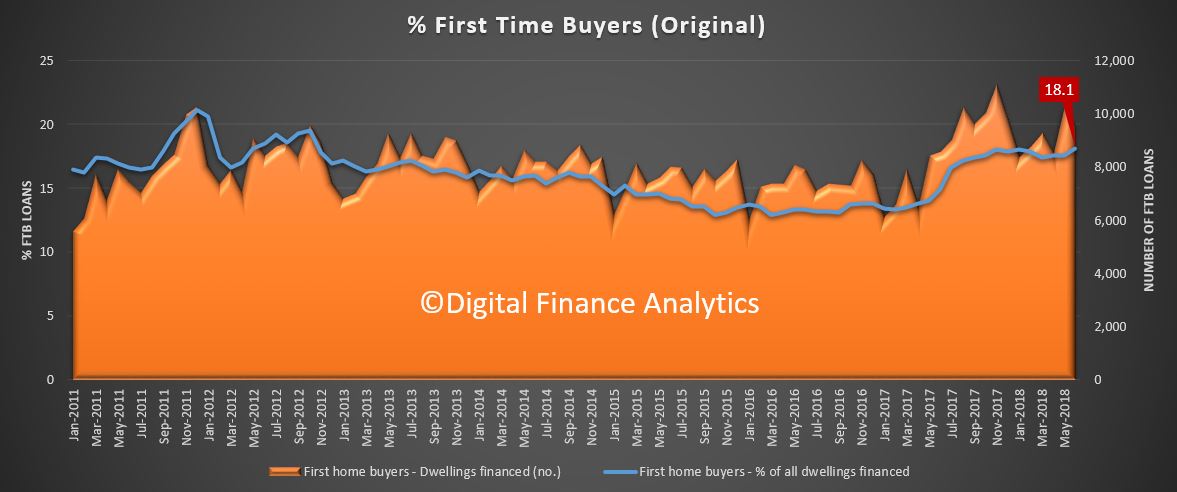
The number of loans fell 762 compared to last month, to 9,541. Within that we still some rises in NSW and VIC compared with a year ago, thanks to the recent FTB grants.  The proportion of loans written at fixed rates fell again.

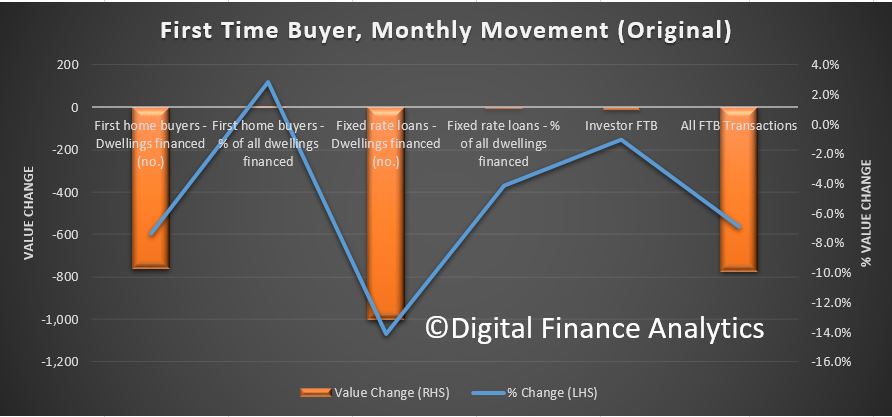
Out First Time Buyer Tracker, which includes an estimate of first time buyers going direct to the investment sector continued at a low level, compared with a year ago.
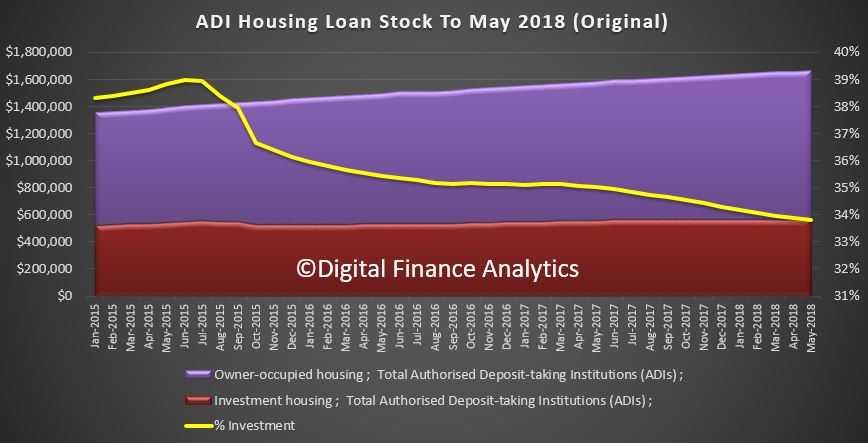
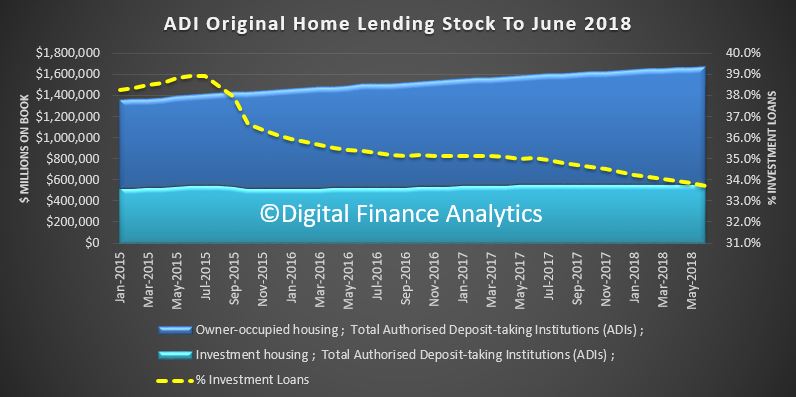
Two final slides, first the original data showing the portfolio of loans outstanding at the banks registered an overall rise of $8 billion, and a fall in the proportion of loans for investment purposes to 33.7%, the lowest level for several years.

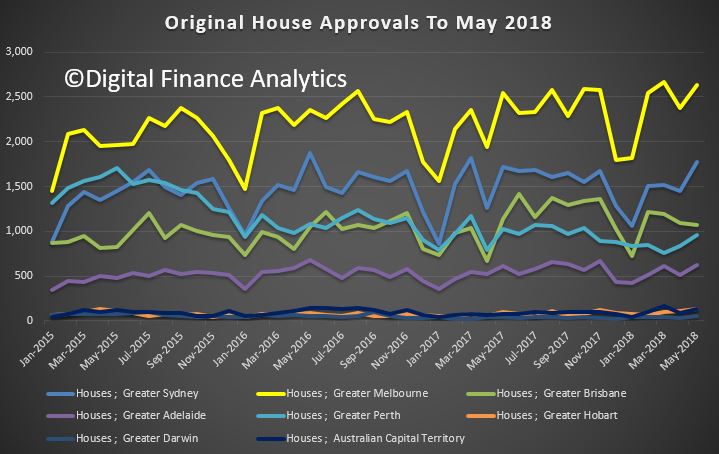
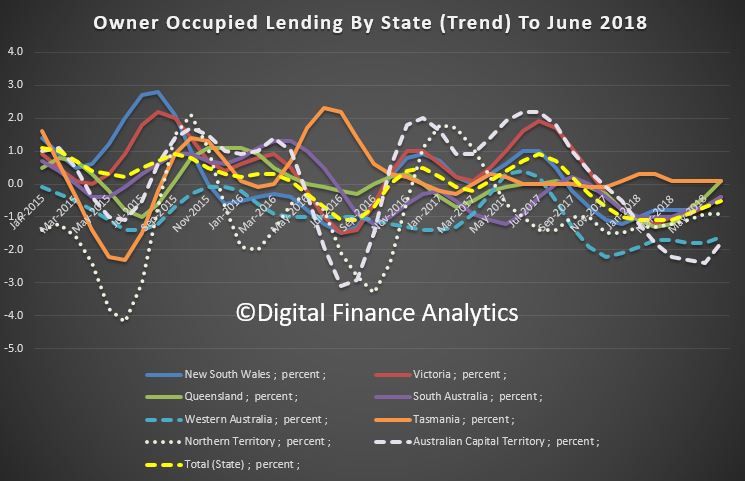
And the mix across states of owner occupied loans shows the strongest growth in Tasmania and Queensland, and falls in loan volumes most announced in ACT and Western Australia.

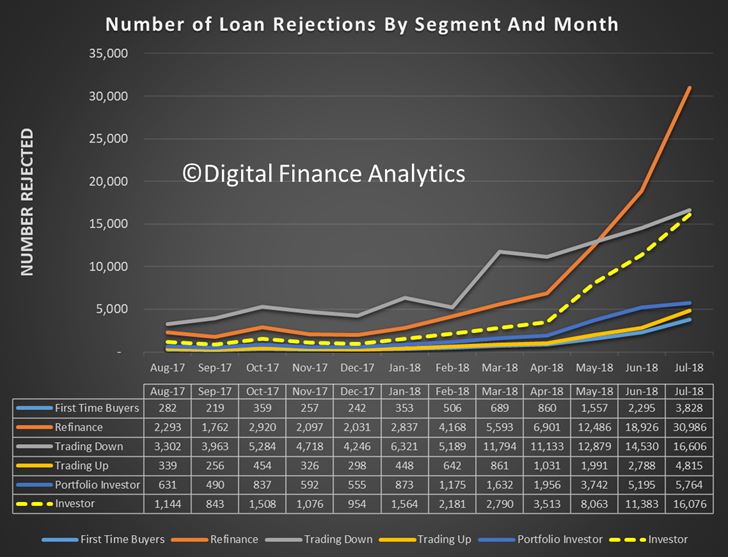
So the tighter lending conditions continue to bit, with investors less likely to get a loan. Some of this relates to demand (or lack of it) but also is being driven by the tighter lending requirements.

This is clearly seen in our surveys, where the number of rejected applications have risen significantly. This is especially true for those seeking to refinance an existing loan, including interest only loans.

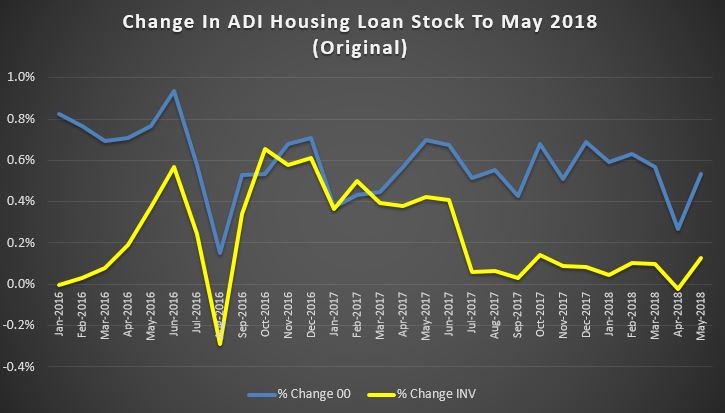
The net portfolio growth, of around $9 billion, or 0.5% in the month in original terms, so overall lending remains quite strong, despite the weaker flows.

Building Approvals A Little Stronger In June 2018

The number of dwellings approved in Australia rose by 0.1 per cent in June 2018 in trend terms, according to data released by the Australian Bureau of Statistics (ABS) today.  We suspect the MSM will fixate on the less reliable seasonal results, which show a significant bounce in approvals.

Among the states and territories, dwelling approvals rose in June in the Australian Capital Territory (5.8 per cent), South Australia (5.6 per cent), Northern Territory (4.8 per cent), Tasmania (2.2 per cent), Western Australia (1.7 per cent) and New South Wales (0.2 per cent) in trend terms.

Dwelling approvals fell in trend terms in Queensland (1.6 per cent) and Victoria (1.2 per cent).

In trend terms, approvals for private sector houses fell 0.6 per cent in June. Private sector house approvals fell in Western Australia (1.4 per cent), Victoria (0.9 per cent) and New South Wales (0.8 per cent), but rose in South Australia (0.4 per cent). Private house approvals were flat in Queensland.

In seasonally adjusted terms, total dwellings rose by 6.4 per cent in June, driven by a 7.2 per cent increase in private dwellings excluding houses. Private houses rose 5.0 per cent in seasonally adjusted terms.

The value of total building approved fell 0.8 per cent in June, in trend terms, and has fallen for seven months. The value of residential building rose 0.3 per cent, while non-residential building fell 2.9 per cent.

“The rise was driven by private dwellings excluding houses, which increased by 1.1 per cent in June.” said Justin Lokhorst, Director of Construction Statistics at the ABS. “This was offset by a 0.6 per cent fall in private sector houses.”

Costs Of Living Rise 2.1% Over Past Year

The latest CPI data from the ABS today for June 2018 shows that the Index (CPI) rose 0.4 per cent in the June quarter 2018, according to the latest Australian Bureau of Statistics (ABS) figures. This follows a rise of 0.4 per cent in the March quarter 2018.

The most significant price rises this quarter are automotive fuel (+6.9 per cent), medical and hospital services (+3.1 per cent), and tobacco (+2.8 per cent). These rises are partially offset by falls in domestic holiday travel and accommodation (-2.7 per cent), motor vehicles (-2.0 per cent) and vegetables (-2.9 per cent).

In annual terms,  transport rose 5.2%, and tobacco by 7.8%. The annual rate was 2.1%, having increased 1.9 per cent through the year to March quarter 2018. Most of this annual growth is due to strength in fuel, electricity and tobacco.

For the June quarter 2018, the All Groups annual percentage change of the Weighted Average of the Eight Capital Cities is +2.1 per cent. Sydney rose 2.1 per cent, Melbourne rose 2.5 per cent, Brisbane rose 1.7 per cent, Adelaide rose 2.7 per cent, Perth rose 1.1 per cent, Hobart rose 2.4 per cent, Darwin rose 1.2 per cent, and Canberra rose 2.8 per cent.

In fact, this is a weak result, the trimmed mean falls below the lower bounds of the RBA target at 1.9%. Yet in some categories households are reporting BIG rises in costs of living. Electricity, Fuel, Health Care costs are bearing down – and frankly the CPI does seem disconnected from the real life experience of many.

Costs are still outpacing income growth, for many households, so net, net they are going backwards, still.

Unemployment Improves In June 2018

The ABS released their employment data for June 2018 today. The headline will read a fall to a 5 year low.

The trend unemployment rate was 5.4% in the month of June 2018, according to latest figures released by the Australian Bureau of Statistics (ABS) today. The trend participation rate remained steady at 65.6 per cent in June 2018, after the May figure was revised up.

 
“Over the year to June, the unemployment rate declined by 0.2 percentage points. This continues a gradual decrease in the trend unemployment rate from late 2014 and is the lowest rate since January 2013,” said the Chief Economist for the ABS, Bruce Hockman.

Employment and hours

Trend employment increased by around 27,000 persons in June 2018 and the growth was evenly split between full-time and part-time employment, with both increasing by over 13,000 persons. The net increase of 27,000 persons comprised well over 300,000 people entering employment, and more than 300,000 leaving employment in the month.

Over the past year, trend employment increased by 318,000 persons or 2.6 per cent, which was above the average year-on-year growth over the past 20 years (2.0 per cent).

15 to 19 year olds have contributed around a third of trend employment growth since January 2018. Employment for 15 to 19 year olds increased by over 6,000 in June 2018 and grew by around 58,000 over the last year.

The trend monthly hours worked increased by 3.4 million hours or 0.2 per cent in June 2018, and by 2.6 per cent over the past year.


States and Territories

Year-on-year growth in trend employment was above the 20 year average in all states and territories except for Victoria and Western Australia. Over the past year, the states and territories with the strongest annual growth in trend employment were New South Wales (3.7 per cent), Australian Capital Territory (2.9 per cent) and Queensland (2.6 per cent).

Underemployment

Underemployment (those in work who want more work) is at 9%, and is trending up a little. This is significantly higher than in 2011 when the employment rate was in a similar region, suggesting that more people feel the need for additional work.

Of course the stats are based on a wide definition of “employed” as even a small number of working hours a week shows as an employed person. Alternative measures of unemployment report much higher rates, so there is a question as to the significance and reliability of the numbers. But the trend remains down, which is good news, but in the region above 5%, the level at which the RBA says income growth may start to rise. So we are not there yet!


Over half of permanent migrants are homeowners

Over half of permanent migrants aged 15 years and over (54 per cent) were buying or owned their own home, according to figures released by the Australian Bureau of Statistics (ABS) today.

“With the release of the 2016 Australian Census and Migrants Integrated Dataset (ACMID), new information on household, family and dwelling characteristics of permanent migrants is now available,” said Denise Carlton, Program Manager of Population Statistics at the ABS.

“This data allows for new insights into the household and family characteristics of permanent migrants in Australia which was previously not available, including home ownership levels.”

Home ownership and rental levels differed by the visa stream of the permanent migrant.

Renting

Overall, 42 per cent of permanent migrants were renting in 2016. Migrants who entered the country through the Humanitarian stream were more likely to be living in rented accommodation (63 per cent) than migrants in the Skilled and Family streams (40 per cent).

Home Ownership

Over half of Family and Skill stream migrants were buying (i.e. had a mortgage) or owned their own home (58 per cent and 57 per cent respectively), compared with almost one third (31 per cent) of Humanitarian migrants.

Migrants in the Family stream had the highest incidence of outright home ownership at 14 per cent, followed by Skill stream (8.0 per cent) and Humanitarian stream migrants (4.7 per cent).

All About Home Lending

Today the ABS published their housing lending statistics for May 2018, and APRA Chair Wayne Byers spoke on the resilience in the financial sector. Interesting timing.

APRA pretty much says they called it just right, and their tightening has not really impacted overall growth, and any further tightening will be marginal.

First, the changes in lending practices to date do not seem to have had an obvious impact on housing credit flows in aggregate. Total housing lending grew at around 6 per cent in the year to May 2018, which is only marginally below long-run averages and roughly in line with the average run rate since 2011 (covering the period since house prices last went through a period of softening in Australia). Indeed, cumulative credit growth in the roughly three and a half years since APRA stepped up the intensity of its actions was greater than cumulative credit growth in the preceding three and a half years. Credit growth appears to be slowing somewhat at the moment, but that is not surprising in an environment of softening house prices and rising interest rates.

Second, it is evident that the composition of housing credit has shifted notably. Lending to investors is certainly now growing more slowly compared to three or four years ago. But despite the tightening in lending standards – which, it’s important to remember, also apply to owner-occupiers – lending to owner-occupiers grew at a very healthy 8 per cent over the past year. This relatively high rate of rate of growth for owner-occupiers (running broadly at almost 3x household income growth) has been sustained during a period in which lending policies and practices have been gradually strengthened.

Despite the prominence it has been given, our goal in seeking to reinforce standards and practices has been relatively modest: ensuring that internal policies are followed in practice, and applying what is, in most cases, a healthy dose of common sense. This has been an orderly adjustment, and we expect it to continue over time. While there is more “good housekeeping” to do, the heavy lifting on lending standards has largely been done. Any tightening from here on is expected to be at the margin as banks seek to get a better handle on borrower expenses, and better visibility of borrower debt commitments.

The ABS data shows that total lending stock grew again in May. This is original data split between owner occupied and investment loans.

Total housing loan stock rose 0.5% in the month to $1.66 trillion. Within that owner occupied lending rose  0.5% to $1.1 trillion and and investment lending rose just 0.1% to $563 billion. Investment loans fell to be 33.8% of all loans. Overall growth is circa 6% annualised. As for whether growth at 3 times income is “healthy” to quote Wayne Byers; well that’s another story.   Remember debt has to be repaid, eventually.

Growth has been strongest in owner occupied lending, but investment lending was also higher.

The trend housing flows were down month on month with a fall of 0.1% in owner occupied lending to $14.7 billion and investment lending down 1.9% to $10.7 billion. There was$6.3 billion of refinancing, a drop of 0.4%.  42% of lending was for investment purposes (excluding refinancing) and 19.9% of lending was refinancing, this proportion rose a little.

Looking in more detail at the trend movements by category, only owner occupied purchase of established dwellings rose, all other categories fell back. Investor lending continued to slide on a relative basis.

The month on month changes show the movements, and we note a slower rate of decline in investor lending.

First time buyers continue to support the market, with a 17.6% share of all loans written but a significant rise in the absolute number of first time loans written (up 20.5% on last months) as well as a rise in non first time buyer borrowers. These are original numbers, so they do move around from month to month, and does reflect the incentives for first time buyers in some states.

The number of investor first time buyers continues to fall.

The month on month movements show the additional 1,750 buyers in the month. Worth noting also that the average loan size continues to grow,  at $412,000 for non-first time buyers, up 0.4% on the previous month and $344,000 for a first time buyer, up 0.5%.  There are some variations across the states, but I won’t include those here. There was also a further fall in the number of fixed rate loans being written, down to 12.1% from 13.2% last month.

To me this begs the question, if credit is still running at these levels, and APRA says the tightening is all but done, will we see home prices starting to trend higher? Clearly the plan is to keep the debt bomb ticking for yet longer.

But this may well mean the RBA will lift rates sooner than I expected.

Retail Trade Still Struggles

The ABS says the trend estimate for Australian retail turnover rose 0.3 per cent in May 2018 following a rise (0.3 per cent) in April 2018. Compared to May 2017, the trend estimate rose 2.8 per cent, so still stronger than wages growth (as people raid savings and put more on credit cards).

Across the categories department stores rose 0.5% on the previous month, thanks to sales being brought forward from June, food retailing was up 0.4%, household goods and other retailing were 0.2% and clothing and footwear rose just 0.1%.

Across the states,  the northern territories rose 0.9, ACT 0.6%, Tasmania 0.5%, New South Wales 0.4%, Victoria 0.3%, Queensland and SOuth Australia 0.1% and there was no change in Western Australia.

Online retail turnover contributed 5.6 per cent to total retail turnover in original terms in May 2018, a rise from 5.4 per cent in April 2018. In May 2017 online retail turnover contributed 3.9 per cent to total retail.

Dwelling Approvals Fall in May

The number of dwellings approved in Australia fell by 1.5 per cent in May 2018 in trend terms, according to data released by the Australian Bureau of Statistics (ABS) today.  At is all about a fall in unit approvals, with a notable decline in Melbourne.  Expect more falls ahead, a further signs of trouble in the housing sector.

“Dwelling approvals have weakened in May, driven by a 2.6 per cent fall in private dwellings excluding houses,” said Justin Lokhorst, Director of Construction Statistics at the ABS.

Among the states and territories, dwelling approvals in May fell in Queensland (4.2 per cent), Victoria (2.7 per cent), Tasmania (2.0 per cent) and Western Australia (0.8 per cent) in trend terms.


Dwelling approvals rose in trend terms in South Australia (4.3 per cent), Northern Territory (2.8 per cent) and Australian Capital Territory (1.5 per cent), and were flat in New South Wales.

In trend terms, approvals for private sector houses fell 0.5 per cent in May. Private sector house approvals fell in Queensland (1.7 per cent), Western Australia (0.6 per cent), South Australia (0.4 per cent) and New South Wales (0.2 per cent). Private sector house approvals were flat in Victoria.

In seasonally adjusted terms, total dwellings fell by 3.2 per cent in May, driven by a 8.6 per cent decrease in private sector houses. Private sector dwellings excluding houses rose 4.3 per cent in seasonally adjusted terms.

The value of total building approved fell 0.7 per cent in May, in trend terms, and has fallen for seven months. The value of residential building fell 0.8 per cent, while non-residential building fell 0.4 per cent.

The HIA said:

“The market is cooling for a number of reasons including a slowdown in inward migration since July 2017, constraints on investor finance imposed by state and federal governments and falling house prices.

“A slowing in Australia’s population growth since June 2017 coincides with changes to visa requirements announced early last year. Since then Australia has experienced almost a year of slowing population growth.

“Finance has become increasingly difficult to access for home purchasers. Restrictions on lending to investors and rising borrowing costs have seen credit growth squeezed. Falling house prices in metropolitan areas have also contributed to banks tightening their lending conditions which have further constrained the availability of finance.