Wages rise 0.6% in the September quarter 2018

The seasonally adjusted Wage Price Index (WPI) rose 0.6 per cent in September quarter 2018 and 2.3 per cent through the year, according to figures released today by the Australian Bureau of Statistics (ABS).

The more reliable trend  was 0.5% in the September quarter. Private sector wages grew by 0.55% over the quarter, whereas public sector wages grew by 0.61%.

So Public Sector wages are growing more strongly, whilst the private sector continues to struggle. The weak wages growth will dent the budget projections and household budgets.

ABS Chief Economist Bruce Hockman said seasonally adjusted, private sector wages rose 2.1 per cent and public sector wages grew 2.5 per cent, through the year to September quarter 2018.

“There was a higher rate of wage growth recorded across the majority of industries in comparison to this time last year, reflecting the influence of improved labour market conditions,” Mr Hockman said. “Annual wage growth at the Australia level was 2.3%, the highest growth rate since September quarter 2015.”

In original terms, annual growth to the September quarter 2018 ranged from 1.8 per cent for the Mining and Retail trade industries to 2.8 per cent for the Health care and social assistance industry.

Western Australia recorded the lowest through the year wage growth of 1.8 per cent while Tasmania recorded the highest of 2.6 per cent.

The ABS also released today a feature article that extends previous research looking at the factors underpinning wage growth. The article, Update on the Size and Frequency of Wage Changes, uses job-level micro data and shows that over the last two years the average frequency of wage changes has increased while the average size of wage rises has remained broadly stable.

Housing Lending Flows Contract In September

Further evidence in the lending slow down came through in spades today with the ABS releasing their housing finance statistics to September 2018.

Looking at the trend flows first, new lending for owner occupation fell 1.7% compared with last month, down $235 million to $13.78 billion.  Investment lending flows fell 0.8%, down $69 million to $8.96 billion, and owner occupied refinanced loans were flat at $6.24 billion.

Refinanced loans as a proportion of all flows rose to 20.8% and we continue to see this sector of the market the main battleground for lenders who are trying to attract lower risk existing borrowers with keen rates. Investment loans, were 39.4% of all new loans, up again from last month as owner occupied lending demand eases.

Looking at all the categories of loans month on month, we see lending for owner occupied construction down 1.2%, lending for the purchase of new dwellings down 2.2%, lending for the purchase of other existing dwellings down 1.7%, while investment lending for the construction of new property fell 2.5%, investment property for individuals fell 0.6% and investment lending for other entities, such as self managed super funds, dropped 2.2%. As a result total flows were down 1.1% compared with last month.

First time buyers were also down in number in September, falling by 8.8% to 8,693 new loans.  This was 18% of all loans, up from 17.8% last month.

Looking at the individual elements, overall first time buyers were down, although overall more loans were written with a fixed rate, in response to the battery of cheap rate deals which were on offer.

Our first time buyer tracker shows the lower trends, especially as the number of new first time buyer property investors continue to slide.

Finally, the overall loan stock rose in the month, in original terms, with owner occupied loans up 0.3% or $3.4 billion, and investment loans were flat, giving a total of $1.68 trillion, up 0.2%, and continuing the slowing trends.

We think lending growth will continue to slow, as prices fall further, and lending standards continue to tighten. Whilst some slack is being taken up by the non-bank sector, reduced credit means lower home prices ahead. We are entering the danger zone.

Why The Consumer Price Index Is Flawed

From The Conversation.

Officially, Australia’s rate of inflation is 1.9%.

It’s the lowest it has been on a sustained basis since the 1950s and early 1960s.

But try to tell that to anyone and they will laugh at you, or worse.

The Bureau of Statistics is careful to say that the consumer price index isn’t a measure of living costs.

It creates that slightly differently, producing a collection of less-reported indexes that were updated this week.

On these measures, over the past year living costs have climbed 2% for households headed by an employee, 2.2% for households headed by Australians on most types of benefits, 2.3% for households headed by age pensioners, and also 2.3% for households headed by self-funded retirees.

The main difference between the consumer price index and the living cost indexes is that “living costs” include interest paid on mortgages whereas “consumer prices” do not.

Regardless, most of us would be pretty certain that even on these measures, what’s reported is too low.

We’re irrational

In part, this is because we are not rational. As Nobel Laureate Richard Thaler has pointed out, we often engage in “mental accounting”.

In general this means we notice losses more than gains. In this context, it means we focus more on the things that have gone up in price than on those that have gone down or remained unchanged.

Also, our mental basket of goods is generally not the same as the basket of goods the bureau measures, even though it should be.

It’s not our basket

Four times a year in multiple locations throughout each capital city the bureau attempts to collect information about the prices of the thousands of goods (and some services) that make the “basket” it thinks represent they typical household’s purchases.

The basket is divided into about 100 subgroups; things such as bread, milk, eggs, fruit, men’s footwear, women’s footwear, men’s clothes, women’s clothes, restaurant meals, electricity and so on.

Because it can’t price everything, it zeros in on a few representative items within each category.

For meat and fish the ABS includes beef sausages (1kg) and pink salmon (210g can). For processed fruit and vegetables it includes sliced pineapple (450g can) and frozen peas (500g pkt).

If you buy something different, the exact changes in the prices you pay won’t be fed into either the consumer price index or your living cost index, but the indexes are likely to move in line with your living costs in any case.

Things get left out

Many things are missing from the index, among them recreational drugs, gambling and prostitution.

Being bean counters, rather than priests, the bureau says it excludes these sorts of items on practical rather than moral grounds.

Gambling is excluded as it is difficult to establish the service or utility that households derive from gambling, and thus to determine an appropriate price measure. Recreational drugs and prostitution are both excluded as it is very difficult and indeed dangerous to obtain estimates of prices and expenditures, or to measure quality change.

Other things are excluded because their prices are deemed to be too volatile. The price of bank deposits and loans was removed from the main index a few years back.

And goods keep getting better

Where our views about prices are most likely to differ from the bureau’s is where goods get better.

The bureau factors quality improvements into the measures prices it reports. If, for instance, your next mobile phone costs as much as your last one but includes extra features such as more memory or an improved camera, the ABS will report that it has fallen in price.

This sort of adjustment for quality makes sense when adjusting down the price of a can of baked beans because it has been replaced by one slightly bigger, but is a grey area when it comes to improved features.

If the speed of the chip on your next laptop doubles, does that really mean the laptop is twice as good as the old one and should be said to have halved in price? Or should its price be recorded as having fallen by a lesser amount, or not at all seeing as the price hasn’t changed and it remains a standard laptop?

Often older models with lesser features are often no longer available. It’s impossible to buy a cheaper replacement.

The CPI is infrequent

The Reserve Bank is worried about the frequency of the index. It comes out only once a quarter, and up to a month after the quarter has finished.

Every developed country other than Australia and New Zealand releases its index monthly.

Given that the bank considers changing interest rates once every month, and given that the consumer price index is one of the two key measures it uses to guide its decisions (the other is the unemployment rate), a quarterly index leaves it somewhat in the dark and (when things are changing fast) potentially dangerously misled.

The bureau responds that it is prepared to release its index monthly, if it is paid to do it.

The ABS is persuaded there would be a significant benefit from more timely and responsive economic management if a CPI of equivalent quality to the current quarterly index were available monthly. Additional funding will be required to meet the costs involved in compiling a monthly index.

It’s just what we need – bureaucratic blackmail.

But it’s improving

On the positive side, new technologies have allowed more accurate price collection to make the index more precise. A key innovation is the rise of so-called “scanner data”, tracking expenditures at checkouts based on the prices people actually pay.

Scanner data has been used since 2014 and is now responsible for about one quarter of the prices reported. Field officers compile much of the rest using hand-held devices to type in prices they read off supermarket shelves.

The move to scanner data was spearheaded by the work of my UNSW School of Economics colleague Professor Kevin Fox.

There is a prospect of it becoming more widespread as more and more purchases are made with debit and credit cards and with point-of-sale software on devices such as tablets at coffee shops.

And important

Whether or not we like what it says, the consumer price index is important and lies behind much of what we do.

A whole range of government payments and duties are indexed to it – these change when the consumer price index changes. Benefits such as Newstart and family payments are indexed as are excise duties such as those on petrol and beer.

Even the private sector relies on the consumer price index to adjust payments under contracts such as rental agreements or construction charges.

Collecting it is an enormous and painstaking exercise.

Governments of both stripes would do well to remember that when next they think of cutting the bureau’s budget.

Author: Richard Holden Professor of Economics and PLuS Alliance Fellow, UNSW

Retail Trade Remains In The Doldrums

The ABS released their latest statistics today for September 2018.  Households remain under pressure judging by the weak results.

In trend terms, overall retail turnover grew by 0.2% in the month. Within the segments, Other Retailing rose 0.6%, Cafes, Restaurants and Take Away Food rose 0.5%, Food Retailing 0.2%, Clothing, Footwear and Personal services was flat, while Household Goods fell 0.2% and Department stores fell 0.1%.

Across the states, TAS rose 0.5%, QLD and VIC both rose 0.3%, NSW rose 0.2% along with SA, ACT was flat, WA fell 0.1% and NT fell 0.9%.

Online retail turnover contributed 5.6 per cent to total retail turnover in original terms in September 2018, an unchanged result from August 2018. In September 2017 online retail turnover contributed 4.4 per cent to total retail.


Dwelling approvals fall in September 2018

The number of dwellings approved in Australia fell by 1.9 per cent in September 2018 in trend terms, according to data released by the Australian Bureau of Statistics (ABS) today.

Dwelling units approved
Graph: Dwelling units approved


Private sector houses approved
Graph: Private sector houses approved


“The fall was mainly driven by private dwellings excluding houses, which decreased by 2.7 per cent in September,” said Daniel Rossi, Director of Construction Statistics at the ABS. “Private sector houses also fell, by 1.5 per cent.”

Among the states and territories, dwelling approvals fell in September in the Australian Capital Territory (8.4 per cent), Northern Territory (6.9 per cent), South Australia (3.9 per cent), Queensland (2.3 per cent), Western Australia (2.1 per cent), New South Wales (1.3 per cent) and Victoria (1.0 per cent) in trend terms. Tasmania was the only state to see an increase in dwelling approvals (1.5 per cent) in trend terms.

Approvals for private sector houses fell 1.5 per cent in September in trend terms. Private sector house approvals fell in Queensland (3.1 per cent), South Australia (3.0 per cent), Western Australia (2.2 per cent) and Victoria (1.7 per cent). New South Wales recorded an increase of 0.5 per cent.

In seasonally adjusted terms, total dwellings rose by 3.3 per cent in September, driven by a 9.2 per cent increase in private dwellings excluding houses. Private houses fell 2.7 per cent in seasonally adjusted terms.

The value of total building approved fell 1.3 per cent in September, in trend terms, and has fallen for eleven months. The value of residential building fell 1.7 per cent while non-residential building fell 0.7 per cent.

Australian Economy Reaches over $1.8 trillion; Thanks To Households

The Australian Annual National Accounts released by the ABS today show that the size of the economy has reached over $1.8 trillion, reflecting a 2.8 per cent increase in 2017-18. This is up from the $1.2 trillion in 2007-08 in nominal terms.

Household consumption is a large part of the story, contributing 1.6pp though with incomes and the savings ratio falling, while investment in property is the standout. Households borrowed an additional $981 billion over the 10 year period from 2007-08, while the value of land and dwellings increased by $2,957 billion over the same period.  No wonder the regulators want to maintain the credit bubble. Household gross disposable income plus other changes in real net wealth decreased $634 billion, or 33.3%, in 2017-18, thanks mainly to falling property values.  Expect more falls ahead.

ABS Chief Economist, Bruce Hockman, said: “The Annual National Accounts provides further insights on the structure of the economy, using the latest economy wide supply-use data. The annual growth rate is consistent with the quarterly growth rates published for the June quarter.”

“Australia has now recorded its 27th consecutive year of economic growth and is performing above the 10 year average growth of 2.6 per cent,” Mr Hockman said.

In 2017-18 the largest industries in the Australian economy were financial and insurance services, mining, construction and health care and social assistance, representing over 30 per cent of the economy. In the past decade, the mining industry’s capital stock has more than doubled, reflecting strong mining investment over this time.

The Annual National Accounts also include labour productivity by industry estimates, which are only available annually. Australia’s labour productivity rose by 0.2 per cent, recording the lowest rise since recording a fall in 2010-11.

Agriculture, mining and utilities industries all recorded falls in labour productivity while services industries such as finance, professional, scientific and technical services as well as administrative support services were more productive.

They provided a series of data points to support the release:

The Australian economy expanded by 2.8% in chain volume terms in 2017-18, the 27th consecutive year of economic growth. Real net national disposable income grew 2.8%. The terms of trade increased 1.9% in 2017-18 following an increase of 14.3% in the previous year. Labour productivity in the market sector increased 0.4% while the household saving ratio fell to 3.5%.

Economic growth was driven by domestic final demand, which contributed 3.4 percentage points to growth while net trade in goods and services detracted 0.7 percentage points. Household final consumption expenditure (2.9%) contributed 1.6 percentage points. Strength in household final consumption expenditure was driven by both discretionary and essential consumption with increased spending in rent and other dwelling services, food, recreation and culture, insurance and other financial services, and hotels cafes and restaurants. Household spending on electricity, gas and other fuels decreased for the first time since 2013-14. Private business investment contributed 1.0 percentage point. Private business investment increased 8.5% following four consecutive falls with a rebound in non-dwelling construction (11.9%) driven by investment in renewable energy projects.

Mining value added continued to expand, recording its 14th consecutive annual rise. Most of the expansion in Mining came from Oil and Gas Extraction, reflecting new capacity coming online. The Heavy and Civil Engineering Construction industry recorded strong growth of 16.2% reflecting increased private and public investment in new engineering construction. Strong public expenditure in the health sector has translated to continued expansion in the Health Care and Social Assistance industry as it recorded its strongest growth since 2008-09. Service-based industries also contributed to growth, highlighting the economy’s transition to service delivery.

All income components of GDP recorded growth with the exception of public non-financial corporation gross operating surplus. Strong wage growth resulted in compensation of employees rising 4.5%, the strongest annual rise since 2011-12. Wage growth was evident in the Health Care and Social Assistance industry from both private and public sectors. This was largely driven by new hospitals coming online following government investment in previous years.

The chain price indexes for GDP and domestic final demand increased 1.9% and 1.4% respectively in 2017-18. The gap in price movements is reflected in the changes to the terms of trade.

During 2017-18, National net borrowing was $54.2 billion, driven by the issuance of shares and other equity by private non-financial sector reflecting strong foreign investment in Australian corporations.

AUSTRALIAN ECONOMY GROWS BY 2.8%

Australian Gross Domestic Product (GDP) grew by 2.8% in 2017-18. This represents a 0.1 percentage point downward revision from the annualised 2017-18 GDP estimates published in the June quarter 2018 national accounts. GDP per capita increased 1.2% as the Australian population grew by 1.6%.

GDP AND GDP PER CAPITA, Volume measures
Graph shows GDP and GDP per capita, Volume measures

DOMESTIC FINAL DEMAND DRIVES ECONOMIC GROWTH IN 2017-18

Economic growth in 2017-18 was largely driven by domestic final demand. Household consumption contributed 1.6pp while government consumption contributed 0.7 percentage points to GDP growth. Gross fixed capital formation contributed 1.0 percentage point. Net exports detracted from GDP growth in 2017-18, with imports of goods and services detracting 1.4 percentage points and partially offset by exports of goods and services which contributed 0.7 percentage points to GDP growth.

CONTRIBUTIONS TO GDP(E) GROWTH, Volume measures
Graph shows CONTRIBUTIONS TO GDP(E) GROWTH, Volume measures
Note: Contributions may not add to GDP growth due to the statistical discrepancy.

HOUSEHOLD CONSUMPTION GROWTH STRONGEST IN 6 YEARS

Household final consumption expenditure recorded growth of 2.9% in chain volume terms in 2017-18, reflecting growth in both discretionary and essential consumption.

HOUSEHOLD FINAL CONSUMPTION EXPENDITURE, Volume Measures
Graph shows HOUSEHOLD FINAL CONSUMPTION EXPENDITURE, Current prices

PRIVATE BUSINESS INVESTMENT RISES FOR FIRST TIME IN 5 YEARS

Private business investment recorded a 1.0% increase in 2017-18.

Non-mining investment grew at 13.5% in 2017-18, driven by investment in machinery and equipment and renewable energy projects.

Mining investment declined for a 5th consecutive year, however the rate of decline has moderated with a fall of 4.1% recorded for 2017-18.

Investment in dwellings remains at an elevated level, reflecting continued residential construction activity in both detached and attached dwellings.

PRIVATE CAPITAL INVESTMENT, Volume Measures
Graph shows PRIVATE CAPITAL INVESTMENT, Volume Measures
Note: Excludes Ownership transfer costs

MINING CONTINUES TO GROW AS GAS PRODUCTION INCREASES

The Australian economy has changed dramatically over the past 20 years as reflected by changes in contribution to gross value added.

In 2017-18 the industries with the largest share of current price gross value added (at basic prices) were Financial and Insurance Services (9.5%), Mining (8.8%) and Construction (8.1%).

Mining recorded a growth of 2.9% in 2017-18 (2.9%) driven by Oil and Gas Extraction. Growth in Oil and Gas Extraction was due to large projects entering production phase during the year.

Health Care and Social Assistance rose 6.3% in 2017-18 resulting in it becoming the fourth largest industry. Growth in 2017-18 reflects strong public expenditure in the health industry, recording its strongest growth since 2008-09.

Strong private and public investment was reflected in the growth of value added of the Construction industry (5.1%) with Heavy and Civil Engineering Construction recording a strong rise of 16.2%.

INDUSTRY SHARES OF GROSS VALUE ADDED – Selected industries, Current prices
Graph shows INDUSTRY SHARES OF COE - Selected industries, Current prices
Note: GVA at basic prices of industries as a proportion of total GVA at basic prices

COMPENSATION OF EMPLOYEES SHARE OF TOTAL FACTOR INCOME FALLS

In 2017-18 compensation of employees (COE) share of total factor income fell to 52.4%, recording its lowest level in seven years. This share is still higher than the lowest level recorded but lower than the 10 year average of 53.0%.

In 2017-18 the profit’s share (based on gross operating surplus for corporations) of total factor income was 27.6%. This is the highest level since 2011-12, but is still below the peak of 29.0% seen in 2008-09.

A major contributor to this rise in profit share of total factor income was Mining which was impacted by the continued strength in the terms of trade. The profit share measure should not be interpreted as a direct measure of ‘profitability’ for which it is necessary to relate profits to the level of capital assets employed.

WAGES SHARE OF TOTAL FACTOR INCOME
Graph shows WAGES SHARE OF TOTAL FACTOR INCOME


PROFITS SHARE OF TOTAL FACTOR INCOME
Graph shows PROFITS SHARE OF TOTAL FACTOR INCOME

CHANGES TO INDUSTRY COMPENSATION OF EMPLOYEES OVER TIME

Industry shares of total COE changed significantly for some industries between 1997-98 to 2017-18. Over these two periods, the share of COE for the Health Care and Social Assistance, Professional, Scientific and Technical Services, and Construction industries increased in 2017-18 compared to 1997-98. This is contrary to the Manufacturing, and Finance and Insurance Services industries, where the shares of COE fell.

These changing patterns of industry shares of COE at these two points in time are also reflective of each industry’s contribution to total employment.

INDUSTRY SHARES OF COE – Selected industries, Current prices
Graph shows INDUSTRY SHARES OF COE - Selected industries, Current prices

HOUSEHOLD SAVING RATIO DECLINES

The household saving ratio is another key aggregate in the national accounts. While household saving is not measured directly, it is calculated by deducting household final consumption expenditure from household net disposable income.

The household saving ratio continued to fall in 2017-18, recording 3.5%, its lowest level in nine years. The fall in net saving as a proportion of net disposable income can be attributed to strength in household final consumption expenditure coupled with growth in income tax payable by households.

HOUSEHOLD SAVING RATIO
Graph shows HOUSEHOLD SAVING RATIO

GDP CHAIN PRICE INDEX GROWTH DRIVEN BY STRONG CAPITAL INVESTMENT COSTS

The GDP chain price index increased 1.9% in 2017-18. While not as strong as 2016-17, rises in coal and LNG prices were again significant contributors to the increase in export prices through 2017-18. Strong demand and rising input costs drove increases in capital investment costs, while rising fuel and utility prices drove household consumption prices.

CHAIN PRICE INDEXES
Graph shows CHAIN PRICE INDEXES

MARKET SECTOR MULTIFACTOR PRODUCTIVITY INCREASES

Market sector multifactor productivity (MFP) grew 0.5% in 2017-18. This result reflects a 2.7% increase in gross value added and a 2.2% increase in combined inputs of labour and capital services. On a quality adjusted hours worked basis, MFP rose 0.2%, reflecting changes in labour composition.

On an hours worked basis, labour productivity grew 0.4%, reflecting the strengthening growth in hours worked of 2.4%. On a quality adjusted hours worked basis, labour productivity fell 0.2%.

MARKET SECTOR PRODUCTIVITY– Hours worked basis

Graph shows MARKET SECTOR PRODUCTIVITY, Hours worked basis

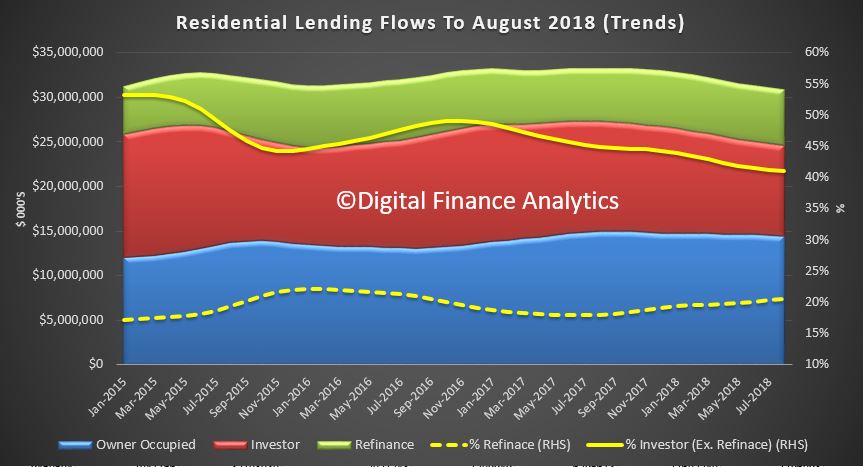
LOW INTEREST RATES ENTICE HOUSEHOLDS TO INVEST IN DWELLINGS AND LAND

Interest rates have been at historically low levels for a number of years, which has reduced the pressure on households in terms of the proportion of income spent on paying interest on mortgages. Interest on dwellings accounted for 3.6% of total household gross income in 2017-18, compared to 6.0% in 2007-08. This has encouraged households to expand their balance sheets through investment in land and dwellings. Household net worth grew $343 billion, or 3.4%, through 2017-18.

Households borrowed an additional $981 billion over the 10 year period from 2007-08, while the value of land and dwellings increased by $2,957 billion over the same period. Growth in land and dwellings owned by household has slowed from an increase of $720 billion annually in 2016-17 to an increase of $131 billion in 2017-18. This was driven by slow growth in the value of land, while growth in dwelling stock remained steady.

In 1988-89, the value of land and dwellings held by households was 5.1 times the value of household borrowing. By 2007-08 this ratio was at 3.2, and it has remained relatively stable since. In 2017-18, land and dwellings owned by household covered their borrowing 3.1 times. The value of loans carried on the household balance sheet in 2017-18 are now 14.1 times higher than at 1988-89, whereas the value of land and dwellings is 8.5 times higher. While a lower share of household income is spent on mortgage interest than around the time of the Global Financial Crisis, the gap between the value of land and dwellings held by the household sector and the level of household borrowing is narrowing over time.

HOUSEHOLD INTEREST PAYABLE ON DWELLINGS – Relative to total gross household income, Current prices
Graph shows HOUSEHOLD INTEREST PAYABLE ON DWELLINGS - Relative to total gross household income, Current prices


HOUSEHOLD LAND AND DWELLING ASSETS – Relative to loans, Current prices
Graph shows HOUSEHOLD LAND AND DWELLING ASSETS - Relative to loans, Current prices

HOUSEHOLD INCOME AND WEALTH

Household gross disposable income plus other changes in real net wealth decreased $634 billion, or 33.3%, in 2017-18. This was largely due to a $636 billion decline in the value of land held by households.

Living standards and economic well-being are supported by wealth as well as income. The growth rate of gross disposable income has slowed in recent years. However, households reap gains and incur losses from holding assets, such as land, dwellings, equities and accumulated saving, which also bears on consumption patterns.

HOUSEHOLD INCOME AND WEALTH, Current prices
Graph shows HOUSEHOLD INCOME AND WEALTH, Current prices

Trend Unemployment Falls To Six Year Low

The trend unemployment rate remained steady at 5.2 per cent in the month of September 2018 after the August figure was revised down, according to the latest figures released by the Australian Bureau of Statistics (ABS).

The 5% seasonally adjusted result will get all the attention, but these are very volatile, so it is best to work with the trend data, which shows a fall, although participation remains steady. But underemployment remains higher than post the GFC.

“Today’s figures continue to show a gradual decrease in the trend unemployment rate that began in late 2014. The trend unemployment rate of 5.2 per cent is the lowest it has been since mid 2012.” said the Chief Economist for the ABS, Bruce Hockman.

Chart of the trend and seasonally adjusted unemployment rates from January 2012 to September 2018.

Employment and hours

Trend employment increased by around 26,000 persons in September 2018 with full-time employment increasing by over 21,000 persons.

The trend participation rate remained steady at 65.6 per cent in September 2018.

Over the past year, trend employment increased by over 290,000 persons or 2.4 per cent, which was above the average year-on-year growth over the past 20 years (2.0 per cent).

The trend monthly hours worked increased by 0.2 per cent in September 2018 and by 1.8 per cent over the past year.

States and territories

The states and territories with the strongest annual growth in trend employment were New South Wales (3.4 per cent) and Victoria (2.6 per cent). New South Wales and Victoria were the only states and territories to record year-on-year growth above their 20-year averages.

Seasonally adjusted data

The seasonally adjusted number of persons employed increased by around 5,600 persons in September 2018. The seasonally adjusted unemployment rate decreased to 5.0 per cent and the labour force participation rate decreased to 65.4 per cent.

The net movement of employed in both trend and seasonally adjusted terms is underpinned by well over 300,000 people entering employment, and more than 300,000 leaving employment in the month.

New underemployment data

The trend underemployment rate decreased to 8.3 per cent in September 2018 and the trend underutilisation rate decreased to 13.5 per cent.

The ABS also published a piece on underemployment.

AUSTRALIA’S UNDEREMPLOYMENT OVER TIME

As of September 2018, Australia’s trended underemployment rate (the proportion of underemployed to the total labour force) remained high in historical terms at 8.3%, but below the peak of 8.8% recorded in March 2017.

The underemployment rate has been increasing since it was first recorded in the February 1978 reference period. Over the last four years, the rate has seen minimal fluctuation, remaining between 8.3% and 8.8% in trend terms. The underemployment rate showed large increases over economic downturns – most notably during the early 1990s and the Global Financial Crisis (GFC) (refer to Graph 1).

Graph 1, Underemployment and unemployment rates trended, February 1978 to September 2018

Underemployment and unemployment rates trended, February 1978 to February 2018.
a. The monthly data for part-time workers who want to work more hours, between April 2001 and June 2014, is modelled as data during this period was collected quarterly.

Home Lending Flows Fall In August

The ABS released housing finance statistics today to the end of August 2018. The most striking observation is that lending flows for owner occupied buyers appear to be following the lead from the investment sector. Both were down. This is consistent with our household surveys.

Looking at the original first time buyer data, the number of new loans fell from 9,614 in July to 9,534 in August, a fall by 80, or 0.8%.  As a proportion of all loans written in the month, the share by first time buyers fell from 18% to 17.8%.

The number of non-first time buyers remained about the same. The average first time buyer loan fell just a little to $345,000. Looking at the DFA investor segment of first time buyers – which is not reported in the official data, there was a further fall.

Thus our overall first time buyer tracker reveals a further slide in activity. Perhaps more are wanting to catch a bargain in a few months, although our surveys suggested the main issue is the inability to get a loan in the now tighter lending environment.

Looking at the trend lending flows, the only segment of the market which was higher was a small rise in refinanced owner occupied loans.  These existing loans accounted for 20.5% of all loans written, up from 20.3%, and we see a rising trend since June 2017, from a low of 17.9%.  Total lending was $6.3 billion dollars, up $31 million from last month.

Investment loan flows fell 1.2% from last month accounting for $10 billion, down 120 million.  Owner occupied loans fell 0.6% in trend terms, down $81 million to $14.5 billion. 41% of loans, excluding refinanced loans were for investment purposes, the lowest for year,  from a high of 53% in January 2015.

Looking at the moving parts, only refinance, and owner occupied construction loans rose just a little, all other categories fell.

On these trends,remembering that credit growth begats home price growth, the reverse is also true.  Prices will fall further, the question remains how fast and how far? We will be revising our scenarios shortly.

Trend Retail 0.2% Growth In August

The trend estimate for Australian retail turnover rose 0.2 per cent in August 2018, following a 0.3 percent rise in July 2018. Compared to August 2017, the trend estimate rose 3.4 per cent, according to the latest Australian Bureau of Statistics (ABS) Retail Trade figures.

In trend terms, Other retailing (0.6 per cent) led the rises. Rises were also seen in Clothing, footwear and personal accessory retailing (0.3 per cent), Cafes, restaurants and takeaway food services (0.4 per cent), and Food retailing (0.2 per cent). Department stores fell  (-0.1 per cent), and Household goods retailing fell  (-0.2 per cent).

Seasonally adjusted, Australian retail turnover rose 0.3 per cent in August 2018, following a relatively unchanged estimate (0.0 per cent) in July 2018.

In trend terms, there were rises in New South Wales (0.3%), Victoria (0.3%), South Australia (0.2%), Queensland (0.2%), Tasmania (0.5%), and the Australian Capital Territory (0.3%). Western Australia fell (0.1%), whilst there was a more significant fall in the Northern Territory (-0.5%).

Online retail turnover contributed 5.6 per cent to total retail turnover in original terms in August 2018, a rise from 5.5 per cent in July 2018. In August 2017 online retail turnover contributed 4.6 per cent to total retail.

Residential Building Approvals Fall In August 2018

We discuss the latest building approvals and Cranes Index data. Residential construction is taking a dive.

Please consider supporting our work via Patreon

Please share this post to help to spread the word about the state of things….

Economics and Markets
Residential Building Approvals Fall In August 2018
Loading
/