
On the day the final report is published, we discus the main recommendations.
The Royal Commission Recommendations
The final report from the Banking Royal Commission has been released, and it makes interesting reading. Here is a brief summary of the 950 pages. More to follow.
At the high level, the greed driven attitudes of the industry are highlighted as leading to the poor practice and illegal behaviour. This was driven by high pressure sales tactics. As a result the community trust in the financial sector has been lost. Change is needed – and culture of the entities and their boards are at the heart of it.
Consumers must be treated honestly and fairly.
The Treasurer says it was a scathing assessment driven by greed and poor behaviour. The price paid was financial, but also hitting people directly. Trust needs to be restored, whilst keeping competition, and the flow of credit.
Consumers will benefit from better protection. It will raise accountability and governance, enhance regulation, and provide for effective remediation.
It does not remove the twin peaks model, (APRA and ASIC).
More than 20 referrals to the regulators for criminal charges. No individuals were named.
The report has 76 Recommendations covering a wide range of issues. The Government says its will “take action” on them all. (Does not mean full implementation).
Of note is the establishment of a new super regulator to sit across APRA and ASIC to gauge their effectiveness and clarify roles and responsibilities. The Federal Court will have extra responses to progress the referrals.
Mortgage brokers will have a best interests duty and trailing commission will be banned in due course (July 2020). In addition there is a recommendation to move to fee for service paid by customers though the Government is slowing any such change (a 3 year review in the view of the impact of competition).
There will be one account for new superannuation savers and fees to be banned from My Super accounts. Changes to the add on to insurance via a cooling off period.
A Compensation scheme of last resort.
Expansion of the BEAR cultural framework.
No changes to responsible lending – its all about policing and compliance.
Nothing on structural separation, or horizontal or vertical integration. So the industry structure remains untouched.
The legislative response seems muted, and delayed to kick the burden down the track, after the election.
So my take is some progress, but not as much as perhaps many will wish for….
Decoding 60 Minutes
A quick review of the DFA contribution to 60 Minutes aired last night.
We covered the issues of home price falls, negative equity and property construction standards.
See our more detailed post on negative equity.
Dwelling approvals decline in December
The number of dwellings approved in Australia fell by 4.1 per cent in December 2018, in trend terms, according to data released by the Australian Bureau of Statistics (ABS) today.

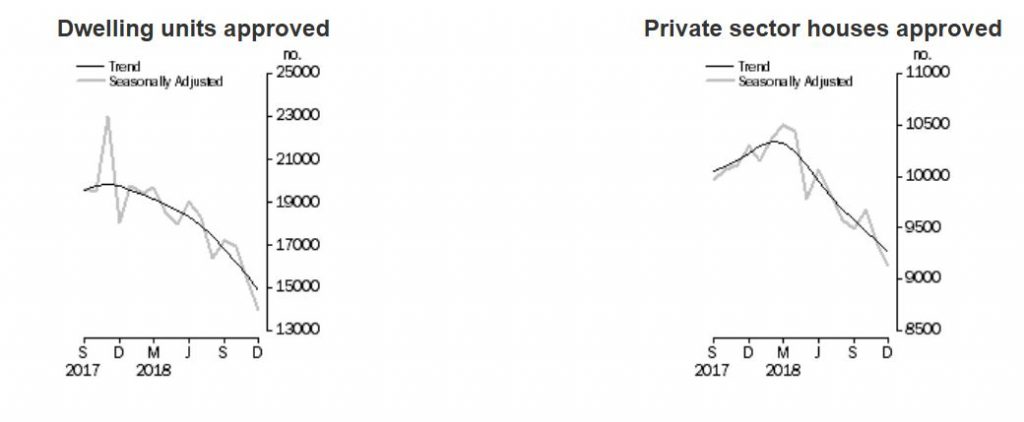
“The trend for the total dwelling approvals series has continued to decline over the past year,” said Daniel Rossi, Director of Construction Statistics at the ABS. “The series is now at its lowest level since June 2013.”
The decrease in December was driven by private sector dwellings excluding houses (e.g. townhouses and apartments), which fell 8.5 per cent. Private sector houses also declined, by 1.1 per cent.
Among the states and territories, dwelling approvals fell in December in the Australian Capital Territory (21.3 per cent), Queensland (6.5 per cent), New South Wales (5.0 per cent), Western Australia (3.8 per cent), South Australia (1.5 per cent) and Victoria (1.4 per cent) in trend terms. The Northern Territory (1.7 per cent) and Tasmania (1.1 per cent) recorded increases.
Approvals for private sector houses fell 1.1 per cent in December in trend terms. Queensland (3.6 per cent), New South Wales (1.6 per cent) and Western Australia (0.6 per cent) declined, while increases were recorded in South Australia (0.6 per cent) and Victoria (0.2 per cent).
In seasonally adjusted terms, total dwellings fell by 8.4 per cent in December, driven by a 18.8 per cent decrease in private dwellings excluding houses. Private houses also fell 2.2 per cent.
The value of total building approved fell 1.5 per cent in December, in trend terms, and has fallen for the past 13 months. The value of residential building fell 2.6 per cent, while non-residential building rose 0.2 per cent.
ASIC requires Commonwealth Financial Planning Limited to stop charging fees for ongoing services
ASIC says Commonwealth Financial Planning Limited (CFPL) has failed to provide ASIC with an attestation and with an acceptable Final Report from the independent expert, both of which were required under a Court Enforceable Undertaking (EU) entered into with ASIC in April 2018 in relation to CFPL’s fees for no service conduct.

As a result, CFPL is now required under the EU to immediately take all necessary steps to:
- stop charging or receiving ongoing service fees from its customers; and
- not enter into any new ongoing service arrangements with customers.
The EU, which commenced on 9 April 2018 and was varied on 20 December 2018, required CFPL to provide to ASIC by 31 January 2019:
- a Final Report by the independent expert, Ernst & Young, on whether CFPL had taken reasonable steps to remediate customers impacted by CFPL’s fees for no service conduct and on the adequacy of CFPL’s systems, processes and controls; and
- to provide an attestation from a Commonwealth Bank ‘accountable person’ under the Banking Executive Accountability Regime as to CFPL’s remediation program, and the adequacy of CFPL’s systems, processes and controls.
On 31 January 2019, Ernst & Young issued its second report under the EU, identifying further concerns regarding CFPL’s remediation program and its compliance systems and processes – including that there remains ‘a heavy reliance’on manual controls, which ‘have a higher inherent risk of failure due to human error or being overridden’. Ernst & Young recommended CFPL address these issues within a further 120 days.
On the same day, CBA’s accountable person provided a written update to ASIC on the remediation program and work being done in relation to CFPL’s systems, processes and controls. Having regard to the concerns raised by the independent expert and the contents of CBA’s written update, ASIC considered that the notification did not meet ASIC’s requirements under the EU for an acceptable attestation.
As a result, ASIC’s requirement under the EU that CFPL stop charging or receiving ongoing service fees and not enter into any new ongoing service arrangements, has been triggered. ASIC included this requirement in the EU to ensure that if CFPL were not able to satisfy ASIC that the fees for no service conduct would not be repeated, CFPL would have to stop charging ongoing service fees so as to significantly reduce any further risk to clients. Existing clients will continue to receive services under their ongoing service agreements but will not be charged by CFPL.
ASIC has received CFPL’s confirmation that it is complying with this requirement to stop entering into new ongoing service agreements and to cease charging existing clients fees under these agreements. This requirement will continue until CFPL is able to satisfy ASIC that all of the outstanding issues have been remedied. ASIC will be monitoring CFPL’s compliance with this obligation.
ASIC has also been informed by CFPL that it is now in the process of transitioning its ongoing service model to one whereby customers are only charged fees after the relevant services have been provided. ASIC will monitor CFPL’s transition to the new model.
Background
Under CFPL’s remediation program overseen by ASIC, CFPL has to date reported to ASIC that it has paid approximately $119 million to customers impacted by its fees for no service conduct.
The Negative Equity Hot Spots
As featured on 60 Minutes, using data from our core market model we have mapped the hot spots across the country, as home prices fall.
Negative equity is a brake on mobility and economic growth and is the result of rabid home lending and price growth, now going into reverse.
This show discusses our approach, and highlights the most impacted post codes, with data to end January 2019.
We will run the modelling again next month, as prices continue to move.
Falling, Falling and The Phony War – The Property Imperative Weekly 02 Feb 2019
Welcome to the Property Imperative weekly to the second of February 2019 – our digest of the latest finance and property news with a distinctively Australian flavour.
Watch the video, or read the transcript.
As we wait for the public release of the Royal Commission Banking report on Monday, the slew of local data pretty consistently underscored the risks to the downside, and more home price falls, as the polys tried to position around future credit supply. At least it seems they now accept that credit supply drives home prices. And internationally, as growth slows, we see more signs of another round of low interest rates and quantitative easing emerging. This is the calm, before the storm, or the phony war.
And by the way if you value the content we produce please do consider supporting our efforts. You can make a one off donation via PayPal or consider joining our Patreon programme. We really appreciate those who are contributing to help us continue to make great content.
First, we look at Australian home prices, which according to CoreLogic’s Home Value Index fell heavily in January, having fallen by the most since 1983 in December. This time the weakness was not just driven by falls in Sydney and Melbourne, the losses last month were spread across the nation, falling in all capital cities except for Canberra and in regional centres. The declines were almost everywhere, down another 1% during the month, so extending the national downturn that began in late 2017 to 6.1%. Australia’s median home price now sits levels last seen in October 2016 with prices declining in 13 of the past 15 months.
Price declines ranged from 1.6% in Melbourne to 0.2% in Hobart, leaving the falls across the combined capitals at 1.2%. That decline followed a 1.3% drop in December, so there’s little sign the downturn is slowing in early 2019. House prices across the capitals fell by 1.2% from December, led by falls of 1.7%, 1.4% and 1.1% respectively in Melbourne, Sydney and Perth. For apartments, capital city prices eased by a slightly smaller 1.1%, again driven by declines of over 1% in Melbourne, Sydney and Perth, along with a chunky 3.1% drop in Darwin. In regional areas, house and apartment prices both fell by 0.2%.
In the past three months, median prices in Sydney and Melbourne fell 4.5% and 4% respectively, the fastest pace at any point in the current downturn. Combined with more modest declines in Brisbane, Adelaide, Perth and Darwin, that left Australia’s median capital city home price down 3.3% over the past three months, extending the decline over the past year to 6.9%. The latter figure largely reflects falls of 9.7% and 8.3% respectively in Sydney and Melbourne since January last year. Sydney prices are now back to where they were in July 2016, while those in Melbourne sit at levels last seen in in January 2017.
Sydney and Melbourne contain around 40% of Australia’s total housing stock, and account for around 55% of the nation’s total housing wealth. That makes movements in those cities highly influential on the national figure. In regional centres, median prices fell by a more modest 0.6% over the past three months, and by 0.8% over the past year.
CoreLogic says “Weakness across the most expensive quarter of the market is most visible in Melbourne where values have fallen 12.4% over the past 12 months and 13.8% since peaking. Sydney’s top quartile is showing a similar trend with values down 10.8% over the past year and 14.6% since they peaked.” Over the past year, capital home values in the top quartile of valuations have fallen 9.9%, faster than the broader capital city average over the same period. Median prices at lower quarter of valuations have generally fared better across the smaller capitals, although they have still declined in Sydney and Melbourne over the past year.
Credit availability is the key – see our post “The Art Of Credit Creation”. As credit continues to tighten, so prices will fall.
But it is worth underscoring, the tighter conditions, are merely reflecting the responsible lending rules, which were being broken by lenders in spades until recently. Household Expenditure Measures or HEM benchmarks were set too low, allowing people to get loans they can never repay, and often on an interest only basis. Rules are tighter now, thanks to the Royal Commission and APRA’s belated interventions, but housing credit is still growing faster than wages or inflation, so household debt ratios will still rise further. Any call to release the taps is a call to encourage illegal behaviour. I will be interested to see the Commission’s final view on whether HEM is banned, or adjusted up as a back stop. But I do not expect credit growth to magically pick up. The report was handed to the Treasurer on Friday – with no handshake, I might add, and David Rowe, the cartoonist summed it all up rather well. Monday 16:10 is the public release.
As we discussed, in our show “Credit Growth Is Slowing but Still Reaches Another New Record”, the latest RBA and APRA credit stats show owner occupied housing debt is still rising at an amazing 6.5% annualised, and all housing is still growing at 4.7%. In fact, we see the growth being driven by the less regulated non-bank sector, which grew at an estimated 16% last year, and smaller banks. However even at these still elevated levels, the so called credit impulse (the rate of change of credit growth) is slowing, and as ANZ said, this housing credit “impulse” fell to fresh cyclical lows in December, which points to the likelihood of further price weakness ahead. ANZ concluded “This is consistent with our view that house prices will continue to decline through 2019.”
Now of course the debate has become political, with Treasurer Josh Frydenberg conceding the banking royal commission contributed to a credit squeeze, with the big banks less likely to loan money for home mortgages and small business. But the Treasurer warned that ensuring that Australians still had access to affordable credit was also vital to the economy. “The royal commission has had an impact, I think, in terms of how banks have approached finance,” he told The New Daily.
In an opinion piece penned for The Australian Financial Review this week, Westpac boss Brian Hartzer dismissed suggestions the Royal Commission had made banks “scared to lend”. “Let’s be clear, we want to lend,” wrote Hartzer. However, he also revealed that new Westpac borrowers are now subject to scrutiny across 13 categories of expenses before they can get a loan.
In the meantime, the panic builds around the credit squeeze, at The Australian: Small business ombudsman Kate Carnell has called on the Hayne royal commission, policymakers and regulators to work harder to get small and medium business on a firmer footing against the banks or risk a “credit squeeze” in the $300 billion sector. Ms Carnell said despite the royal commission, the banks were still shying away from making real commitments to small business customers, including in their revised code of conduct, which gave them lots of “get-out clauses”.
And Chris Joye in the AFR went all out political this week saying “If Prime Minister Scott Morrison pulls off a miracle and wins the May election, housing conditions should stabilise as investors pile back into the market to pick up cheap assets once the threat of Labor’s deleterious tax changes is removed. He said “I also expect the accessibility of credit to improve following the royal commission, which has wasted time questioning residential lending practices that are among the most conservative in the world judged on the basis of Australia’s mortgage default rates over the last 30 years (notwithstanding that our home loan rates have been lofty by global standards). If, on the other hand, Labor prevails, our extant forecast of a housing drawdown of up to 15 per cent stands, with values in cities such as Sydney likely to fall by more than 20 per cent.
This I think typifies the political spat ahead, where Labor will be teed up as the party to crash home prices further; while the incumbents, will miraculously open the credit taps and lift prices higher. I do not believe the political phony war. Not only would this be irresponsible as debt is too high a burden at the moment, lending standards need to be adhered to. And the broader negative impacts of the slowing housing sector are already biting, and will continue to bite.
For example, UBS says home sales collapse to 21-yr low which is very negative for renovations & consumption. Home sales declined further, slumping to near the lowest level in 21 years. The pace of falls accelerated from a trend of -10% y/y, to around -16% now. The turnover rate (sales divided by stock) collapsed to a ~record low recently. This is a very negative lead indicator for the renovations market and housing-related consumption. The UBS credit tightening thesis is playing out, with accelerating weakness in home prices, sales, approvals & credit growth. The peak-to-trough decline in home prices is still ‘only’ 6%. We have long expected a 10% drop, or more if regulators don’t ease. But now that APRA has effectively ruled out further macroprudential easing, the risk of an even larger fall has increased. If there is a policy maker desire to support housing, given increasing evidence of a negative spill over to the rest of the economy, it would need to cut via the RBA cutting the cash rate.
And this week, as UBS said, we got confirmation from APRA that they will not loosen the lending rules, keeping the floor rate at 7%, and warning that “many of the underlying structural risks associated with high household debt remain and will do so for some time”. Too true, we have had a credit driven boom for a generation, and now the tide is turning. The credit taps are NOT going to be opened further, as now bankers are on notice of the legal and financial consequences of bad lending. Indeed, it is possible the Royal Commission will recommend some criminal proceedings, but we will see.
Meantime. The broader economic outlook is weakening in Australia. The ABS reports that the Consumer Price Index (CPI) rose 0.5 per cent in the December quarter 2018, which follows a rise of 0.4 per cent in the September quarter. This means that inflation, on the official measures remains BELOW the RBA’s target range of 2-3%, at 1.8% and may suggest more of a bias towards cutting the cash rate (as we have been suggesting for some time). Of course the “official” figures bear little resemblance to the real lived experience of many households – and the rental proxy for housing in the figures is understating the real expense of many with mortgages. In fact, one reason why the RBA policy levers look pretty sick is the fact that TRUE inflation in real households is closer to 3.5%, on average and for some even higher. They dropped the cash rate too far and now cannot recover.
But as Damien Boey at Credit Suisse put it, CPI, unemployment and RBA forecast downgrades are becoming old news. The Consensus view is that the RBA will moderately downgrade its forecasts, but not capitulate on its rate stance next Tuesday. On the RBA’s narrow list of criteria for setting rates, the economy is evolving within its desired parameters. The unemployment rate is at a cyclical low of 5% (as forecast), and CPI inflation is around 1.75% (also as forecast). And we also know that in the “Lowe-era”, the Bank is more macro-prudentially minded than not. Therefore, it is willing to suffer growth and inflation undershoots for the sake of not cutting rates, and not inflaming the household debt situation. In the extreme, this means that even if GDP growth were to slow to 1-2%, and inflation follow suit, the Bank would not cut rates.
Looking at the data, there are reasons to be concerned, even for the hawks at the RBA. Real GDP only grew by 0.3% in 3Q. In 4Q, things look worse. Net exports could subtract 0.5-0.8% from GDP growth. Residential investment likely fell. Infrastructure spending probably plateaued at a high level. Consensus is looking for 0.7% real retail sales growth – but this assumes something very generous for December, when we already know from higher frequency data that spending was weak. For example, the NAB cashless retail index maps to an 0.3% contraction in nominal retail sales, while vehicle sales plummeted over the month. In lieu of all these data points, if 4Q can repeat 3Q’s performance on the back of inventory build and other miscellaneous spending, this will be a very good outcome! But even so, 2-quarter annualized growth will only be running at 1.2%, well short of the RBA’s forecasts. Slower growth leads to slower inflation. And slower inflation leads to higher real borrowing costs, even before we factor in out-of-cycle rate hikes. So financial conditions are tight, and possibly tightening in the absence of intervention.
At some point, the money market will compel the RBA to cut. Probably not yet. But the pricing is becoming too dovish to ignore. And we expect the dovishness to continue, as Australian yields fall relative to US yields, which themselves are now falling on a more dovish Fed.
And Morgan Stanley said “We have removed rate hikes from our 2020 outlook, as our AlphaWise research points to fragility in the household sector and a more prolonged consumer adjustment.” “Weakness in the housing/consumer sectors should continue through 2019, and we think further forecast downgrades from the RBA and the adoption of an easing bias is likely. “Offsets elsewhere in the economy – especially government sector, should help absorb some spare capacity and see only a moderate rise in joblessness, which would leave the RBA comfortable keeping rates on hold.”
But the latest from Westpac’s Red Book shows the subindexes tracking views on ‘family finances’ and ‘time to buy a major item’ easing down 2.4% from 90.7 in Oct to 88.5 in Jan, the lowest read since Sep 2017. The index remains a long way below its long run average (–14pts) and is pointing to per capita spending falling about 1%yr. With population growth at 1.6%yr that implies aggregate spending growth of just 0.5%yr, well below the current 2.5%yr. Plus the Q3 national accounts provided another weak update on the consumer, spending undershooting expectations, real disposable income essentially flat and a further decline in new savings pointing to vulnerability going forward. Weak incomes meant the rise in spending was again partially ‘funded’ by lower savings – the savings rate falling from an upwardly revised 2.8% in Q2 to 2.4% in Q3, a post GFC low. This highlights clear vulnerabilities going forward given risks around potential wealth effects. Anecdotes suggest Christmas sales were weak with consumer sector responses to the NAB business surveys also showing a sharp weakening late in the year. Overall, developments over the last 3mths have prompted us to mark down our 2019 and 2020 forecasts for growth in consumer spending – from 2.8%yr to 2.4%yr. Downside risks continue to dominate.
Elsewhere Westpac said the September quarter GDP report has disrupted the RBA’s comfortable position on the growth outlook. With growth only printing 0.3% in that quarter it would be necessary for the December quarter to print 1.2% to achieve the November forecast of 3.5%. The 2018 growth forecast is likely to be lowered from 3.5% to 3.0%. But what will this mean for the 2019 and 2020 forecasts? We know that the Bank has assessed a minimal wealth effect on consumption and the Q3 growth report is unlikely to have changed that view. Even further negative evidence on house prices in Sydney and Melbourne is unlikely to change the qualitative assessment that the wealth effect was minimal while house prices were booming and therefore will be minimal in reverse. RBA Director Harper recently played down any evidence of a wealth effect in an interview with Dow Jones late last week.
And developers are feeling the pinch, as the Australian reported: “It may be as bad as last year, it may be worse,” developer, High Rise Harry Triguboff said of the outlook for 2019. While foreign buyers were returning, it was only in small numbers and Australian buyers were staying away. It must affect the broader economy and he called on governments to relax the foreign buyers taxes in a bid to revitalise the housing and construction sectors. He also called for early access to superannuation to allow younger people to buy a home.
Finally, research house Endeavour downgrading their outlook for residential property in 2019; expecting peak to trough falls of 25-30% – the worst since 1890. They expect -10 to -15% % in 2019 in addition to falls of -15% in 2018.This means 2014 vintages will see significant losses while many from 2015, 2016 and 2017 will experience negative equity.
They say “We expect a continuation of the 2018 Credit Crunch well into 2019 as the HEM/ non-prime bubble busts due to the combined impact of i) real expenses shifting sharply towards a ABS HES Survey reality and ii) amortization of Interest Only loans. Together these impacts are expected to hit loan borrow sizes for aggressively geared borrowers by 46%+, savaging borrowing capacity for the marginal price setter of housing in the boom to 2016. The Size of the Credit Crunch is directly proportional to the unreasonableness of the HEM expenses benchmark. Since HEM expense estimates are unreasonably low, the credit crunch will be significant and ongoing as it is increasingly replaced with reasonable expenses that are consistent with Responsible Lending Laws. The Median Borrower on a HH income of $144k HEM understated expenses by $48k p.a. leading to loan sizes 30%+ or $380k larger than if HES based survey expenses were used. For the median debt which is owned by households on $180k+, the understatement of expenses is considerably larger – up to a total of $80k. This led to loan sizes $640k larger than if HES expenses had been used. Failure to amortize Interest Only Loans over the non IO periods in serviceability calculators has also inflated loan sizes 20-30%+. So in summary, a challenging environment for Banks as Credit Slump hits volumes and Arrears rise
And talking of house price falls, and negative equity, watch the latest edition of Nine’s 60 Minutes which will air on Sunday, and update our research and price expectations. Here is a preview, where I discuss the latest with Ross Greenwood. 40% falls anyone?
So to the markets. Locally, the ASX 100 ended at 4,832, down 2.65% on Friday. The local volatility index was 1.78% on Friday to 13.80 up 11.7% compared with a year ago, so still relatively elevated. The S&P Financials index was down a little to 5,545, and down 14.4% compared with a year ago – the Hayne effect is clearly visible, plus concerns about international funding costs as shown by the still elevated BBSW rates, Of course this week, more banks lifted mortgage rates in response, including ING and ME Bank and expect more to follow NAB’s lead.
ANZ ended down 0.4% to 24.93, 12.84% lower than a year ago. CBA dropped 0.21% to 69.76, down 11.27% from this time last year, NAB fell 0.29% to 23.79, down 18.73% from a year back, and Westpac was up 0.12% to 24.58, but down 20.82% from a year ago – Westpac of course has the largest share of investor mortgages on their book, and are in dispute with ASIC over the use of HEM. Among the regionals, Bank of Queensland was up 0.59% to 10.23, but down 17.76 from last year, Suncorp was up 1% to 13.11, and down just 4.32% over the year. Bendigo and Adelaide Bank was flat at 10.78, but down 7.69% over the year and AMP, who may be expected to get a copping from the Commissions’ final report was down 0.88% to 2.24, down a massive 56.57% since the crisis. Macquarie was down a little, to 116.41, but up 13.03% from this time last year, while Lenders Mortgage Insurer Genworth was down 0.45% to 2.21, down 23.54% over the past year and Aggregator Mortgage Choice was up 3.52% to 1.03, but still down 57.53 over the year. It will be interesting to see how prices react to the release on Monday. We suspect many have gone short.
The Aussie reacted to the Fed’s change of direction in terms of rate policy, and ended up 0.05% on Friday to 72.53, which is still 9.9% lower than a year ago. We still suspect the rate will drop, as the local economy weakens. The Aussie Gold cross rate was 1,817 which is up 8.94% from this time last year. And the Aussie Bitcoin cross was up 0.38% on Friday to 4,395.7 but down 64.96% from a year ago.
So to the US market. The Dow racked up its sixth weekly gain on Friday after data showed the U.S. economy created more jobs than expected last month. But Amazon’s tumble back into bear-market territory kept a lid on gains. The Dow Jones Industrial Average rose 0.26% to end at 25,063.89, down 4.4% from this time last year. The S&P 500 closed flat at 2,706.53, and is 4.2% lower than last year at this time, while the S&P 100 ended at 1,191,67, down 4.77% on last year. The volatility index was down 2.6% to 16.14 still up 22.38% on last year and the S&P Financials Index was up 1.73% on the day to 431.73, and down 12.51% on last year. Fitch pointed out that a spike in market volatility during fourth quarter 2018 dragged down overall capital markets results for the five major U.S. trading banks as total debt underwriting revenues fell 24% from the year-ago period, reflecting volatility, particularly impacting the high-yield market. Goldman Sachs fell 0.74% on Friday, to 196.54, and is 26.09% than a year ago, reflecting a range of elevated risks.
The Nasdaq Composite slipped 0.25% to 7,263.87, down just 1.75% on a year back and in fact this is the sixth straight week ending higher., beating the S&P 500’s fifth in six weeks.
The U.S. economy created 304,000 jobs in January, up from 222,000 the prior month. That was above economists’ forecast of 165,000 and comes after the longest government shutdown in U.S. history, which seemingly had a muted impact on job growth. Wage growth, meanwhile, slowed to 0.1%, below expectations for a 0.3% rise, and the unemployment rate unexpectedly ticked higher to 4% from 3.9% in December.
The strong jobs report helped limit the impact from weakness in consumer discretionary stocks, led by Amazon.com which fell 5.38% on Friday to 1,626.23, and up 18.46% from year back. Its upbeat fourth-quarter results were undone by concerns raised during its earnings call with investors. A bear market is usually defined as a 20% from a recent high. In late December, the shares were down as much as 36% from their 52-week high. Gains since Dec. 24 had trimmed the decline to less than 20% on Wednesday. The shares are now down 20.7%. The e-commerce giant said it would likely increase investment in 2019 and raised concerns about new regulation in India.
Apple was up a little to end Friday at 166.52, down just slightly over the year, Google’s Alphabet was down 0.65% to 1,118.62 and down 4.76% from 12 months ago. Facebook ended at 165.71, down 10.81% over the year but Intel rose 3.42% to 48.73 and is 2.12% down over the year.
The US Federal Reserve kept rates on hold this week and underscored its “patience” in terms of future movements, which is central bank speak suggests the current tightening cycle has ended for now. Plus, we suspect the rate of QT will slow too, providing more support to the US economy. They are prepared to QE again if needed! The net result will be for more positive market movements, for now. They also reaffirmed inflation targeting is the core principle behind their management approach. You can watch our Post “The Fed Blinks” where we discuss the implications.
As a result of this, the US 10 Year Bond rose 1.87% on Friday to 2.684, while the 3 Month ended at 2.40. Rates are likely to stay in these ranges in the months ahead given the weaker – some would say capitulated – FED. There was little change on the US Dollar Index at 95.61, though it is 7.21% higher than a year ago. Trade talks with China are evidently still in train, despite the threat of an escalation by the US in a month if there is no structural agreement.
In Europe the Brexit ructions continue. The British Pound US Dollar rate ended at 1.309, still down 7.67% on 12 months back. The Footsie was up 0.74% to 7,020, and is also down 7.5%. The Footsie Financial Services index was up 0.59% to 649.99, down 6.77% on a year back. The Euro US Dollar was up a little to 1.1457, down 7.87% on a year ago and Deutsche Bank was back below 8.00 at 7.58, and is 47.01% down on a year back. They reported net loss of €409 million in fourth-quarter 2018 compared with a loss of €2.4 billion in the year-ago quarter. The bank incurred loss before taxes of €319 million). Lower revenues and higher provisions were the key undermining factors. Notably, net asset outflows were recorded during the quarter. However, strong capital position and lower expenses were the main positives. Considering the progress made in 2018, management lowered 2019 adjusted cost target to €21.8 billion from €22 billion previously announced. Also, the bank reaffirmed its target to reduce the internal workforce to below 90,000 by the end of 2019. Additionally, Deutsche Bank reaffirmed its commitment to its plans to achieve a post-tax Return on Tangible Equity target of more than 4% in 2019. Though Deutsche Bank’s restructuring efforts look encouraging, it is really difficult to determine how much the bank will gain, considering the lingering headwinds. Moreover, dismal revenue performance remains another concern.
The Yuan US Dollar was down 0.65% to 0.1483, and is down 6.29% compared with a year back, but there was more weakness reported in the Chinese economy and an expectation of more stimulus down the track.
The energy sector, meanwhile, served up impressive gains as oil prices settled sharply higher following a fall in rig counts and signs that U.S. sanctions on Venezuelan exports have trimmed supply. WTI Futures was 2.88% higher on Friday to 55.34, though still 16.44% lower than a year back. Gold was down 0.23% to 1,322.10 and down 1.07% across the year. Silver ended down 1%to 15.91, down 6.78% from a year back and Copper fell 0.48% to 2.771, down 12.75% from a year ago.
The Bitcoin Dollar rate was 3,539.9%, up 0.83% on the day, but still a massive 66.07% down from a year back. Just over a week ago, the VanEck/SolidX proposal to list a Bitcoin exchange traded fund (ETF) on the CBOE was withdrawn from regulatory consideration by the exchange’s parent, Cboe Global Markets. It was the most recent blow to crypto investors hoping to gain greater legitimacy for the currently bearish asset class and garner additional uptake from conventional investors looking for a less volatile, lower-risk way to invest in digital currencies. Earlier attempts at similar funds have met with failure over the past few years, even when the U.S. government was fully operational. The U.S. Securities and Exchange Commission (SEC) is proving to be the major hurdle to the introduction of such a fund, having already rejected nine other applications since 2017. The SEC’s concerns primarily centers on issues of market manipulation, surveillance and infrastructure, which are all problems associated with an immature marketplace. How long this will take is unknown, as there are many components to a well-developed market that often require simultaneous development due to the inter-reliance of structures.
So, in summary risks are on the down side, and we are going to see more attempts to talk the economy higher before rates are cut and money is printed. We are in the phony war, for now.
Alert – Watch 60 Minutes On Sunday Night!
A quick segment on the upcoming programme on channel Nine.
Volatility Strains Capital Markets at U.S. Banks
A spike in market volatility during fourth quarter 2018 dragged down overall capital markets results for the five major U.S. trading banks including: Bank of America Corporation (BAC), Citigroup, Inc. (C), The Goldman Sachs Group (GS), JPMorgan Chase & Co. (JPM) and Morgan Stanley (MS), according to the latest report from Fitch Ratings.
“Market volatility can be a boost to trading revenues; however, too much volatility in fixed income sales outweighed strength in equity trading and advisory revenues this quarter,” said Julie Solar, senior director, Fitch Ratings. “Too little volatility results in fewer trading opportunities, but too much keeps investors on the side lines.”

Total debt underwriting revenues fell 24% from the year-ago period, reflecting volatility, particularly impacting the high-yield market. Fitch expects that some volume was financed directly by commercial banks, which reported very strong commercial and industrial loan (C&I loan) growth trends in 4Q18.
However, despite a challenging final six weeks of the year, record earnings during the first part of the year contributed to the highest full-year results since 2009. Capital markets revenues for the five banks included in this report totalled $107 billion in 2018, approximately 4% higher than in 2017, aided mainly by a significant increase in equity sales and trading revenues.
M&A activity in 4Q18 increased a considerable 37% versus last year, buoyed by a significant rise in M&A completions and continued strength from the technology and healthcare sectors. Several banks noted that deal pipelines remain strong, although down on a linked-quarter basis.
“Even with a strong backlog of deals, continued volatility and market sentiment could impact banks’ ability to bring transactions to market, and the IPO pipeline may also feel an impact from the prolonged government shutdown as the SEC was unable to review pending IPOs for several weeks. 2019 is off to a strong start and the first quarter is typically the strongest of the year, but it is unclear how investment banking revenues could be impacted,” added Solar.
Taking Australia’s Economic Pulse
We discuss recent research which points to a potential slowing in the housing sector, and its implications more broadly, but with a specific focus on retail real-estate, and the impact of online shopping as more retailers give up the survival fight. What will happen to shopping centre rentals?