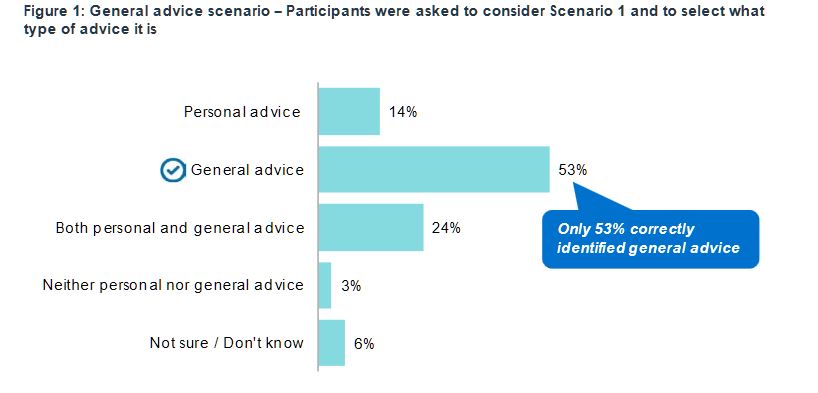
ASIC has released new research revealing many consumers confuse ‘general’ and ‘personal’ advice exposing them to greater risk of poor financial decisions.
The ASIC report, Financial advice: Mind the gap (REP
614), presents new independent research on consumer awareness and
understanding of general and personal financial advice, identifying
substantial gaps in consumer comprehension.
“This disturbing gap in understanding whether the advice they are
getting is personal or not means many consumers are under the false
premise their interests are being prioritised, when no such protection
exists,” said ASIC Deputy Chair, Karen Chester.
Millions of Australians will likely seek financial advice at some
stage in their lives. When they do, it is critical they understand
whether that advice is personal, whether it is tailored to their
circumstances and does the adviser have a legal obligation to act in
their interest.
“The survey not only revealed consumers are not familiar with the concepts of general and personal advice, but only 53 per cent of those surveyed correctly identified ‘general’ advice. And even when provided the general advice warning, nearly 40 per cent of those surveyed wrongly believed the adviser had an obligation to take their personal circumstances into account,” Ms Chester said.
The report highlights the importance of consumer awareness and
understanding of the distinction between personal and general advice
with the Future of Financial Advice (FOFA) protections only applying
when personal advice is provided. These include obligations for advisers
to act in their client’s best interests, to provide advice that is
appropriate to their client’s personal circumstances and to prioritise
their client’s interests. These obligations do not apply when general
advice is provided.
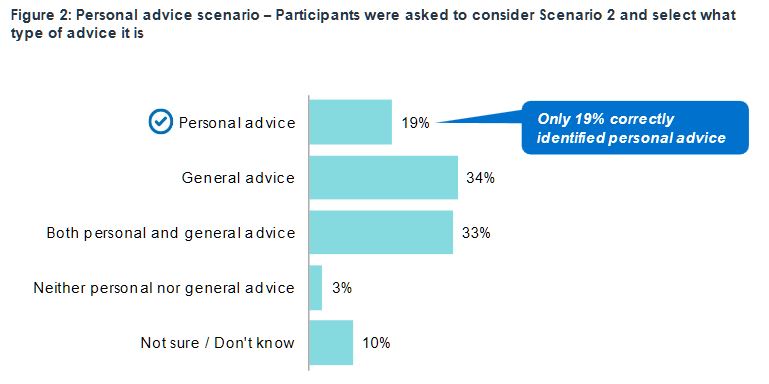
“The survey also revealed that the responsibilities of financial
advisers, when providing general advice, is not well understood. Nearly
40 per cent of those surveyed were unaware that advisers were not required by law to act in their clients’ best interests,” Ms Chester said.
ASIC anticipates the need for financial advice to grow, reflecting an
ageing population and many financial products, especially retirement
products, becoming more complex. ASIC reports that much of the advice is
likely to be general advice, and while appropriate in some
circumstances, it is inevitably of limited use.
“ASIC is seeing increased sales of complex financial products under
general advice models – so not tailored to personal circumstances –
leaving many consumers, especially retirees, exposed to the potential
risk of financial loss. And whilst the Financial Services Royal
Commission, and the Government’s response, dealt with the most egregious
risks of hawking of complex financial products, consumer confusion
about what is personal and general advice needs to be addressed,” Ms
Chester said.
The report’s findings reinforce those of the Murray Financial System
Inquiry and the Productivity Commission reports on the financial and
superannuation systems. Those reports made recommendations about the use
of the term ‘general advice’, which is likely to lead to false consumer
expectations as to the value of and protections afforded advice
received.
Ms Chester said, “This consumer research is timely. It comes as the
Government is considering policy recommendations on financial advice
from the Productivity Commission’s twin reports on Australia’s financial
and superannuation systems. And at a time when the financial system
itself undergoes much change, following the intense scrutiny of the
Financial Services Royal Commission, including considering new financial
advice and distribution business models”.
The report includes quantitative and qualitative research
commissioned by ASIC and undertaken by independent market research
agency, Whereto Research. The research used hypothetical advice
scenarios to test consumer recognition of when general and personal
advice was being provided, and awareness of adviser responsibilities
when being given each type of advice.
Report 614 Financial advice: Mind the gap is the first stage
in ASIC’s broader research project into consumer experiences with and
perceptions of the financial advice sector. Additional research by ASIC
will get underway in 2019 to identify a more appropriate label for
general advice and consumer-test the effectiveness of different versions
of the general advice warning.
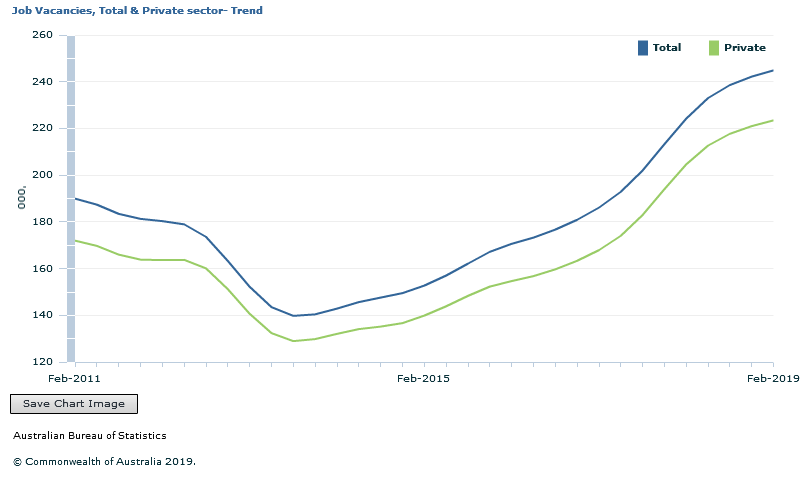
The number of job vacancies in Australia increased by 1.1 per cent over the February 2019 quarter, according to new trend figures from the Australian Bureau of Statistics.
Bruce Hockman, Chief Economist at the ABS, said that job vacancies continued to grow but at a slower rate than in 2018.
“Growth in the quarterly trend measure of job vacancies eased further to 1.1 per cent, which was well below the 5.2 per cent seen a year ago,” Mr Hockman said.
“This was consistent with the recent slowing in other economic indicators.”
Over the year, job vacancies increased by 9.2 per cent, with private sector vacancies increasing by 9.2 per cent and public sector vacancies by 9.4 per cent.
The seasonally adjusted number of job vacancies increased by 1.4 per cent over the February 2019 quarter.
In original series terms, New South Wales contributed the most to the growth in vacancies over the year, with health care and social assistance, and construction the two leading industries.
We discuss the findings from today’s House Economics Committee questioning of NAB’s new CEO, and look specifically at the issue of mortgage loan approvals.
The Reserve Bank NZ said today the Official Cash Rate (OCR) remains at 1.75 percent. Given the weaker global economic outlook and reduced momentum in domestic spending, the more likely direction of our next OCR move is down.
Employment is near its maximum sustainable level.
However, core consumer price inflation remains below our 2 percent target
mid-point, necessitating continued supportive monetary policy.
The global economic outlook has continued to weaken,
in particular amongst some of our key trading partners including Australia,
Europe, and China. This weaker outlook has prompted central banks to ease their
expected monetary policy stances, placing upward pressure on the New Zealand
dollar.
Domestic growth slowed in 2018, with softness in the
housing market and weak business investment contributing.
We expect ongoing low interest rates, and increased
government spending and investment, to support economic growth over 2019. Low
interest rates, and continued employment growth, should support household
spending and business investment. Government spending on infrastructure,
housing, and transfer payments also supports domestic demand.
As capacity pressures build, consumer price inflation
is expected to rise to around the mid-point of our target range at 2 percent.
The balance of risks to this outlook has shifted to
the downside. The risk of a more pronounced global downturn has increased and
low business sentiment continues to weigh on domestic spending. On the upside,
inflation could rise faster if firms pass on cost increases to prices to a
greater extent.
We will keep the OCR at an expansionary level for a
considerable period to contribute to maximising sustainable employment, and
maintaining low and stable inflation.
In a clear stance on Labor’s trail position, Chris Bowen MP has said that the government’s response to the banking royal commission has “got it wrong”, particularly in regard to its “backflip” on removing trail from next year; via The Adviser.
Speaking at the AFR Banking & Wealth Summit on 26 March, Chris Bowen, shadow treasurer and federal member for McMahon, reaffirmed the Australian Labor Party’s stance on trail commission payments to mortgage brokers.
In the final report for
the Royal Commission into Misconduct in the Banking, Superannuation and
Financial Services Industry, commissioner Kenneth Hayne recommended
that “changes in brokers’ remuneration should be made over a period of
two or three years, by first prohibiting lenders from paying trail
commission to mortgage brokers in respect of new loans, then prohibiting
lenders from paying other commissions to mortgage brokers”.
Following the release of the report, the Coalition government’s official response initially suggested that it would seek to ban trail for new loans from 1 July 2020, but Treasurer Josh Frydenberg announced earlier this month
that government would instead postpone any decision on removing trail
until after a review of mortgage broker remuneration has been undertaken
in three years’ time.
Meanwhile, the Labor Party’s response called
for the removal of trail for new mortgages from 1 July 2020 and for a
standardised upfront commission as a proportion of the loan amount. It
suggested that commissions should be capped at 1.1 per cent “so that
banks can’t offer brokers incentives to choose their products”.
‘A big tick to a big flick’
Speaking
at the AFR Banking & Wealth Summit today, Mr Bowen slammed the
government for its “backflip” on trail commissions, stating that they
continued to “get it wrong” on the royal commission recommendations.
He said: “I’m
normally not too partisan at these events, I normally steer away from
political commentary – at least through much of my speech, but given we
are at the business end of the term, with the federal election less than
50 days away, I’m sure you’ll appreciate some plain speaking.
“The
choice is between an opposition prepared to make big calls, and get
those calls right, versus a government that has got the big calls
wrong.”
Mr Bowen outlined that commissioner Hayne was “very clear” in his observations, which he said included the observations that “the
interest of customers was relegated to second place far too often; too
often, consumers were being left in the dark about how products or
services are acquired and delivered; and too often, financial services
entities were breaking the law and not held to account for their
actions”.
“Those actions that were revealed through the royal commission had given the entire sector a bad name,” Mr Bowen said.
“They needed, and need, to be dealt with. These are systemic failures in our financial services industry when it comes to providing community standards and expectations.”
Emphasising that the
government had previously called the royal commission a “populist
whinge”, “regrettable”, a “reckless distraction” and a “QC’s complaints
desk”, Mr Bowen added: “They got the big call wrong. And they also continue to get it wrong now, in terms of the recommendations.
“That’s probably most clear in relation to mortgage brokers.”
Mr
Bowen elaborated: “A few days after the royal commission was handed
down, the government told us that they were implementing the royal
commission recommendation on trail commissions and said the royal
commission recommendation was getting a ‘big tick’. No nuance, no discussion, just simply that this would be implemented.
“Now the reasons given by the commissioner on this issue were clear: The chief value of trail commissions to the recipient, to put it bluntly, is that they are money for nothing, [he said].
“And these are not new issues. The Productivity Commission found trail commissions have the effect of aligning the broker’s interests with those of the lender, rather than those of the borrower. The case was clear.”
Mr Bowen therefore called the government’s change in stance on trail as “a backflip with triple pike”.
“Just weeks after giving a recommendation a big tick, it was given the big flick,” he said, noting that it took “just 35 days to backflip on a major reform of phasing out trailing commissions for mortgage brokers”.
However, the shadow treasurer said that “there
was, and is, a strong case for thinking carefully about the royal
commission recommendation and ensuring we protect competition in
banking. That’s exactly what we did,” he said.
“We consulted with mortgage brokers, we consulted with banks and financial institutions – particularly the smaller ones.
“We
came up with a different way of removing conflicted remuneration for
mortgage brokers. We announced that we would have legislated a flat
upfront commission rate to avoid mortgage brokers’ advice being
conflicted by the rate of the commission offered,” he said.
Mr Bowen concluded: “It’s
one thing to achieve the objectives of the royal commission
recommendation in another way, as Labor has done; it’s another thing to
completely abrogate any policy action, as the Treasurer has done.
“When
we make big calls – and we’ve made quite a few of them – we stick to
them, fight for them, and seek to mandate for them, which is what we’ll
be doing, presumably, on the 11th of May [for the federal election].
“We
will implement 75 recommendations of the royal commission in full. The
government cannot say that and already we are seeing consumer groups
being very concerned that the government is already walking away from
other recommendations,” he said.
Broking industry continues engagement with ALP
While
the shadow treasurer has reaffirmed the party’s stance on trail
commissions, the broking industry continues its work in engaging and
educating ALP members on the benefits of trail.
Indeed, just last week, a group of nearly
100 representatives from the mortgage industry met shadow assistant
treasurer and federal member for Fenner, ACT, Dr Andrew Leigh, at the QT
Hotel in Canberra for the Future of Mortgage Lending forum, organised
by AFG in partnership with Connective and Mortgage Choice, in which the
need for trail was hotly discussed.
Speaking to The
Adviser about the event last week, AFG’s Mark Hewitt said that the
purpose of the meeting was to have a town hall type discussion with
economist-turned-politician Dr Leigh, and to outline how Labor’s plans to remove trail for new loans from next year could impact borrower outcomes.
“We
wanted to get the point across to Dr Leigh about the unintended
consequences of abolishing trail and the impacts that could have on the
brokers’ ability to provide an ongoing service to their clients,” Mr
Hewitt said.
“Labor’s focus was very centred on
talking about them being the first to move on commissions, but the
sentiment in the room was definitely around the abolition of trail and
why it was not a good idea.
“What was particularly
impressive to me was the care and concern that the brokers in the room
had for their customers and also their concern about the unintended
consequences of having their remuneration front-loaded in the way that
Labor is proposing.”
He continued: “We were talking
about the impacts that the removal of trail might have on brokers’
to provide ongoing service to clients and also the fact that
the model without trail doesn’t provide any incentive for an ongoing
customer relationship.”
Mr Hewitt told The Adviser that Dr Leigh “was very receptive to the messages in the room and was very impressive and engaging”.
“It
takes a fair bit of courage as well, as he was the only person in the
room who thought that abolishing trail was a good idea, but he stood by
the party line while still engaging and being respectful to the counter
arguments,” Mr Hewitt said.
“We were very pleased
with how it went because it’s a continuing conversation – and it was a
two-way conversation, hearing both sides, which is what we wanted to
achieve,” AFG’s general manager for broker and residential added.
RBA’s Luci Ellis, Assistant Governor (Economic) spoke yesterday “What’s Up (and Down) With Households?“. We examined the conundrum that labour markets are strong, yet the economy is weaker. The disconnect is the household sector – which of course DFA examines closely in our surveys.
One of the most interesting comments relates to household spending slowing, especially on cars and household goods. We regard this as an important indicator. Income of course is under pressure in real terms, costs are rising, and home prices are falling. Households are hunkering down. As the RBA says ” at some point they might conclude that this is not temporary and that low income growth will persist. At that point they would be likely to adjust their spending plans. Consumption growth would then slow“.
This is what she said:
For a little while now, the team at the Bank has been grappling with how one might reconcile
apparently weak national accounts figures with the noticeably stronger labour market data.
The disconnect can be traced to the household sector. Many other parts of the national accounts
measure of output – gross domestic product (GDP) – are actually doing reasonably
well. Outside the mining sector, where some large projects are still winding down, business
investment is growing at a solid pace. Transport and renewable energy projects have been quite
important. Public demand, both consumption and investment, is supporting growth.
There are also some areas of weakness outside the household sector, such as the drought-affected
rural sector, which is weighing on exports at the moment. Droughts and other recent natural
disasters clearly pose difficulties for those directly affected. But the underlying trends in
the broader economy are not determined by these events. So in the main, outside the household
sector, the economy is not doing too badly.
The Labour Market has Unambiguously Improved
This makes sense, because employment has been strong and someone must be hiring all those extra
workers. Over the past year, total employment has increased by more than 2 per cent.
The unemployment rate declined by ½ percentage point over 2018, reaching the level of 5 per cent
before our forecasts implied it would (Graph 1). This is a good outcome. Youth unemployment
has declined and most measures of underemployment have also come down a bit.
Graph 1
Some industries are doing better than others, but overall the strength in employment has been
across a diverse range of sectors (Graph 2). We can see this either by looking at the
industry that people say they work in, or we can use the ABS’s new Labour Account to
triangulate this information with what firms say their industry is. Either way, we see jobs
being added in a range of industries. Employment in health care and social assistance has been
increasing for a while; the rollout of the NDIS is an important driver of this, but not the only
one. More recently, we have also seen employment increase in a number of business services
industries. Construction employment had also been strong for a while, reaching the highest share
of total employment in more than a century of records.
Graph 2
One can be reasonably confident in the steer the labour market data are giving us, because it is
coming from multiple, independently collected data sets. The employment and unemployment data
come from the ABS’s survey of households. But a survey of businesses, also from the ABS,
tells us that the number of job vacancies has been a very high share of the total jobs
available. Separate private-sector surveys of businesses tell us that many firms plan to hire
more workers. Many of our own liaison contacts also tell us that they are hiring.
And as the labour market gradually tightens, we are beginning to see the effects in wages growth.
This has been low for some time, but is gradually trending up now, especially in the private
sector (Graph 3). Part of this shift is that fewer workers are subject to wage freezes than
was the case a year or so ago. Minimum and award wage rises have also increased. Along with
other countries, it’s taking longer and a lower unemployment rate to start seeing faster
wages growth than historical experience might have suggested. Indeed, we still think Australia
is a little way off the levels of the unemployment rate that would induce materially faster
wages growth. But as the experience of other countries has also shown, if the labour market
tightens enough, wages growth does eventually pick up.
Graph 3
Household Consumption Spending is Slowing
In contrast to the positive picture implied by the labour market, growth in household income has
been slow, and growth in consumption has weakened recently (Graph 4).
Graph 4
If we drill down to see which kinds of spending have slowed the most, we can see that spending on
cars and household goods has been particularly affected (Graph 5). Spending on less
discretionary items like food has been less affected.
There has been a deal of talk about the possibility that ‘wealth effects’ from
declining housing prices might be weighing on spending. It’s important to remember, though,
that people’s reaction to a fall in prices is likely to depend partly on how far prices had
increased previously.
Graph 5
Some recent work by colleagues at the Bank suggests that the link is a bit more subtle than
simply that increases in wealth boost spending directly (May, Nodari and Rees 2019). It isn’t
so much that people wake up one morning, realise their home is worth more, and decide to go out
shopping. Rather, if their home is worth more, they can borrow more against it, which matters
for some people’s decisions to buy a car. And because rising housing prices usually occur in
the context of high rates of transactions in the market, spending on home furnishings tends to
rise and fall with housing prices. So when housing prices decline, turnover also declines. This
means there are fewer people moving house and realising their old couch doesn’t fit or they
need new furnishings in the extra bedroom.
Slow Income Growth is a Drag on Household Spending
Beyond this specific link to housing turnover, some slowdown in consumption spending is not
entirely unexpected. For several years now, we have been calling out the issue of weak income
growth and how it might test the resilience of household consumption spending. This is a
particular issue in the context of high household debt and the need to service that debt.
One aspect of economic theory that actually works in practice is the observation that people try
to smooth their consumption in the face of fluctuating incomes. Income growth is noticeably more
volatile than consumption growth. So the usual pattern is that gaps between the two resolve with
shifts in income growth, not shifts in consumption growth.
But there might be limits to how long households can continue expanding their consumption faster
than their income is rising. People are still saving, and they can do so at a slower rate. But
at some point they might conclude that this is not temporary and that low income growth will
persist. At that point they would be likely to adjust their spending plans. Consumption growth
would then slow.
So we need to establish how household income growth might indeed return back towards current
rates of consumption growth or even higher. To do that, we need to understand why it has been so
weak.
Labour Income Growth Has Recovered Somewhat
For some time, part of the story had been that labour income growth was weak. This has been true
across several dimensions. First, the growth of wage rates for particular jobs has been slow
(Graph 6). This is the measure of wages growth captured by the ABS’s Wage Price Index
(WPI). It captures changes in wages paid for a fixed pool of jobs. As I already mentioned,
growth in this measure has started increasing, though only gradually. It is still well below
what one might expect in the longer run, if inflation is to average between 2 and 3 per cent
and if productivity maintains a similar average growth rate to its average over the past decade
or so.
People’s actual incomes include bonuses and other non-wage labour income, and average labour
income depends on whether the mix of jobs in the economy is changing. For a number of years,
these factors combined to make average earnings per hour, as recorded in the national accounts,
increase much more slowly than the mix-adjusted WPI measure. It isn’t unusual for growth in
this measure of earnings to differ from growth in the WPI. They are compiled on different bases.
But in the years following the end of the mining investment boom, this gap was persistently
negative, and quite large.
Graph 6
Some of the compositional change might have been because people were moving out of higher-paid
jobs in mining-related activity, and had gone back to lower-paying work. It’s hard to
pinpoint how important this effect was, because the weakness in average earnings growth was seen
in some industry-level data as well. So at least some people would have had to be switching to
lower-paid jobs in the same industry. Another factor that might have been at work was that fewer
people were actually switching jobs than in the past. Surveys that track people through time,
such as the HILDA survey, show that people who change jobs often see faster income growth in the
year they switched, than people who didn’t change jobs (Graph 7).
Graph 7
This lower rate of job churn accords with some of the evidence we see in business surveys and the
messages coming out of our business liaison program. Many firms report that they find it hard to
find suitable labour, at least for some roles, and that this is a constraint on their
businesses, though usually not a major one (Graph 8). But when we ask our contacts what
they are doing about this problem, paying people more is not the first solution they think of.
Even poaching someone from another firm by enticing them with higher pay is not that common. The
evidence from our liaison program suggests that it has long been the case that firms first
resort to other strategies to deal with labour shortages, and only turn to faster wage increases
when the shortages are severe and persistent (Leal 2019).
Graph 8
But whatever the underlying drivers, the gap between the growth rates of the WPI and average
earnings has closed more recently. Slow wages growth is still a concern, but in terms of its
contribution to income growth, it is less of a puzzle than it was a few years ago. Instead we
need to seek the source of the more recent weakness elsewhere.
Non-Labour Income Remains Weak
If we break household disposable income growth into its components, we can see the drivers of the
more recent weakness (Graph 9). Labour income is not especially strong, but it no longer
seems at odds with growth in employment and other information about wages growth. Rather, growth
in other sources of income has been weak for some time, and this has continued more recently.
Graph 9
Within non-labour income, the main components are social assistance, rental income, other
investment income, and the earnings of unincorporated businesses. It turns out that a confluence
of factors has resulted in growth in most of these categories of income being weak recently. In
some cases, this is a trend change that is likely to persist. Some others are driven by
shorter-term factors that could reverse in coming years.
Social assistance payments have been relatively flat for a number of years (Graph 10). As
the labour market has strengthened and unemployment has come down, it is not surprising that
some forms of social assistance have not been growing. But there are a few other things going on
at the same time. Firstly, the rate of growth of age pension payments has slowed, though it is
still positive. There are a number of probable drivers of this, including the increase in the
eligibility age, as well as more people above the (higher) eligibility age remaining in the
workforce rather than drawing a pension. It is also possible that, as time goes on and the
people who are retiring have had longer to accumulate superannuation balances, more people are
receiving a part-pension together with an income stream from their superannuation.
Graph 10
Secondly, in recent years, growth in social welfare spending by the government has come from new
programs (like the NDIS) that are counted as government consumption, not household income, in
the national accounts. So while both disability payments and other payments to families with
children have been broadly constant in dollar terms for several years, government consumption
has been growing strongly over the same period. If we adjusted for this, the growth in the
social assistance component of household income would look much closer to its average over the
past, rather than well below average.
These factors all relate to the design of programs assisting households, and how they are
classified in the national accounts. So we would not expect them to reverse all of a sudden.
This implies that we should also not expect that measured household income from this source will
bounce back strongly any time soon.
Rental income has also been a bit weak (Graph 11). This is not surprising considering that
rents have been rising only slowly in most cities, and falling for a few years in Perth. But
rental income is only earned by 15 per cent of taxpayers, and lower cash rental income
for landlords is also lower rent paid by renters, leaving them with more money to pay for other
things.[1] So the
weakness in rental income is unlikely to be a large driver of any slowdown in consumer spending.
Income from other kinds of investments has also been a bit weak, but has recovered a bit lately.
Graph 11
Unincorporated business income has also been weak of late. This can be a volatile type of income
and sensitive to conditions in particular sectors. The farm sector represents a large share of
unincorporated business income, compared with their share of the economy. So one reason this
type of income has fallen has been the effect of the drought on farm incomes. A recovery here
will depend on how soon normal seasonal conditions return. Much of the rest of unincorporated
business income comes from sectors related to the property market, including building
tradespeople and real estate agents. They are also seeing lower incomes, as both construction
activity and the volume of sales of existing homes decline. Again, it can be envisaged that
these sources of income might recover at some point, but not in the very near term.
Tax and Other Payments are Dragging on Disposable Income
When we think about household income available for consumption and saving, economists usually
talk about household disposable income. This is income net of taxes, net interest
payments and a few other deductions like insurance premiums. Income payable – the things
deducted from gross income to calculate disposable income – increased by nearly 6 per cent
in 2018. This was significantly faster than growth in gross household income.
Despite the relatively weak picture for household income growth, the tax revenue collected from
households has grown solidly in recent years. It’s normal for growth in tax revenue to
outpace income growth a bit: that is how a progressive tax system works. A useful rule of thumb
is that, in the absence of adjustments to tax brackets to allow for bracket creep, for every one
percentage point of growth in household income, taxes paid by households will on average
increase by about 1.4 percentage points. That’s an on-average figure, though. The
actual ratio can vary quite a bit.
In the past year, taxes paid by households increased by around 8 per cent, more than
double the rate of growth in gross household income of 3½ per cent. So the ratio
is more like a bit over two-to-one at the moment, rather than 1.4 to one. That is at the high
end of the range this ratio reaches, but as this graph shows, it is not unprecedented (Graph 12).
But this effect has cumulated over time, so that the share of income that is paid in tax has
been rising (Graph 12, bottom panel).
Graph 12
What is noteworthy is that for all of the past six years, growth in tax paid has exceeded income
growth by an above-average margin, at a time when income growth itself has been slow (Graph 13).
Graph 13
There are likely to be several things going on here. Aside from the usual bracket creep, some
deductions and offsets have declined, boosting the overall tax take. Interest rates on
investment property loans are now higher than for owner-occupiers, but overall the interest rate
structure on mortgages is lower than it was a few years ago. So landlords will have lower tax
deductions for interest payments on loans on investment properties. At the same time, the
significant run-up in housing prices in some cities over the past decade will have increased the
capital gains tax liability paid by investors selling a property. Turnover in the housing market
has declined. But as best we can tell, the price effect has dominated the effect of declining
volumes, and total capital gains tax paid has increased.
Compliance efforts and technological progress in tax collection have boosted revenue collected
from a given income. The Tax Office reports that its efforts to raise compliance around
work-related deductions have boosted revenue noticeably (Jordan 2019). The next wave of this
effort, focused on deductions related to rental properties, could result in further boosts to
revenue.
Some of these drivers boosting tax paid could persist for a while, but they aren’t permanent.
For example, the earlier period of strong housing price growth will only increase capital gains
tax revenue if the asset was owned during that period. It can be expected to become less
important, the further into history it passes. Similarly, increased compliance increases the
level of tax paid on a given level of income. It is not a change in the trend
growth rate in tax paid. That said, the effect could last for a while as efforts shift to
different aspects of compliance.
Some Recent Policy Changes Might Mitigate the Drag on Consumption
The net of all these effects is that household income growth has remained slow even as labour
market conditions have been improving. Unlike slow wages growth, though, it is less clear how
much weak non-labour income growth will weigh on consumer spending. As I already noted, slow
growth in rental income for landlords means that tenants have more money to spend on other
things. Some of the weakness in social assistance payments is because new programs are being
delivered differently from existing ones, and so they are classified as government consumption.
The net benefit to the recipients could be the same or higher.
So there might be reasons to think that weak non-labour income growth is less worrisome than weak
wages growth. But you would not want to rely on that possibility to underpin your views on the
outlook for consumption. So this is an area we need to watch closely. Household consumption
spending is a large part of economic activity. A significant retrenchment there would lower
growth and feed back into a weaker labour market, as well as into decisions to purchase housing.
Parting Thoughts
My talk today has deliberately not overlapped with what the Bank has recently said about the
housing market. But I think it’s clear that conditions in the household sector more broadly
are highly consequential for the housing sector and thus this audience. Whatever other forces
might be affecting housing market developments, fundamentally demand for housing rests on the
household sector’s confidence and capacity to take on the financial commitments involved in
the purchase or rental of a home. Without enough income, and so without a strong labour market,
that confidence and capacity would be in doubt. This is not the only reason we are watching
labour market developments closely. But the nexus between labour markets, households and housing
are crucial to our assessment of the broader outlook.
Consistent with our thesis that the big tech players are well positioned to disrupt the finance sector, Apple has moved further into financial services with the launch of a new credit card for its iPhone users, at its event today. Users will be able this facility anywhere that Apple Pay is accepted.
The new credit card will give 2 per cent cash back rewards, which is
applied directly to the account for purchases made through Apple Pay but
only 1 per cent for purchases made using the physical card.
Goldman Sachs has partnered with Apple to produce the card, with Mastercard handling payment processing.
The initial launch in in the USA.
This via Fintech Business. Apple, at its ‘show time’ services event, announced the introduction of a new credit card that aims to have quicker applications, no fees, lower rates and better rewards.
Users will get a physical card but one which does not have any
information on it, instead all the authorisation information is stored
directly with the Apple Wallet app.
Apple announced that it planned to use machine learning and its Maps
app to label stores that you use and to track purchases across
categories.
Apple chief executive Tim Cook said that the card would be one of the biggest changes the credit card had seen in decades.
“Apple is uniquely positioned to make the most significant change in the credit card experience in 50 years,” he said.
Vice president of Apple Pay Jennifer Bailey said that the card builds
on the work of Apple Pay and uses the power of people’s mobile devices.
“Apple Card is designed to help customers lead a healthier financial
life, which starts with a better understanding of their spending so they
can make smarter choices with their money, transparency to help them
understand how much it will cost if they want to pay over time and ways
to help them pay down their balance,” she said.
Ms Bailey said that privacy was a big issue and all tracking information would be stored on users’ iPhones, not on Apple’s servers.
“Apple doesn’t know what you bought, where you bought it, and how much you paid for it,” she said.
Chairman and chief executive of Goldman Sachs David Solomon said he was thrilled to partner with Apple on this card.
“Simplicity, transparency and privacy are at the core of our consumer product development philosophy,” said Mr Solomon.
“We’re thrilled to partner with Apple on Apple Card, which helps customers take control of their financial lives.”
Mastercard president and chief executive Ajay Banga said the company was excited to bring global payments to Apple.
“We are excited to be the global payments network for Apple Card,
providing customers with fast and secure transactions around the world,”
he said.
The National Australia Bank has announced an end to its ‘Introducer’ payments program to take effect in October 2019, via InvestorDaily.
The Introducer program was launched by NAB to reward businesses with a commission for new successful lending referrals to NAB.
The program was promoted by NAB as a way to fundraise for communities and as a relationship strengthen program.
The
program has been the source of many problems for the bank with KPMG
being commissioned to investigate the program in 2015 and found large
issues including bankers falsifying documents to issue bogus loans and
serviceability issues.
KPMG
went as far as investigating introducers for links to organised crime
and terrorist financing and NAB continued to investigate the problem and
in 2016 notified the police and ASIC resulting in the sacking of 20
staff and more disciplined.
By October 2019 NAB will no longer make referral
payments to Introducers with chief executive Philip Chronican saying it
was important that the bank acted and changed its actions.
“Through
the royal commission, we heard clearly that our actions need to meet
the expectations of our customers and the community. We need to be
simpler and more transparent to earn trust. We have to put customers
first, to be a better bank,” Mr Chronican said.
Commissioner
Kenneth Hayne in his final report did not recommend the banning of such
schemes but after hearing about fraud issues around such programs did
raise the question about who the introducers were actually working for.
The
program was reportedly responsible for approximately $24 billion in
loans and in 2018 the bank said it was responsible for one in every
twenty home loans it wrote.
Mr Chronican said he wanted Australians to come to NAB because of what the bank offered, not because someone was paid to do so.
“We
want customers to have the confidence to come to NAB because of the
products and services we provide – not because a third-party received a
payment to recommend us.”
The change is significant for NAB and the industry, but Mr Chronican said it was the right thing to do for the banks customers.
“Like
other businesses, we will still welcome referrals and will continue to
build strong relationships with business and community partners.
However, there will be no ‘Introducer’ payments made,” he said.
NAB
is the first of the big banks to remove their introducer program with a
report from ASIC revealing that in 2015 $14.6 billion in home loans by
the big four were sold via introducer channels.
The announcement
is the latest by the bank who recently announced that it would keep all
regional and rural branches open until at least 2021.
The bank
has also extended the protections of the code of banking practice to
small businesses and has supported 72 of the royal commission
recommendations with 26 either completed or in the process of being
implemented.
“NAB has a significant role to play in leading the change our customers and the community want to see.”
The Australian Prudential Regulation Authority (APRA) has proposed updating its prudential standard on credit risk management requirements for authorised deposit-taking institutions (ADIs).
Credit risk refers to the possibility that a borrower will fail to meet their obligations to repay a loan, and is usually considered the single largest risk facing an ADI.
APRA has released a discussion paper proposing changes to Prudential Standard APS 220 Credit Quality (APS 220), which requires ADIs to control credit risk by adopting prudent credit risk management policies and procedures.
APS 220 was last substantially updated in 2006, and there has been significant evolution in credit risk practices since then, including more sophisticated analytical techniques and information systems. APRA’s plan to modernise the standard was prompted by its recent supervisory focus on credit standards, and also reflects contemporary credit risk management practices.
The discussion paper outlines APRA’s proposals in the following areas:
Credit risk management – The
revised APS 220 broadens its coverage to include credit standards and the
ongoing monitoring and management of an ADI’s credit portfolio in more
detail. It also incorporates enhanced Board oversight of credit risk and
the need for ADIs to maintain prudent credit risk practices over the
entire credit life-cycle.
Credit standards – The revised
APS 220 incorporate outcomes from APRA’s recent supervisory focus on
credit standards and also addresses recommendation 1.12 from the Final
Report of the Royal Commission in relation to the valuation of land taken
as collateral by ADIs.
Asset classification and
provisioning – The revised APS 220 provides a more consistent
classification of credit exposures, by aligning recent accounting standard
changes on loan provisioning requirements, as well as other guidance on
credit related matters of the Basel Committee on Banking Supervision.
To better describe the
purpose of the revised standard, APRA also proposes renaming it Prudential Standard APS 220 Credit Risk
Management.
The proposed reforms are due to be implemented from 1 July 2020, while an
accompanying prudential practice guide (PPG) and revised reporting standards
will be released for consultation later this year.
In a related development, APRA has also released a letter to industry
expressing concerns related to ADIs’ increasing exposure to funding agreements
with third party lenders, including peer to peer (P2P) lenders.