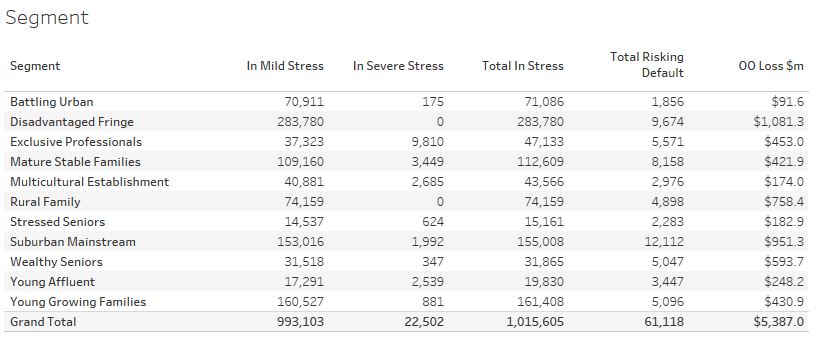
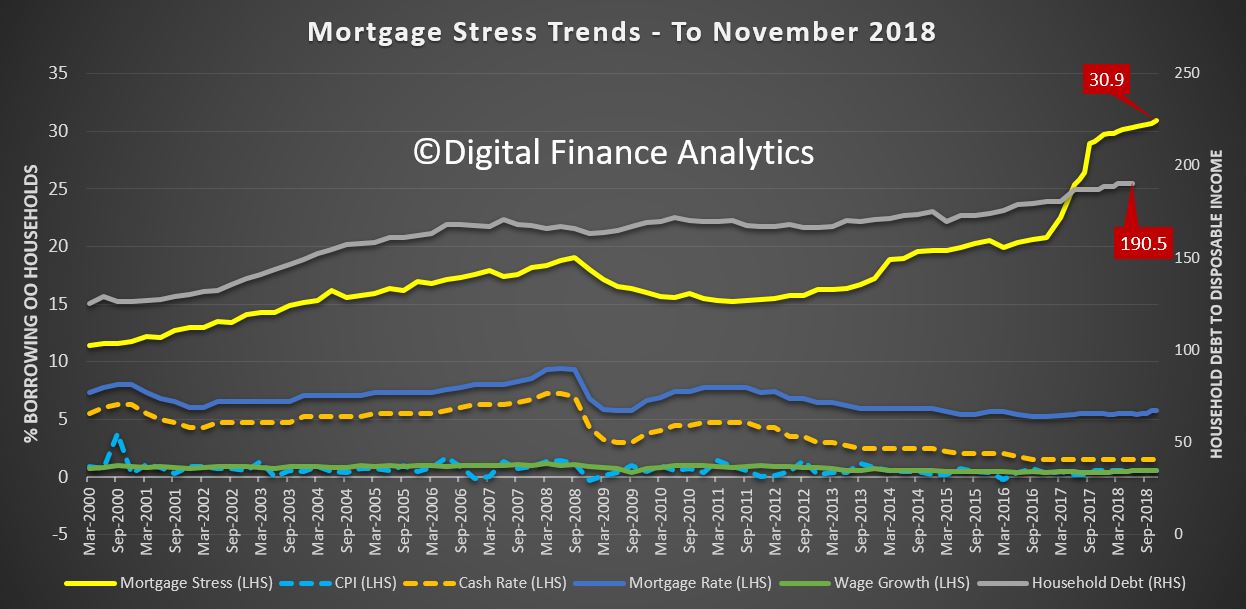
DFA has released the November 2018 mortgage stress and default analysis update. Across Australia, more than 1,015,600 households are estimated to be now in mortgage stress (last month 1,008,000). This equates to 30.9% of owner occupied borrowing households. In addition, more than 22,500 of these are in severe stress. We estimate that more than 61,000 households risk 30-day default in the next 12 months.
We continue to see the impact of flat wages growth, rising living costs and higher real mortgage rates. The latest RBA data on household debt to income to June reached a new high of 190.5[1]. This high debt level helps to explain the fact that mortgage stress continues to rise. Bank losses are likely to rise a little ahead.
Our analysis uses the DFA core market model which combines information from our 52,000 household surveys, public data from the RBA, ABS and APRA; and private data from lenders and aggregators. The data is current to the end of November 2018. We analyse household cash flow based on real incomes, outgoings and mortgage repayments, rather than using an arbitrary 30% of income.
Households are defined as “stressed” when net income (or cash flow) does not cover ongoing costs. They may or may not have access to other available assets, and some have paid ahead, but households in mild stress have little leeway in their cash flows, whereas those in severe stress are unable to meet repayments from current income. In both cases, households manage this deficit by cutting back on spending, putting more on credit cards and seeking to refinance, restructure or sell their home. Those in severe stress are more likely to be seeking hardship assistance and are often forced to sell.
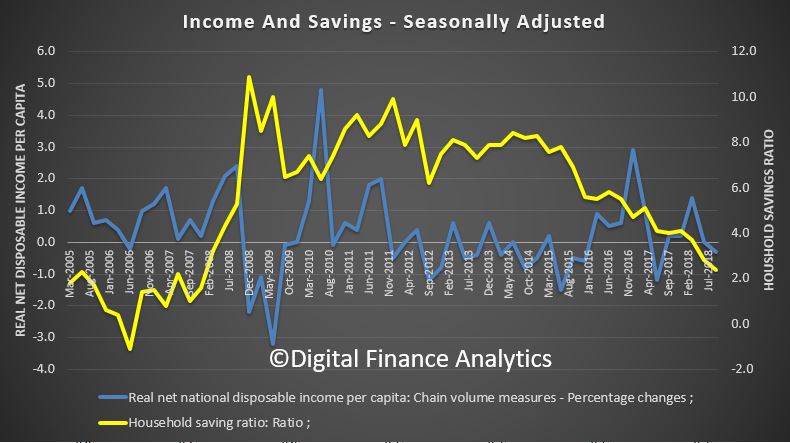
Martin North, Principal of Digital Finance Analytics says this rise in stress, which has continued for the past 6 years, should be of no surprise at all. “Continued rises in living costs – notably child care, school fees and food – whilst real incomes continue to fall and underemployment is causing significant pain. Many are dipping into savings to support their finances.” The latest ABS GDP numbers confirmed the falling savings ratio.
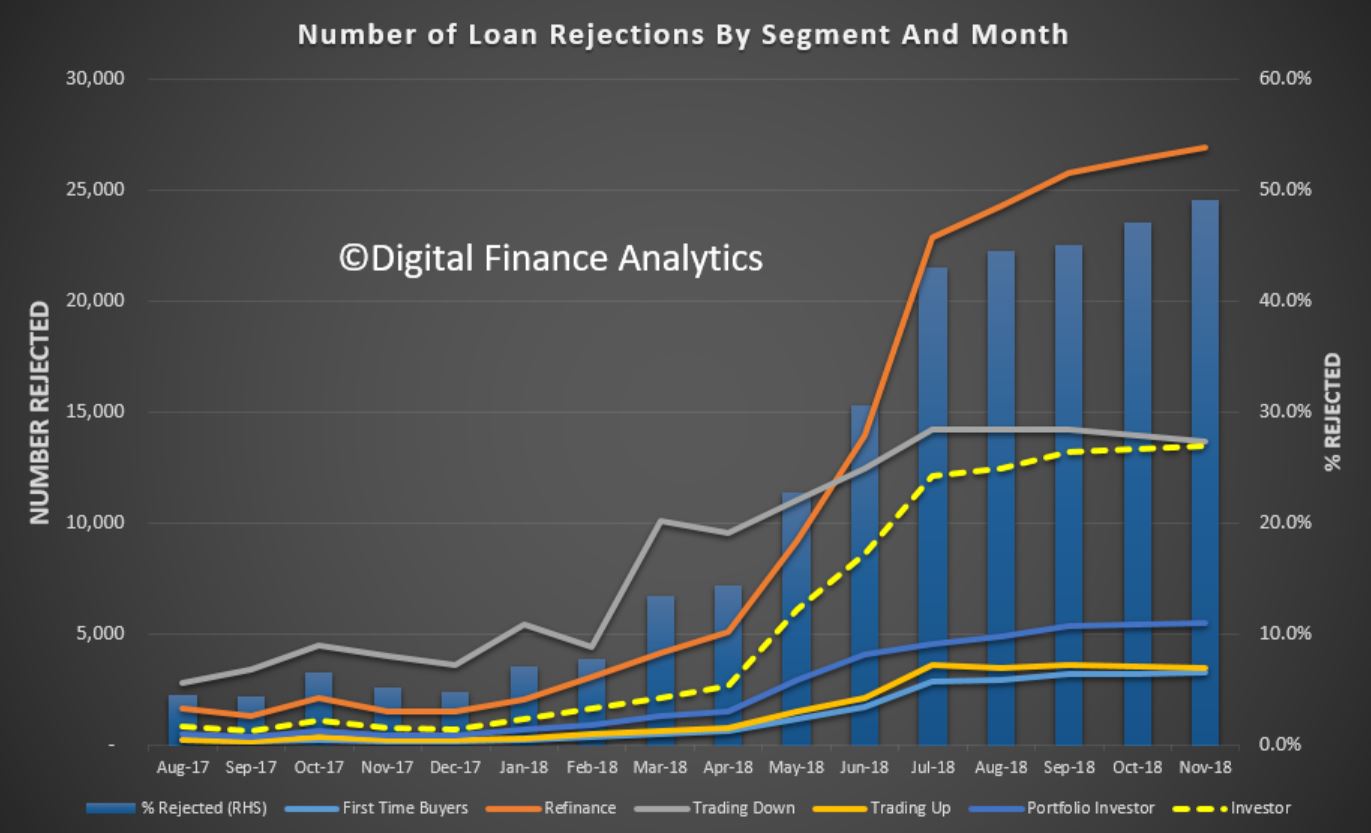
Indeed, the fact that significant numbers of households have had their potential borrowing power crimped by lending standards belatedly being tightened, and are therefore mortgage prisoners, is significant. More than 49% of those seeking to refinance are now having difficulty. This is strongly aligned to those who are registering as stressed. These are households urgently trying to reduce their monthly outgoings”.
In addition, negative equity is now rearing its head. Data from APRA, the Property Exposures figures – showed that banks wrote nearly 26,000 new mortgages with a loan to value ratio of more than 90%, and a further 51,000 with an LVR of between 80 and 90 percent. That is 20% of all loans written in the same period. I would expect these numbers to fall significantly, as lenders tighten their standards further.
But it’s also worth remembering that in some cases existing borrowers have pulled more equity out to allow them to pass funds to their kids – the so called bank of Mum and Dad, and in the case of a forced sale, the market value may well overstate the true recovery value of the property. Using a property as an ATM does not work in a falling market.
Last month, a Roy Morgan survey of 10,000 borrowers found 8.9 per cent were slipping into negative equity — up from 8 per cent 12 months prior — which would work out to around 386,000 Australians.
We have run our own analysis with data to the end of November and on my modelling currently there are around 400,000 households across the country in negative equity, both owner-occupiers and investors. There are about 3.25 million owner-occupier borrowers and at least 1.25 million investors, so around 10 per cent of properties are currently underwater.
We run a range of potential scenarios, but if our central case works out, with an average fall of 20-25 per cent, our modelling suggests that around 650,000 households would fall into negative equity. My more severe case, if an international crisis hits is for a 40 per cent price fall. Then you’re getting close to one million households. That would be catastrophic for the economy. That’s analogous to what happened in Ireland where prices dropped 40 per cent. A decade later, there are still people in negative equity who’ve never recovered.
The next question to consider is which households are being impacted. In fact, negative equity is touching “lots of different segments” of the market for different reasons, but collectively it is an “early warning sign” for what is to come.
Probability of default extends our mortgage stress analysis by overlaying economic indicators such as employment, future wage growth and cpi changes. Our Core Market Model also examines the potential of portfolio risk of loss in basis point and value terms. Losses are likely to be higher among more affluent households, contrary to the popular belief that affluent households are well protected. This is shown in the segment analysis below:
Stress by the numbers.
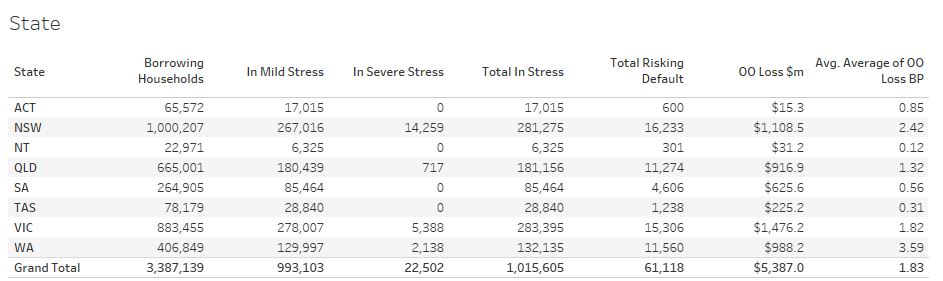
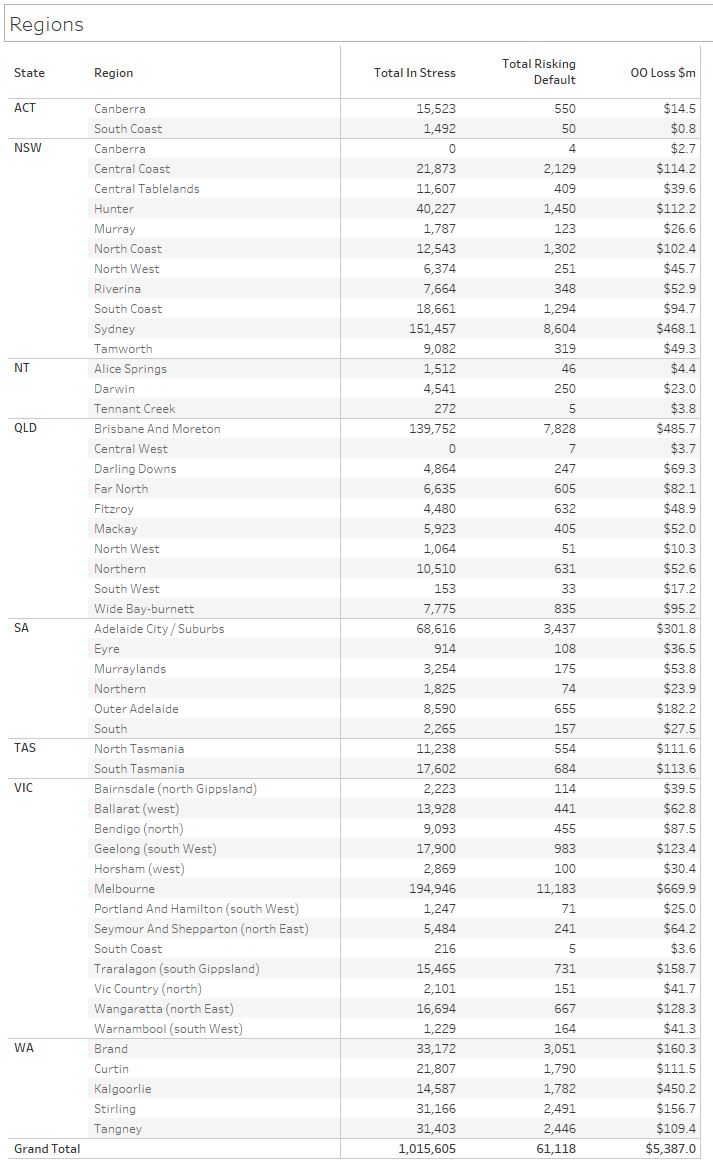
Regional analysis shows that NSW has 281,275 households in stress (272,536 last month), VIC 283,395 (281,922 last month), QLD 181,156 (178,015 last month) and WA has 132,135 (132,827 last month). The probability of default over the next 12 months rose, with around 11,560 in WA, around 11,300 in QLD, 15,300 in VIC and 16,200 in NSW.
The largest financial losses relating to bank write-offs reside in NSW ($1.1 billion) from Owner Occupied borrowers) and VIC ($1.47 billion) from Owner Occupied Borrowers, though losses are likely to be highest in WA at 3.6 basis points, which equates to $1,000 million from Owner Occupied borrowers.
A fuller regional breakdown is set out below
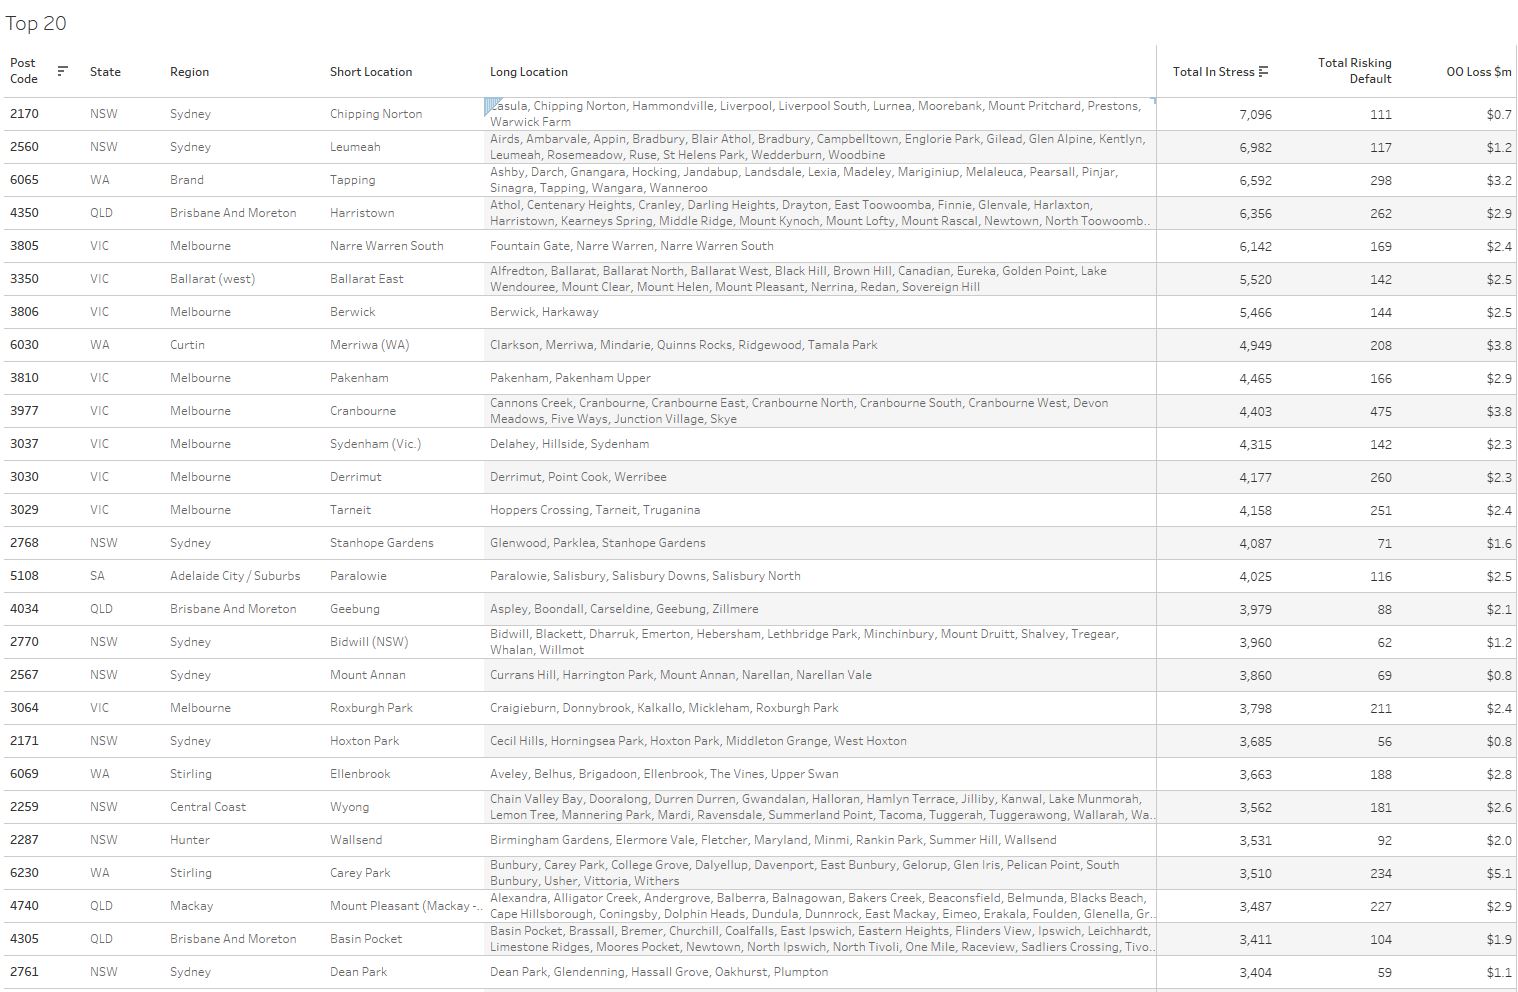
Here are the top postcodes sorted by number of households in mortgage stress.
[1] RBA E2 Household Finances – Selected Ratios June 2018
You can request our media release. Note this will NOT automatically send you our research updates, for that register here.
[contact-form to=’mnorth@digitalfinanceanalytics.com’ subject=’Request The November 2018 Stress Release’][contact-field label=’Name’ type=’name’ required=’1’/][contact-field label=’Email’ type=’email’ required=’1’/][contact-field label=’Email Me The November 2018 Media Release’ type=’radio’ required=’1′ options=’Yes Please’/][contact-field label=”Comment If You Like” type=”textarea”/][/contact-form]
Note that the detailed results from our surveys and analysis are made available to our paying clients.
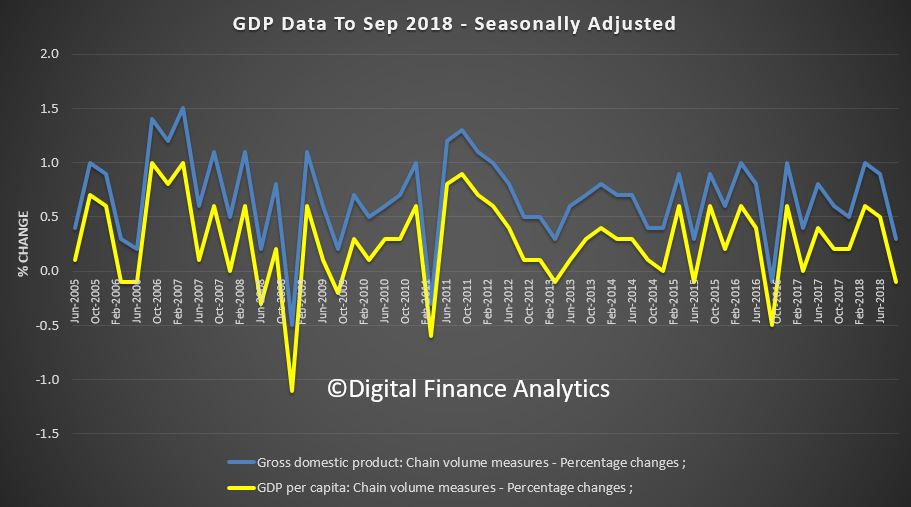
The Australian economy grew 0.3 per cent in seasonally adjusted chain volume terms in the September quarter 2018, according to figures released by the Australian Bureau of Statistics (ABS) today. But this was below expectations, and confirms the weaker performance of the economy. The household sector contribution is weakening, on the back of the weaker housing market, weak wages growth and higher costs. Government spending and commodity prices helped support the weaker numbers.
The RBA was forecasting an annual 3.5% to December 2018, based on the recent Statement on Monetary Policy. With the first three quarters of the year reaching just 2.2%, it would require a December quarter of 1.3%, which seems unlikely. So they will need to adjust their forecasts down.
All this looks to signal RBA cash rate cuts ahead.
In addition, the per-capita data went negative in September at – 0.1 % meaning that it is population growth alone which is responsible for lifting the GDP.
The per capita income and savings ratios also were negative, with the savings ratio back to lows not seen since 2007, as people dip into reserves to maintain lifestyle and pay the bills – as expected given our household financial confidence index.
And net disposable income per capita fell 0.3% in the last quarter.
We continue to see the economy quite differently from the RBA’s rose tinted windows in Martin Place. Had it not been for strong commodity prices the story would have been worse still. But the household sector growth engine is misfiring badly now, as the markets have recognised.
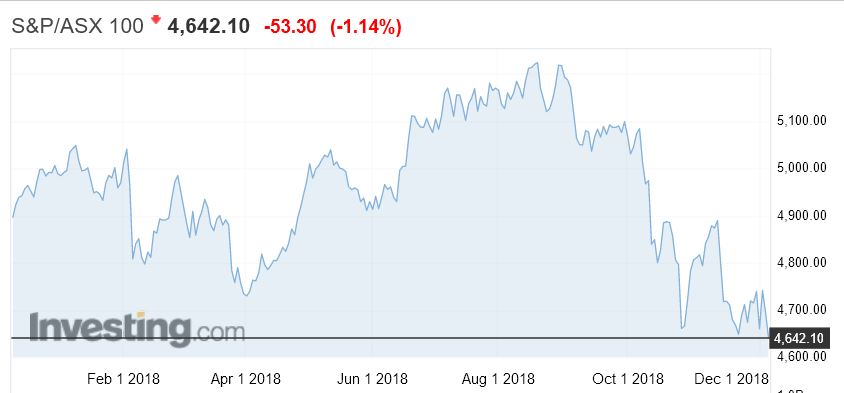
The ASX was down 1.14% at lunchtime to 4,642 on the back of the weak GDP and falls overnight on Wall Street.
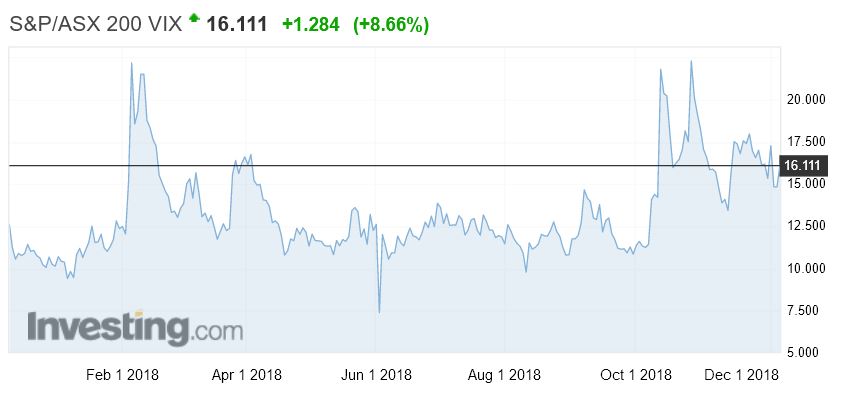
The local fear index was higher, up 8.66% t0 16.11, indicating increasing uncertainty.
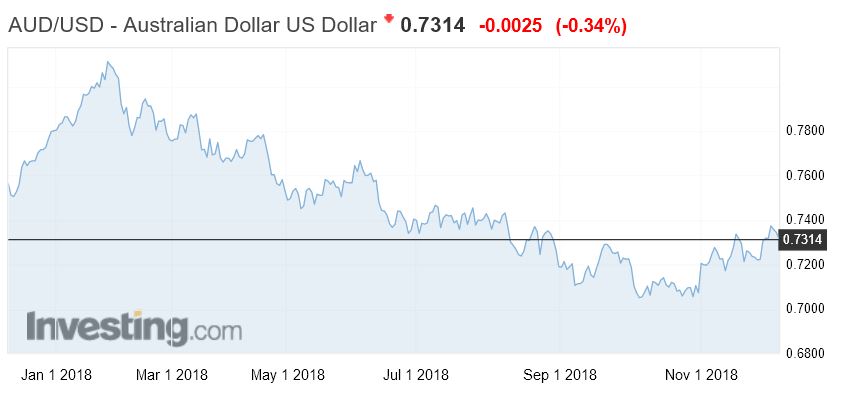
The Aussie slide against the USD, down 0.34% to 73.14.
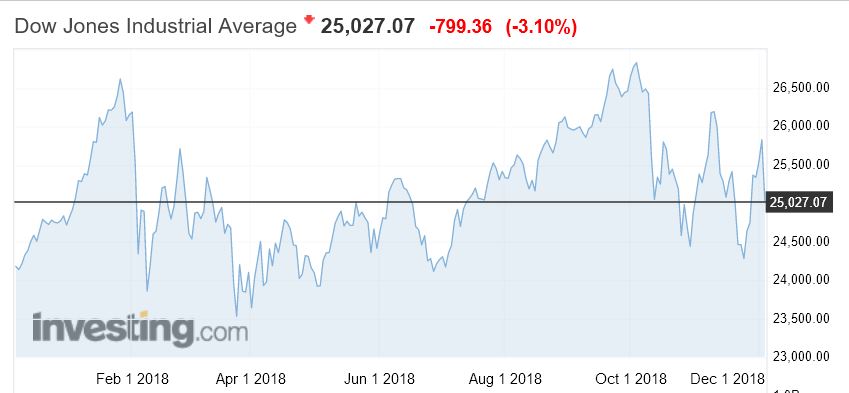
And the DOW was down 3.1% overnight, on renewed fears about US recession as the yield curve inversion looks more likely, and trade talks with China continue, and Bexit uncertainty grows.
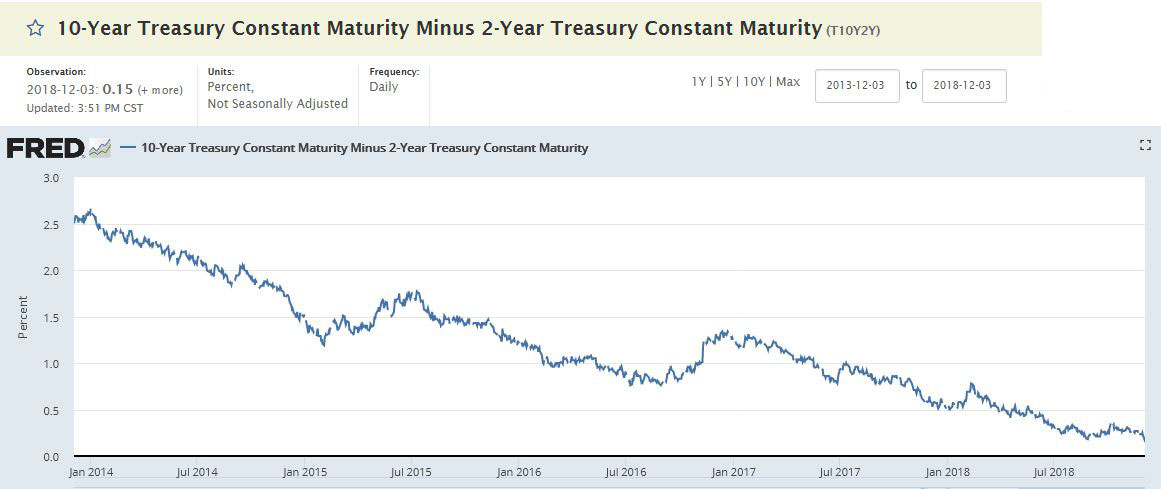
Signals from the Federal Reserve last week that it may be nearing an end to its three-year rate hike cycle has pushed the 10-year U.S. Treasury yield to three-month lows below 3 percent. The spread between the two-year and 10-year Treasury yields was at its flattest level in over a decade.
Concerns about slowing U.S. growth have accelerated the flattening of the yield curve, a phenomenon in which longer-dated debt yields fall faster than their shorter-dated counterparts.
A flatter curve is seen as an indicator of a recession, with lower longer-dated yields suggesting that the markets see economic weakness ahead.
This is what the ABS said:
ABS Chief Economist, Bruce Hockman, said: “The household sector drove domestic growth with increased consumption supported by moderate rises in household income.”
Household consumption rose 0.3 per cent driven by non-discretionary spending on food and housing. Spending on discretionary items slowed during the quarter. Household gross disposable income continued to grow at a slow pace due to moderate growth in household income being partially offset by a rise in income tax payable.
The subdued growth in gross disposable income coupled with an increase in household consumption resulted in the household saving ratio declining to 2.4 per cent in the September quarter. This is the lowest saving rate since December 2007.
Compensation of employees increased across all states and territories with the exception of the Northern Territory. “The increase in wages was consistent with strong employment growth as reported in the latest ABS Labour Force data, as well as a lift in wage rates.” Mr Hockman added.
Public spending was funded through increased revenue. General government final consumption expenditure increased 0.5 per cent underpinned by continued expenditure in health, aged care and disability services. Public investment remained at high levels with continued work on a number of large infrastructure projects around the nation.
Health care and social assistance output also recorded strong growth reflecting ongoing public investment in health care. Growth was also observed in services industries supporting infrastructure projects. Professional, scientific and technical services, Rental, hiring and real estate services and Administrative and support services all recorded growth during the quarter.
Three US agencies, the Board of Governors of the Federal Reserve System, Federal Deposit Insurance Corporation and Office of the Comptroller of the Currency have released a proposal seeking to lift the property value at which a full appraisal is required.
The three federal banking agencies announced they are seeking public comment on a proposal to raise the threshold for residential real estate transactions requiring an appraisal from $250,000 to $400,000. The appraisal threshold has remained unchanged since 1994, and the agencies believe an increase would provide burden relief without posing a threat to the safety and soundness of financial institutions.
All three agencies have approved the proposal, with the FDIC and the OCC acting on November 20. Comments will be accepted until 60 days after publication in the Federal Register.
Rather than requiring an appraisal for transactions exempted by the threshold, the proposal would require the use of an evaluation consistent with safe and sound banking practices. Evaluations provide an estimate of the market value of real estate but could be less burdensome than appraisals because the agencies’ appraisal regulations do not require evaluations to be prepared by state licensed or certified appraisers. In addition, evaluations are typically less detailed and costly than appraisals. Evaluations have been required for transactions exempted from the appraisal requirement by the current residential threshold since the 1990s.
This proposal responds, in part, to comments the agencies received during their recent review of regulations that the current exemption level for residential transactions had not kept pace with price appreciation.
Additionally, the proposal would incorporate the appraisal exemption for rural residential properties provided by the Economic Growth, Regulatory Relief and Consumer Protection Act and similarly require evaluations for these transactions. In addition, the proposal would require institutions to appropriately review all appraisals required by the agencies’ appraisal rules to ensure their compliance with appraisal industry standards.
The global economic expansion is continuing and unemployment rates in most advanced economies are low. There are, however, some signs of a slowdown in global trade, partly stemming from ongoing trade tensions. Growth in China has slowed a little, with the authorities easing policy while continuing to pay close attention to the risks in the financial sector. Globally, inflation remains low, although it has increased due to the earlier lift in oil prices and faster wages growth. A further pick-up in core inflation is expected given the tight labour markets and, in the United States, the sizeable fiscal stimulus.
Financial conditions in the advanced economies remain expansionary but have tightened somewhat. Equity prices have declined and credit spreads have moved a little higher. There has also been a broad-based appreciation of the US dollar this year. In Australia, money-market interest rates have declined, after increasing earlier in the year. Standard variable mortgage rates are a little higher than a few months ago and the rates charged to new borrowers for housing are generally lower than for outstanding loans.
The Australian economy is performing well. The central scenario is for GDP growth to average around 3½ per cent over this year and next, before slowing in 2020 due to slower growth in exports of resources. Business conditions are positive and non-mining business investment is expected to increase. Higher levels of public infrastructure investment are also supporting the economy, as is growth in resource exports. One continuing source of uncertainty is the outlook for household consumption. Growth in household income remains low, debt levels are high and some asset prices have declined. The drought has led to difficult conditions in parts of the farm sector.
Australia’s terms of trade have increased over the past couple of years and have been stronger than earlier expected. This has helped boost national income. Most commodity prices have, however, declined recently, with oil prices falling significantly. The Australian dollar remains within the range that it has been in over the past two years on a trade-weighted basis.
The outlook for the labour market remains positive. The unemployment rate is 5 per cent, the lowest in six years. With the economy expected to continue to grow above trend, a further reduction in the unemployment rate is likely. The vacancy rate is high and there are reports of skills shortages in some areas. The stronger labour market has led to some pick-up in wages growth, which is a welcome development. The improvement in the economy should see some further lift in wages growth over time, although this is still expected to be a gradual process.
Inflation remains low and stable. Over the past year, CPI inflation was 1.9 per cent and in underlying terms inflation was 1¾ per cent. Inflation is expected to pick up over the next couple of years, with the pick-up likely to be gradual. The central scenario is for inflation to be 2¼ per cent in 2019 and a bit higher in the following year.
Conditions in the Sydney and Melbourne housing markets have continued to ease and nationwide measures of rent inflation remain low. Credit conditions for some borrowers are tighter than they have been for some time, with some lenders having a reduced appetite to lend. The demand for credit by investors in the housing market has slowed noticeably as the dynamics of the housing market have changed. Growth in credit extended to owner-occupiers has eased to an annualised pace of 5–6 per cent. Mortgage rates remain low, with competition strongest for borrowers of high credit quality.
The low level of interest rates is continuing to support the Australian economy. Further progress in reducing unemployment and having inflation return to target is expected, although this progress is likely to be gradual. Taking account of the available information, the Board judged that holding the stance of monetary policy unchanged at this meeting would be consistent with sustainable growth in the economy and achieving the inflation target over time.
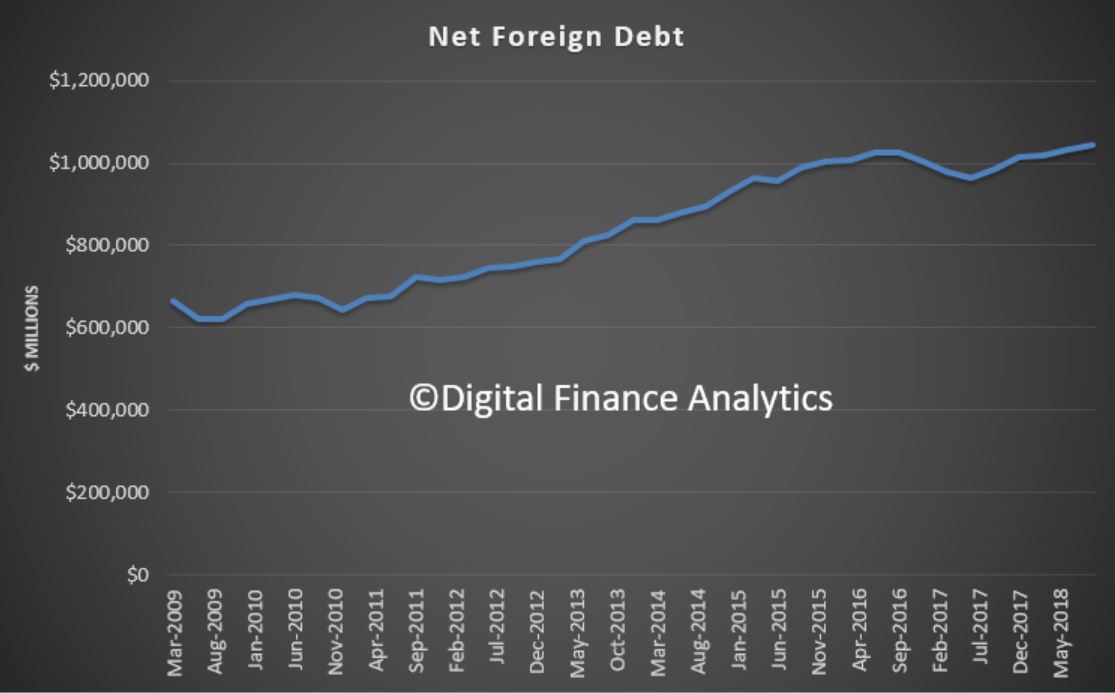
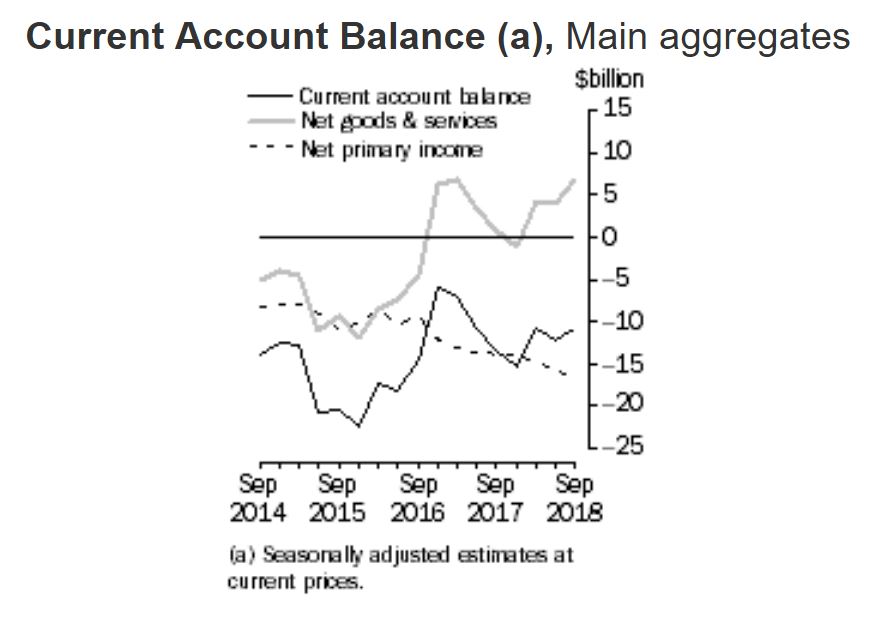
All the talk today will be about the reduction in the current account deficit thanks to increased goods and services exports as shown in the ABS release to Sept 2018. International trade is expected to contribute 0.4 percentage points to growth in the September quarter 2018 Gross Domestic Product.
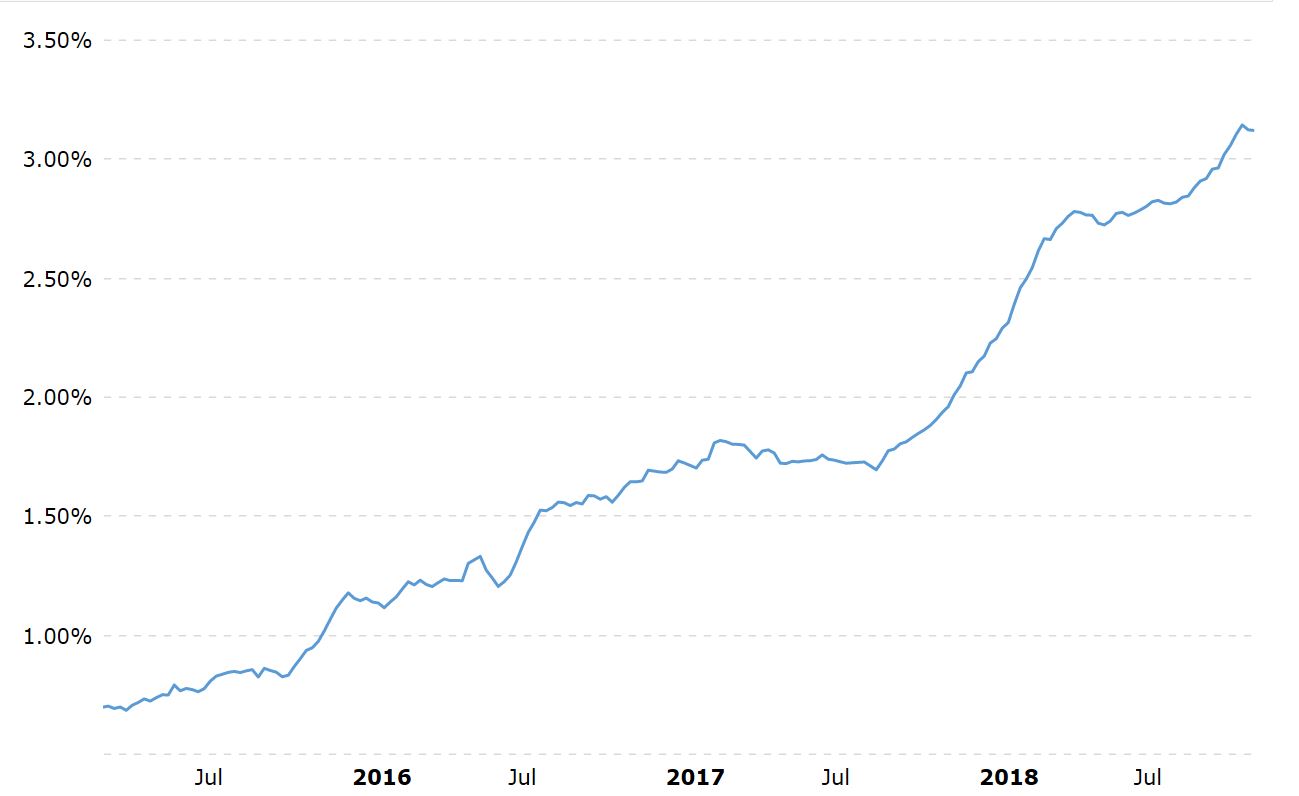
But the real story should be the continued expansion of foreign debt to $1,044 billion in Sept 2018. This is where our exposure is to rising interest rates (and we know already the US will continue to hike rates). The 1 Year LIBOR rate, for example, is rising still and this foreshadows real issues ahead. The debt bomb is alive and well….
Australia’s current account deficit in seasonally adjusted terms decreased $1,368 million in the September quarter 2018 driven mainly by increased goods and services exports, according to latest figures from the Australian Bureau of Statistics (ABS).
The balance on goods and services surplus in the September quarter 2018 was $6,607 million, a rise of $2,704 million. Exports of goods and services rose $3,390 million (3 per cent) following a continued rise in exports of other mineral fuels which includes natural gas, offset by rising imports of goods and services, up $688 million (1 per cent). The net primary income deficit widened by $1,162 million to $16,911 million in the September quarter 2018.
In volume terms, imports falling and strong exports resulted in an expectation for international trade to contribute 0.4 percentage points to growth in the September quarter 2018 Gross Domestic Product. In seasonally adjusted chain volume terms, the balance on goods and services surplus increased $1,603 million, widening the surplus to $2,853 million.
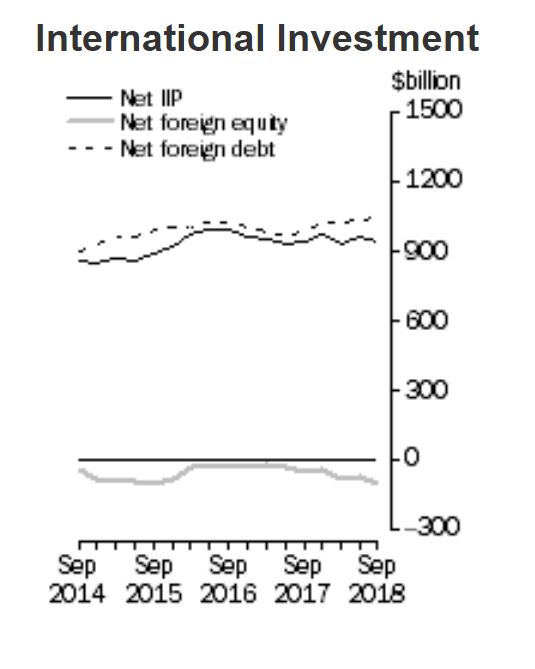
Australia’s net international investment position was a liability of $940.2 billion at 30 September 2018, a decrease of $17.3 billion on the revised 30 June 2018 position of $957.5 billion.
Australia’s net foreign equity asset position increased $29.9 billion to $103.9 billion at 30 September 2018. Australia’s net foreign debt liability position increased $12.6 billion to $1,044.0 billion.
Top forecaster Shayne Oliver believes there is still plenty of room for property prices to head south as homes weaken to GFC levels; via InvestorDaily.
Australian capital city dwelling prices fell another 0.9 per cent in November marking 14 months of consecutive price declines since prices peaked in September last year. This has left prices down 5.3 per cent from a year ago, their weakest since the GFC.
The decline is continuing to be led by Sydney and Melbourne.
Sydney dwelling prices fell another 1.4 per cent and have now fallen 9.5 per cent from their July 2017 peak. Meanwhile, Melbourne prices fell another 1.0 per cent and are down 5.8 per cent from their November 2017 high.
Perth also saw prices fall by 0.7 of a percentage point, but Hobart and Darwin saw prices rise by 0.7 of a percentage point. Prices in Canberra rose 0.6 of a percentage point and Brisbane and Adelaide prices rose 0.1 of a percentage point.
“The decline in property prices is being driven by a perfect storm of tighter credit conditions, poor affordability, rising unit supply, reduced foreign demand, the switch from interest only to principle and interest mortgages for a significant number of borrowers, fears that negative gearing and capital gains tax concessions will be made less favourable if there is a change of government, falling price growth expectations and FOMO (fear of missing out) risking turning into FONGO (fear of not getting out) for investors,” AMP Capital chief economist Shayne Oliver said.
“These drags are most evident in Sydney and Melbourne because they saw the strongest gains into last year and had become more speculative with a greater involvement by investors.
“Ongoing weakness in these two cities is evident in very weak auction clearance rates and auction sales volumes. Recent auction clearance rates averaging just below 40 per cent in Sydney and Melbourne are consistent with ongoing price declines of around 7 to 10 per cent per annum.”
The economist believes the decline in Sydney and Melbourne property prices has much further to go as Comprehensive Credit Reporting kicks in, making it even harder to get multiple mortgages.
Many homebuyers will be watching out for changes to negative gearing and capital gains tax, which could become the new reality after a change of government at the coming federal election.
“In these cities we expect to see a top to bottom fall in prices of around 20 per cent spread out to 2020,” Mr Oliver said.
“However, the plunge in clearance rates and the uncertainty around credit tightening and tax concessions indicate that the risks are on the downside. So there is more to go yet.”
Welcome to the Property Imperative Weekly to the first of December 2018, our digest of the latest finance and property news with a distinctively Australian flavour.
Read the transcript or watch the video show.
This week, the Royal Commission completed its hearings, the credit impulse is lower, home prices are falling and The Fed may blink. Yet still the property spruikers are trying to talk the market higher in the new year, and applying the art of misdirection, our political leaders would prefer we looked at distracting shiny things over there. But here we simply reprise the latest data. We are, it seems, in a pickle.
And by the way if you value the content we produce please do consider supporting our efforts. You can make a one off donation via PayPal, that’s a new facility or consider joining our Patreon programme. We really appreciate those who are contributing to help us continue to make great content.
The last of more than 60 days of hearings by the Royal Commission into Financial Services Misconduct finished on Friday when the hearings adjourned at 1.15pm. And now unlike other rounds, the Commission won’t be accepting further submissions or identifying any particular findings as being open on the evidence. Commissioner Kenneth Hayne and counsel assisting Rowena Orr made their closing remarks
The 68 days of hearings saw 134 witnesses take the stand in Melbourne and Sydney. More than 400 witness statements and over 6500 exhibits were tendered by counsel assisting. Witnesses included the top line-ups at banks, mortgage brokers, advice groups, superannuation trustees, insurers, regulators, external dispute resolution bodies, consumer groups and industry bodies.
But Orr singled out consumers who came forward to give evidence about their experiences. “I would particularly like to thank this last group of witnesses, the consumers who agreed to come and give evidence in the Commission’s public hearings. Many of them travelled long distances and gave evidence about their private financial affairs in a very public forum. I know that they did not always find that easy, but their willingness to give evidence about their experiences has greatly assisted the work of the Commission, and I am grateful to them,” Orr said.
Making his closing remarks, Commissioner Hayne recognised the intensity of work that has been required of those acting for the entities whose conduct has been the subject of examination.
He also made the point that the Commission has not sought to influence how the media has reported. We’ve not backgrounded, we’ve not provided the media or anyone with any information about what witnesses are to be called or subjects covered except by posting what we have on the website. We’ve not commented on what has occurred in the course of evidence,” Hayne said.
“It has been for the media and for the media alone to decide what will be the subjects of their reports, and what, if any, comments they may choose to make about what the Commission has done. And that, again, is as it should be. But it is also right that I recognise the role that the media has played in this being a public inquiry by reporting on the work of the Commission.”
The barristers will be working closely with the Commissioner over the next 62 days, as he prepares the final report for a February 1 release. So what might we expect to see? A key focus will be the cultural norms which encouraged greed across the financial sector, at the expense of customers, which resulted in poor sales outcomes, fees for no service and misaligned incentives. We can expect changes in the role and responsibilities of for example mortgage brokers. Ms Orr asked several pointed questions (“Do you agree that changes need to be made to address conflicts?”, “Why could they not be replaced with a fixed fee?”), which reiterate the commission’s line of questioning regarding trail and upfront commissions. And there was intense focus on cultural change across corporations. But as The Chair of NAB highlighted this is questioning the very basis of capitalism – that companies are responsible to their shareholders first and foremost; the emphasis on customer outcomes will change the game.
Regulators were also shown to be too weak, too close to their targets, to the point they were ineffective, and consumers were the victims. ASIC’s and APRA’s poor testimony this week confirmed the need for substantive regulatory change. Myopic, Captured and Ineffective are words that come to mind.
There is the possibility of further legal action as many laws were broken, such as responsible lending, as well as class actions later. And remember this inquiry was forced on the Government despite the fact that those in the sector were fully aware of the issues under the waterline.
But I want to make two points here. First, the case studies were largely self-reported by the banks, so they already knew about their own poor behaviour, yet did nothing to deal with the root cause issues, and in many cases simply chose to ignore, or slow down the progress of resolution. Billions of dollars have been written off financial sector shares, and more than one billion of remediation will be required. But understand that more recent issues such as poor lending practice – where loans have yet to go bad – were not covered – as the debt bomb explodes, this will add yet more pressure on the sector.
Second, we can expect to see big changes, if the Royal Commission recommendations come out as expected, yet of course the Government can resist their recommendations, slow implementation or chose to ignore the results. The industry is lobbying hard, and hoping for minimal changes. Yet it’s clear we need a radical restructure of the finance sector, changes to culture and regulation. My concern is we will be asked to look the other way on a promise the banks will reform themselves – but we need so much more. There is a once in a generation opportunity to get finance to work for the benefit of the community. The risk is there; the whole thing will be hooked to the long grass. We will need to hold the powers that be to account.
So to the latest data.
The RBA and APRA both released their statistics yesterday to end of October. The data clearly shows the mortgage flows are easing, which is a key indicator of weaker home prices ahead. Remember it is the RATE of credit growth, or the credit impulse we need to watch. Essentially, for home prices to rise, the rate of credit growth needs to accelerate, and the reverse is also true as can be clearly seen.
The RBA credit aggregates shows that overall credit rose by 0.4% last month, or 4.6% over the past year. Housing credit rose by 0.3% in October, or 5.1% over the past year. Business credit rose 4.7% over the past year and 0.6% in October. Personal credit fell 1.6% over the year, and broad money rose by 1.9%, compared with 6.8% last year – the credit impulse is easing!
Total housing lending rose by 0.28% to $1.78 trillion. Within that owner occupied lending rose 0.42% or $5 billion to $1.2 trillion while investment lending rose by just 0.1% to $593.6 billion. Investment loans fell to 33% of all loans, down from 38.6% in 2015. Business lending was 32.7% of all lending, lower than 2015.
The annualised figures show the fall in housing lending across the board.
Turning to the APRA banking stats, we can look at individual lender portfolios. We see that Westpac and ANZ both reduced their investor loan portfolios between September and October, while NAB and CBA grew theirs.
Macquarie Bank is still growing its investor pools (well above the now obsolete APRA 10% speed limit). ADI portfolios hardly moved overall with CBA still the largest owner occupied lending, and Westpac the largest investment lender. We can still plot the annualised movements of investor loans, and we see a small number of lenders well above the 10% speed limit (which was removed a few months ago). Significantly many lenders are well below that rate. At an aggregate level, lending by ADIs was up 0.3% in the month, with investor loans flat, and owner occupied loans at 0.46%.
The proportion of investor loans fell again in stock terms to 33.6%. Total ADI lending rose to $1.66 trillion, up 0.3% of $5 billion. Owner occupied loans rose 0.46% to $1.1 trillion and investor loans rose 0.004% to $557.4 billion. In fact, some smaller banks, and non-banks are growing their portfolio faster than the majors, thus the rotation across the sectors continues. We expect credit to continue to grow more slowly ahead, and this will lead home prices lower.
CoreLogic reported that in November home price values decreased another 0.98% across the 5 capital cities. Sydney fell 1.43%, Melbourne 0.97% and Perth 0.73%. Brisbane rose a little up 0.26% and Adelaide rose 0.06%, but in these smaller markets the data will be less accurate.
The year to date movements continues the story, with Sydney down 7.19%, Melbourne 5.63% and Perth down 3.78%. Brisbane has risen 0.59% and Adelaide 1.12%. The five city averages were down 5.15%. And just remember Perth is down 14.8% from the previous peak, and Sydney is down 9.5%, on average. There are significant local variations, and regional markets are falling less, but all the signs are more falls ahead.
So we cannot reconcile this with Domain’s claim this week that after a free fall in prices over the past four years, house values in Perth are expected to grow faster than any other capital city in 2019. Perth house prices are expected to hit rock bottom by the beginning of 2019 and then grow 5 per cent next year, slightly more than Brisbane and Canberra, according to Domain’s economist Trent Wiltshire. Prices in Perth will have fallen 13 per cent from their peak – of $616,000 in 2014 – to trough, he said. “This outlook is underpinned by better economic conditions: new mines are being built, commodity prices are higher, population growth is increasing and employment prospects have improved. The latest consumer data from the West just not chime with Domain’s optimistic view!
CoreLogics auction clearance rates continue to show weakness (there are more sales done privately now by the way which are under reported). They say that the combined capital city final auction clearance rate came in at 41.9 per cent last week, slightly lower than the previous week’s 42.0 per cent; the lowest results since June 2012. Last week marks the 9th consecutive week where less than 50 per cent of the homes taken to auction have sold. Last year, 61.1 per cent of homes sold at auction when volumes were significantly higher (3,438).
Across Melbourne, auction volumes fell with 1,132 auctions held, returning a final auction clearance rate of 41.4 per cent. Over the week prior, 1,401 Melbourne homes were taken to auction returning a final clearance rate of 41.3 per cent. One year ago, 1,215 auctions took place, returning a much higher clearance rate of 65.5 per cent.
In Sydney, the final auction clearance rate rose to 44.8 per cent last week, from 42.8 per cent the previous week. There were 1,035 auctions held last week, increasing from the 875 the previous week, however lower than the 1,215 Sydney auctions held last year when a higher 56.8 per cent sold.
While volumes increased across Adelaide, Brisbane and Canberra last week, clearance rates fell across all of the smaller auction markets.
Auction activity across the combined capital cities is expected to remain relatively steady week-on-week, with a total of 2,610 homes scheduled for auction this week, down only slightly on last week when 2,701 auctions took place.
Days on market is quite a good test of the property market. CoreLogic released data on this, and shows that in Sydney, the median days on market was 31 days a year ago but has increased to 50 days currently which is much higher than the recent low of 24 days in April 2017. Across regional NSW, days on market currently sits at 64 days compared to 52 days a year ago and a recent low of 48 days in May 2017.
In Melbourne, the median time on market is currently recorded at 38 days and in regional Vic it is recorded at 41 days. In Melbourne, the days on market is trending higher, it is much higher than the 23 days a year ago and the highest it has been since March 2016.
Add in higher vendor discounting to the mix as we discussed last week, and we conclude prices will drop further ahead.
The ABS released data on median incomes this week, in its annual Characteristics of Employment report. In 2018, the median weekly earnings of all Australians was $1,066. This means that half of all Australians earned less than $1066 per week.
In fact, they reported that median weekly earnings grew by a strong 5.4% in the year to August 2018, with full-time earnings growing by 4.7%. As at August 2018, that median weekly earnings of $1,066 represents $55,432 per year, whereas median full-time weekly earnings were $1,320 ($68,640 per year). But in inflation adjusted terms, the median Australian worker’s weekly earnings are still 0.4% below the level that existed in August 2012, despite this year’s bounce. No wonder our household surveys continue to highlight issues, especially as mortgages today are so much bigger than in 2012.
There are also significant regional variations. In 2018, the Australian Capital Territory was the region with the highest median earnings for employees at $1,300 per week, followed by the Northern Territory at $1,204. South Australia and Tasmania had the lowest median earnings for employees at $1,000 and $961 respectively. Of the state capital cities, Perth held the highest median weekly earnings for employees at $1,167 per week, ahead of Sydney and Brisbane with $1,100. Regional South Australia had the lowest overall median earnings for employees at $922.
The top three industries with the highest median weekly earnings for employees were Mining ($1,950), Electricity, Gas, Water and Waste Services ($1,500), and Financial and Insurance Services ($1,434). The industries with the lowest median weekly earnings for employees were Retail Trade ($700) Arts and Recreation Services ($699), and Accommodation and Food Services ($500).
And the HIA reported that the tight lending environment has put a squeeze on the housing market prices particularly in Sydney and Melbourne are responding accordingly. The combined impact of falling home prices and restricted access to credit are now being felt in the home building market. HIA New Home Sales fell by a further 0.8 per cent during October 2018 and sales are 13.9 per cent lower than the same time a year ago. They say that the decline in new home sales was driven by New South Wales (down by 4.9 per cent) while South Australia (down by 5.6 per cent) and Western Australia (down by 10.7 per cent) also detracted from the total. These falls were partially balanced by offsetting improvements in monthly sales in Victoria (up by 4.9 per cent) and Queensland (up by 2.5 per cent). Private sector approvals fell 2.7 per cent during September with a total of 9,266 for the month.
Finally, on the data front, Damien Boey of Credit Suisse suggests that the recent retail sales, construction and trade data all point to a weaker GDP result ahead. He says that the initial estimates of the pulse of growth are surprisingly weak, especially when compared with RBA forecasts. Granted there is more data to come, but the signs are not good. This aligns with our view that a clear sighted view of the economy reveals considerable issues, centred around debt. Yet the official story fixates on low unemployment and the planned budget surplus. John Adams and I discussed this in our provocatively titled “Australia Has “Stage 4 Economic Cancer” and why it is the case that the Government is engaged in significant misdirection.
So to the markets. The Banks had a down day on Friday, perhaps reflecting the uncertainty ahead after the Royal Commission hearings. CBA was down 1.66% to 71.23, NAB was down 1.08% to 24.64, ANZ was down 1.29% to 28.80 and Westpac was down 1.7% to 25.97. Macquarie was down 2.05% to 114.42. Regionals also followed lower, with Bank of Queensland down 1.88% to 9.93, Suncorp down 1.7% to 13.32, and Bendigo was down 1.29% to 10.68. AMP who disclosed potentially more customer remediation ahead, ended down 0.41% to 2.43. They are probably the company most hit by the Royal Commission.
Lenders Mortgage Insurer Genworth moved higher against the trend on Friday, ending up 3.69% to 2.25.
The ASX 100 was down 1.67% to 4,660, in lows not seen for more than a year and the ASX financials index was down 1.58% to 5,742, again at the low end of the range over the past year. The Aussie dollar slide 0.15% down to 73.08 as the USD weakened a little, a little better than earlier in November. The local fear index was higher on Friday up 12.6% to 17.26. To round out the Australian market data, the Aussie Bitcoin ended down 0.34% to 5,553 and the Aussie Gold cross rate was down 0.10% to 1,671.
Overall on Wall Street stocks rose on Friday as investors hoped for progress on trade in a critical U.S.-China meeting over the weekend, with the S&P 500 up 0.81% to 2,759. Of the 11 major sectors in the S&P 500, all but energy ended the session in positive territory. The S&P 100 rose 0.95% to 1,225 and the volatility index, the VIX eased back 3.83% to 18.07.
The worst performers of the session were Goldman Sachs Group which fell 2.13% or 4.16 points to trade at 190.69 at the close. BofA Merrill Lynch downgraded the stock to Neutral from Buy with a $225 price target, slashed from $280, citing the uncertainty around the 1 Malaysia Development Board investigation. The Federal Reserve is ramping up its investigation into how executives dodged the bank’s internal controls while helping Malaysian authorities raise billions of dollars that later went missing, according to people briefed on the matter. The probe examines the actions of Goldman Sachs as well as individuals and has been gaining momentum in recent weeks.
While GS’s decline means the shares already are discounting “most of the potential negative scenarios” related to the issue, limited information means that more bad news could emerge, with lingering uncertainty ahead at the least.
GS “could face fines, penalties and other sanctions, but as of now, we don’t expect it to have a long-term impact on the business,”. Some are saying the bank could face as much as a $2B penalty at the high end, “so it appears to us that the stock has more than discounted the outcome.” Morgan Stanley had downgraded GS last week, also citing uncertainty over the 1MDB scandal.
But overall, The S&P Financials Index was higher up 0.6% to 446.83.
The Nasdaq posted their biggest weekly percentage gains in nearly seven years, and up 0.79% to 7,330. This despite Apple sliding 0.54% on Friday to 178.58. Intel had a strong run, up 3.38% to 49.31 and Alphabet (Google) was also up 1.38% to 1,109.65. Amazon was up 0.99% to 1,690.17.
The Dow saw its largest weekly advance in two years, up 0.79% on Friday to 25,538. Investors were encouraged this week by comments by Federal Reserve Chair Jerome Powell and subsequent minutes from the central bank’s latest meeting that suggested that the Fed will take a data-driven rather than ideological approach to future rate-hikes. In other words, lower rate rises ahead than expected.
The US 3-month benchmark rate fell 0.46% to 2.355 and the US 10-Year bond was 1.43% to 2.992. However, the important 1 Year LIBOR rate is still at 3.12% signalling that the price of interbank funds is still climbing. This is important especially in the less regulated Eurobond market, something which we will revisit in a future post.
With regard to trade, a Chinese official said “consensus is steadily increasing” in trade negotiations between the U.S. and China as the G20 meeting got underway in Buenos Aires, sparking hopes there would be a positive resolution in the ongoing tariff dispute between the world’s two largest economies. U.S. President Donald Trump is set to meet with his Chinese counterpart Xi Jinping on Saturday and the outcome could swing stocks for the rest of the year.
Oil was knocking around 50 during the week and ended down 1.59% to 50.63. Oil achieved a massive 22% drop for November. That was the price West Texas Intermediate crude paid after the Russians stalled again on a production cut, sending the oil market to its biggest monthly loss in a decade. U.S. crude futures finished with their worst month since 2008 after Russian Energy Minister Alexander Novak told domestic news service TASS that producers and consumers were comfortable with current prices. It was the clearest sign that Moscow saw little or no need to contribute to production cuts when it joins Saudi Arabia and other major oil producers at the OPEC+ meeting in Vienna on Dec. 6. But falling oil prices boosted airlines stocks. The Dow Jones Airlines index rose 2.8 percent.
Gold was down 0.25% on Friday to 1,227 but the gold market is betting that President Donald Trump will at least suggest he has one down the road with China. And that was enough for the yellow metal to end a second-straight month in the green and stay above its key $1,200 perch. But there’s no clear indication of what a U.S.-China trade agreement could do for gold. Some analysts think it’ll be good for physical demand of bullion in China as consumers there, spurred by a feel-good sentiment, could splurge on jewellery. Others are betting gold will fall as a contrarian trade to equities, which are almost certain to ramp up on any sign of an end to the bitter acrimony between Washington and Beijing that has already led to hundreds of billions of dollars of duties imposed on bilateral trade.
The US Dollar Index was up 0.46% to 97.22. The Euro Us Dollar was down 0.68% to 1.132 and the British Pound US Dollar was down 0.28% to 1.275, as the Brexit negotiations moved to their final Parliamentary voting stage in the UK in a few days. The results are by no means clear, and the Bank of England said a disorderly Brexit would hit economics performance more than an orderly one but any time of exit would dampen future UK growth. Deutsche Bank was down again, falling 3.07% to 8.10.
And finally Bitcoin continues in the doldrums at 4,011 on Friday, down 5.98%, after the recent fork, The “big block” project that itself forked away from the Bitcoin blockchain in August 2017 fragmented into “Bitcoin Cash ABC” and “Bitcoin Cash SV”. However, by the beginning of this week — some 10 days after the split — CoinGeek published a press release announcing support for a permanent split. As the publication is owned by online gambling tycoon and major Bitcoin SV miner Calvin Ayre, this declaration was considered an “official” end to the hash war. Technical director of the Bitcoin SV project Steve Shadders even committed to implementing replay protection (ensuring that users don’t accidentally spend coins on both chains), while Ayre acknowledged he would let go of the name “Bitcoin Cash” and instead adopt “Bitcoin SV.” Hash power on both coins has dropped significantly since (with Bitcoin Cash ABC still ahead). The two coins will now compete with one another and the market, as all cryptocurrencies do. But again this highlights the inherent risks in the crypto sector.
So in summary, the stresses and strains in the market here and abroad are working out, but people are preferring to look away from the debt burden, instead looking towards other shiny things in the hope that we will not notice the truly breathtaking risks in the system.
Misdirection is a wonderful thing, but eventually truth will out.
And by the way you value the content we produce please do consider supporting our efforts. You can make a one off donation via PayPal, that’s a new facility or consider joining our Patreon programme. We really appreciate those who are contributing to help us continue to make great content.
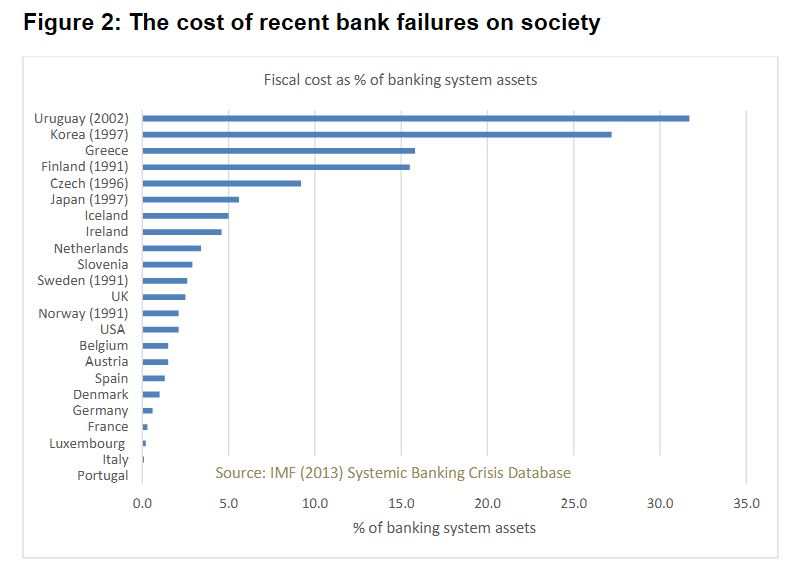
This is probably one of the most significant speeches on the issue, as it gets to the core thinking driving bank regulation. Essentially it is this. If there were to be a financial crisis, experience has shown the costs to the broader economy are substantial, and are born by society.
As a result, Orr argues that while a significant toolkit is available to lean against these risks, the cornerstone is lifting bank capital.
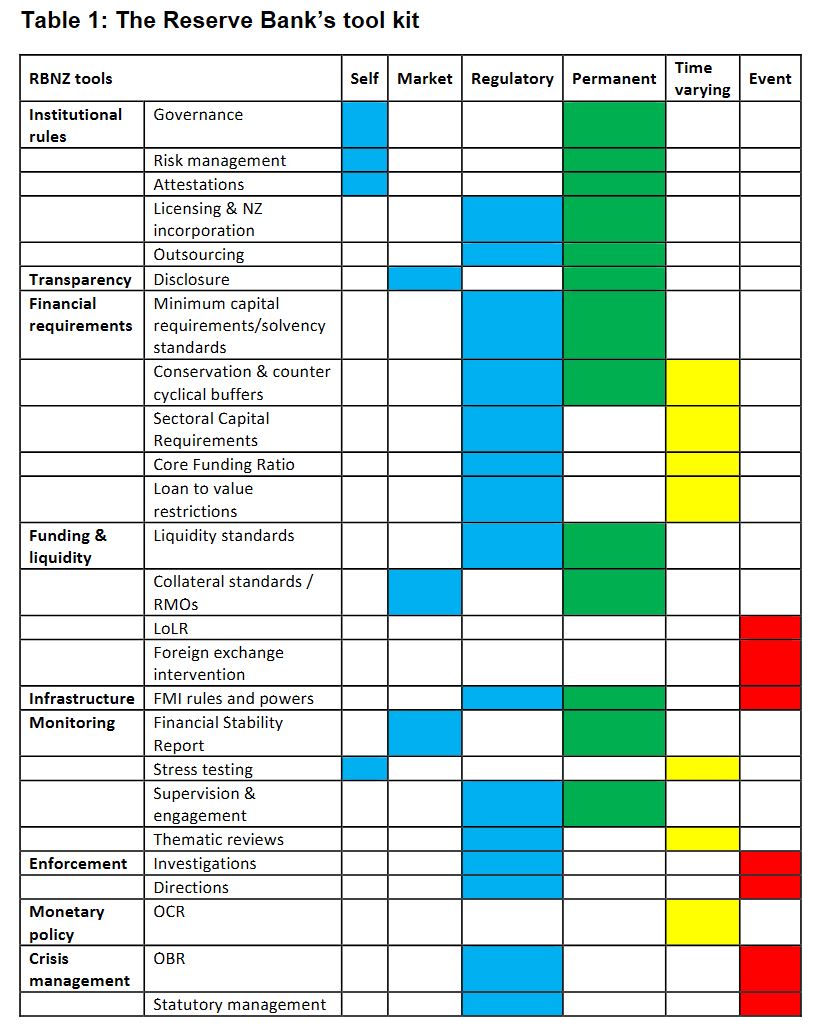
Note though that the toolkit includes under crisis management OBR – deposit bail-in!
As a result, the amount of capital required will be significantly higher.
Implicitly, this approach enables the financial system to continue to expand, to drive debt higher (as we saw in his recent post), with the financial stability risks offset by higher capital. But as we have said many times, this faith in ever great debt as a growth lever is deeply flawed. And those borrowing will be required to pay more, as higher capital costs!
Here is the speech in full.
The Reserve Bank is tasked with ensuring the banking system is both sound and efficient. To achieve our task we have a range of tools (see Table 1). The most important tool in our kit is ensuring banks hold sufficient capital (equity) to be able to absorb unanticipated events. The level of capital reflects the bank owners’ commitment – or skin in the game – to ensure they can operate in all business conditions, bringing public confidence.
Given its importance, we have been undertaking a review of the optimal level of capital for the New Zealand system. We conclude that more capital is better. We are sharing our work with the banking sector and public, and expect to hear one side of the story loud and clear, that capital costs banks. We need to hear a broader perspective than that, to best reflect New Zealand’s risk appetite.
What have we done in practice?
The Reserve Bank needs to ensure there is sufficient capital in the banking “system” to match the public’s “risk tolerance”. This is because it is the New Zealand public – both current and future citizens – who would bear the social brunt of a banking mess.
We know one thing for sure, the public’s risk tolerance will be less than bank owners’ risk tolerance. How do we know this? Surely the more capital a bank has the safer it is and the more it can lend. Why don’t banks hold as much capital as they can?
First, there is cost associated with holding capital, being what the capital could earn if it was invested elsewhere. Second, bank owners can earn a greater return on their investment by using less of their own money and borrowing more – leverage. And, the most a bank owner can lose is their capital. The wider public loses a lot more (see Figure 2).
Hence, we need to impose capital standards on banks that matches the public’s risk tolerance. We have been reassessing the capital level in the banking sector that minimises the cost to society of a bank failure, while ensuring the banking system remains profitable.
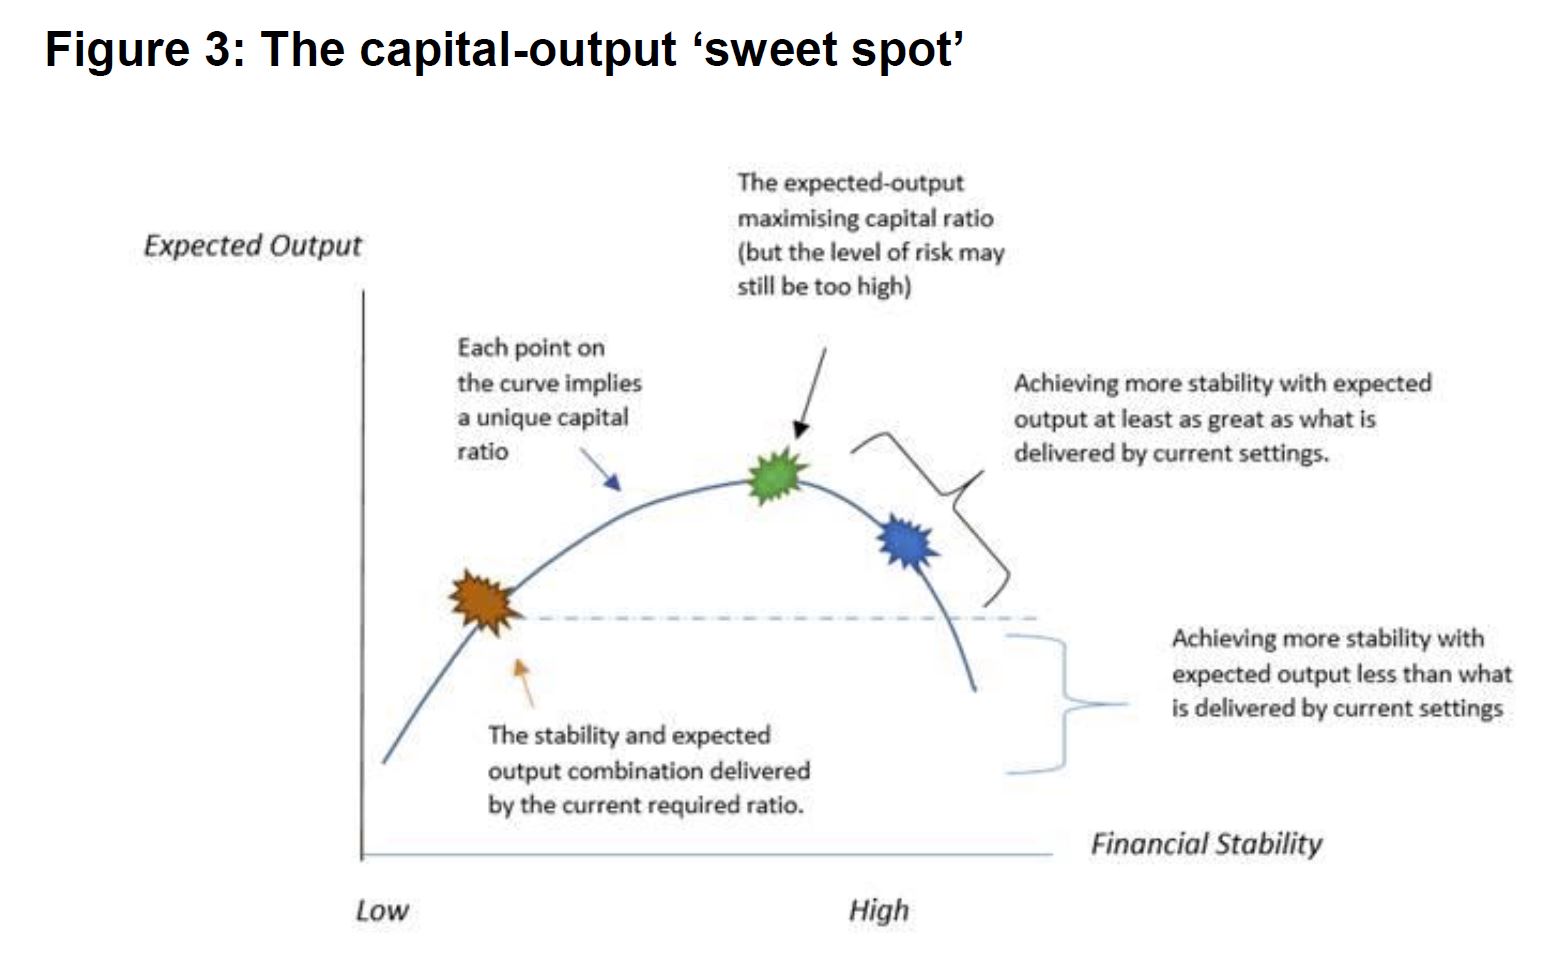
The stylised diagram in Figure 3 highlights where we have got to. Our assessment is that we can improve the soundness of the New Zealand banking system with additional capital with no trade-off to efficiency.
In making this assessment, our recent work makes the explicit assumption that New Zealand is not prepared to tolerate a system-wide banking crisis more than once every 200 years. We have calibrated our ‘sweet spot’ thinking about economic ‘output’ and financial stability benefits.
How did we arrive at this position?
Current levels of capital are based on international standards, and are not optimal for any one country. The standards are also a minimum. There is a clear expectation that individual countries tailor the standards to their financial system’s needs.
Banks also hold more capital than their regulatory minimums, to achieve a credit rating to do business. The ratings agencies are fallible however, given they operate with as much ‘art’ as ‘science’.
Bank failures also happen more often and be more devastating than bank owners – and credit ratings agencies – tend to remember. The costs are spread across the public and through time.
Many large banks are foreign owned – especially in New Zealand. Their ‘parents’ are subject to capital requirements in their home and host country. This creates continuous tension as to who gets the lion’s share of capital and failure management support. It would be naïve to expect a foreign taxpayer to bail out a domestic banking crisis.
Hence, New Zealand needs to assess its own risk tolerance, and decide who pays to clean up any mess and the scale of that mess.
A word of caution. Output or GDP are glib proxies for economic wellbeing – the end goal of our economic policy purpose. When confronted with widespread unemployment, falling wages, collapsing house prices, and many other manifestations of a banking crisis, wellbeing is threatened. Much recent literature suggests a loss of confidence is one cause of societal ills such as poor mental and physical health, and a loss of social cohesion. If we believe we can tolerate bank system failures more frequently than once-every-200 years, then this must be an explicit decision made with full understanding of the consequences.
The provisional agreement on minimum levels of bail-inable subordinated debt in the EU’s Bank Recovery and Resolution Directive (BRRD) may leave senior creditors of medium-sized banks more exposed if those banks fail, Fitch Ratings says. This could include, in extremis, wholesale depositors.
Minimum subordinated debt requirements may be amended to apply only to global systemically important banks (G-SIBs) and “top-tier” banks with assets above EUR100 billion, according to a statement from Gunnar Hoekmark, the EU Parliament’s rapporteur, on his website last Thursday. This would be consistent with a draft proposal discussed by the European Council in May.
As we noted in May, limiting bail-able debt requirements to the largest banks could mean medium-sized banks’ senior creditors miss out on the protection that subordinated debt buffers would provide. The agreement could make it more difficult to apply the EU’s bail-in framework to medium-sized banks, for example if there were legal challenges from bondholders that are bailed in while equally ranking creditors (such as wholesale depositors) are not.
Alternatively, if equally ranking retail bondholders and wholesale depositors were bailed in alongside institutional bondholders, this could create financial stability risks. The European Commission will assess whether all deposits should be preferred in an insolvency by December 2020.
The protection provided by minimum requirements is reflected in our bank ratings. Once subordinated bail-in and other unused debt buffers junior to preferred senior debt (for instance, unused additional Tier 1 and Tier 2) have been sufficiently built up, senior ranking debt can be rated one notch above the senior bail-inable debt.
The EUR100 billion cut-off is particularly relevant to less-concentrated banking systems, for example in Italy and Spain, and to smaller EU countries. For banks below the threshold, it could be challenging and costly to issue large amounts of subordinated debt, particularly for smaller banks that are less frequent borrowers in the debt capital markets. This is likely to explain why southern EU member states want to limit the application of minimum subordination requirements to avoid forcing any but the largest banks to build subordinated debt buffers.
For this reason, we expect the final rules will give national resolution authorities the option to request subordinated minimum required eligible liabilities and own funds (MREL) for banks which they deem systemic – but this will not be automatic, as it is for the top-tier banks and GSIBs. This will lead to variations in the approaches of EU member states to ensuring banks have sufficient loss-absorbing debt.
The provisional agreement to amend the BRRD also proposes a discretionary cap for the requirement for subordinated MREL at 27% of a bank’s total risk exposure. This would limit the associated costs for large systemic banks, but would leave their senior creditors less well protected in the event of outsized losses. The full rules, as part of the broader EU banking legislation package, are now likely to emerge before the end of this year.

 Households are defined as “stressed” when net income (or cash flow) does not cover ongoing costs. They may or may not have access to other available assets, and some have paid ahead, but households in mild stress have little leeway in their cash flows, whereas those in severe stress are unable to meet repayments from current income. In both cases, households manage this deficit by cutting back on spending, putting more on credit cards and seeking to refinance, restructure or sell their home. Those in severe stress are more likely to be seeking hardship assistance and are often forced to sell.