ABC Checkout looks at Pay Day Loans, using data from our consumer research and the Stressed Financial Landscape Report.
 DFA has completed detailed analysis of households and their use of small amount credit contracts, a.k.a. payday lending.
Digital Finance Analytics (DFA) Blog
"Intelligent Insight"

ABC Checkout looks at Pay Day Loans, using data from our consumer research and the Stressed Financial Landscape Report.
DFA has completed detailed analysis of households and their use of small amount credit contracts, a.k.a. payday lending.
It seems that eventually mortgage rates will rise in Australia, as global forces exert external pressure on the RBA, and as the RBA tries to normalise rates (at say 2% higher than today). Timing is, of course, not certain.
But it is worth considering the potential impact. While our mortgage stress analysis takes a cash flow view of household finances, our modelling can look at the problem another way.
One algorithm we have developed is a rate sensitivity calculation, which takes a household’s mortgage outstanding, at current rates, and increments the interest rate to the point where household affordability “breaks”. We use data from our household survey to drive the analysis.

We have just run this analysis with data to end October 2017. We will explore the top line results, and then drill into some NSW specific analysis.
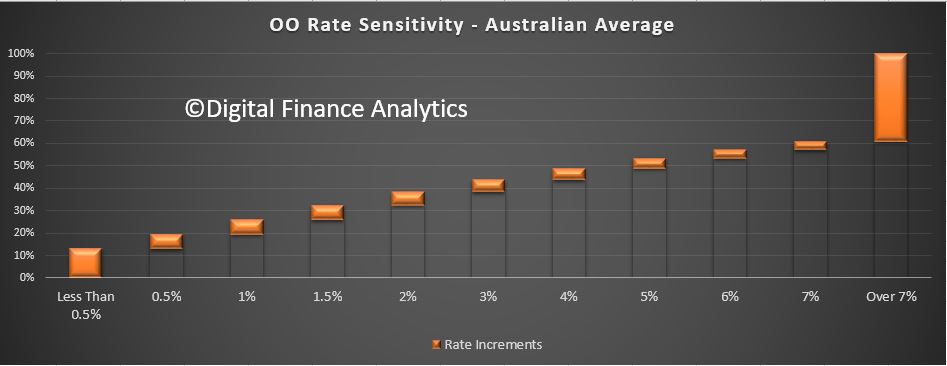
So we start with the average across the country. We find that around 10% of households would run into affordability issues with less a 0.5% hike in mortgage rates, and around another 8% would be hit if rates rose 0.5%, and a larger number would be added to the “in pain” pile, giving us a total of around 25% of households across the country in difficulty if rates went 1% higher. [Note that the calculation does not phase the rate increases in]. Around 40% of households would be fine even if rates when more than 7% higher.
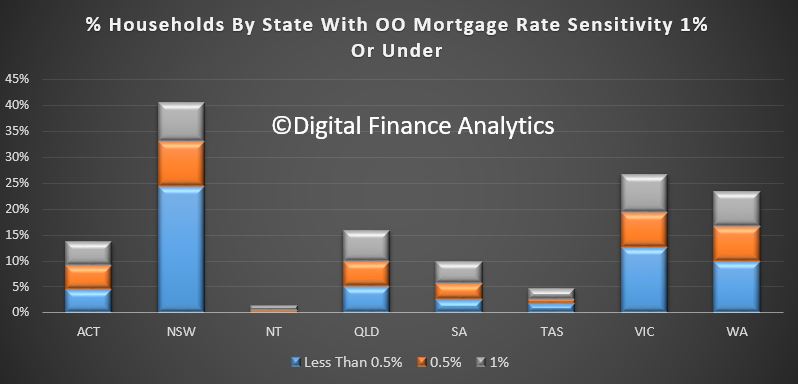
 We can run a similar calculation at a state level. The chart below shows the relative impact on less than 0.5%, 0.5% and 1% rate rises, giving a cumulative total. We find that around 40% of households in NSW would have a problem, compared with 27% in VIC and 24% in WA.
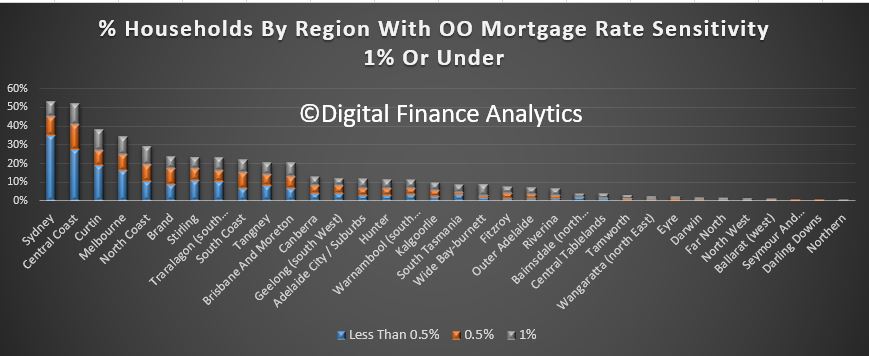
 We can also take the analysis further, to a regional view across the states. This reveals that the worst impacted areas would be, in order, Greater Sydney, Central Coast, Curtain and Greater Melbourne. These are all areas where home prices relative to income are significantly extended, thus households are highly leveraged.
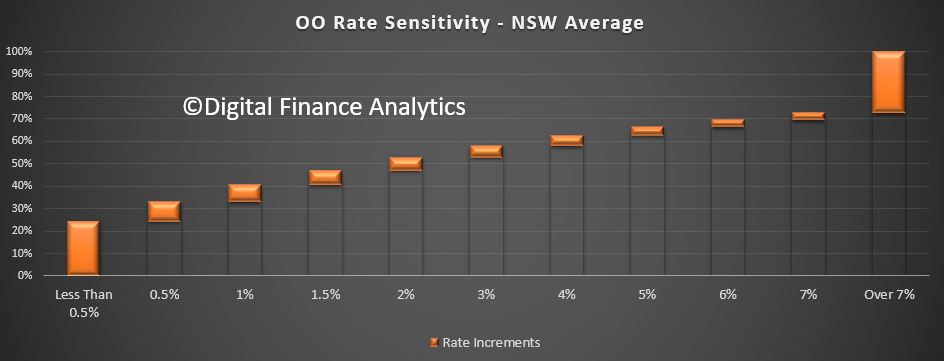
 Now lets look further at NSW. Here is the NSW footprint, including all the rate increase bands. More than 30% are protected even if rates are 7% or more higher.
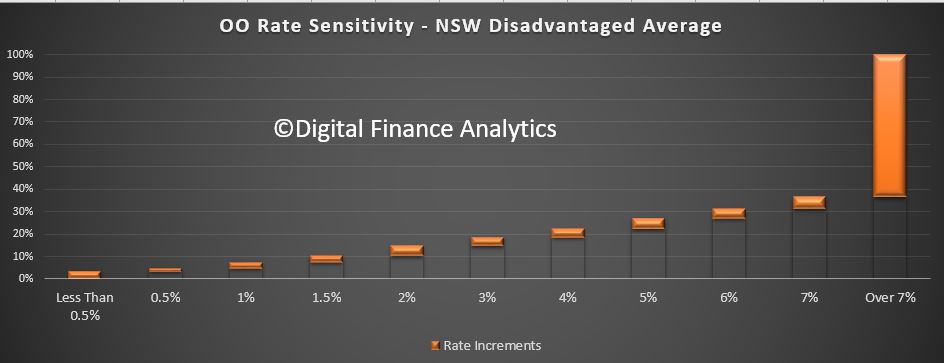
 We can look at the type of households, using our segmentation modelling. Many will expect households in the disadvantaged areas of Greater Sydney to be worst hit by rate rises. This however is not the case, simply because they have smaller mortgages, lenders have lent cautiously, and because these households are use to handling difficult cash flows. Despite this, around 8% of households would be hit hard by a 1% rise in mortgage rates, enough to be a problem, but probably a lower proportion than would be expected.
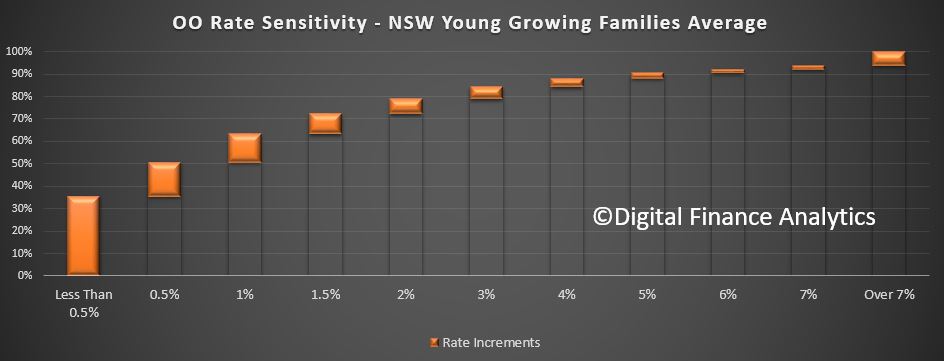
 However, young growing families have more of an issue (this will include a number of first time buyers), with around 35% in difficulty in the case of just a small rise, and more than 60% at risk at 1% higher than today. Loans are relatively large compared with incomes (which are not rising faster than cpi).
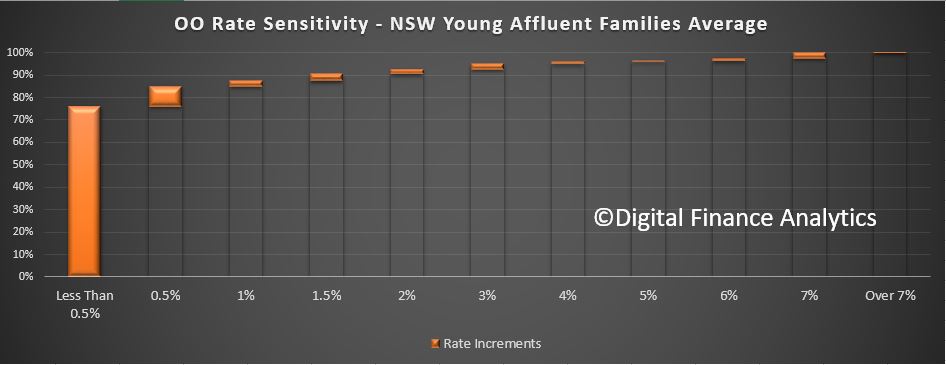
 But the segment with the most significant exposure is the Young Affluent household group. These households, which also includes some first time buyers, have larger incomes, but also larger mortgages, and are leveraged significantly, such that more than 70% of this group would struggle with a small rise. More than 85% would have issues with a 1% rate rise.
Many of these households have bought new high-rise apartments in the inner suburban ring, for example around Bondi, Wolli Creek and Hurstville.
 So, in a rate increase scenario, we think specific households and locations will be disproportionately hit. The banks should be incorporating this type of analysis in their risk scenario models and underwriting standards. We think some are still lending too generously. The ~7.25 rate floor is not enough to protect borrowers or the bank.
Digital Finance Analytics has released the latest edition of our flagship channel preferences report – “The Quiet Revolution” Volume 3, now available free on request, using the form below.
This report contains the latest results from our household surveys with a focus on their use of banking channels, preferred devices and social media trends.
 Our research shows that consumers have largely migrated into the digital world and have a strong expectation that existing banking services will be delivered via mobile devices and new enhanced services will be extended to them. Even “Digital Luddites”, the least willing to migrate are nevertheless finally moving into the digital domain. Now the gap between expectation and reality is larger than ever.
Looking across the transaction life cycle, from search, apply, transact and service; universally the desire by households to engage digitally is now so compelling that banks have no choice but to respond more completely.
We also identified a number of compelling new services which consumers indicated they were expecting to see, and players need to develop plans to move into these next generation banking offerings. Many centre around bots, smart agents and “Siri-Like” capabilities.
We have developed a mud-map to illustrate the journey of investment and disinvestment in banking. The DFA Banking Innovation Life Cycle, which is informed by our research, highlights the number of current assets and functions which are in the slope of decline, and those climbing the hill of innovation. A number of current “fixtures” in the banking landscape will decline in importance, and in relatively short order.
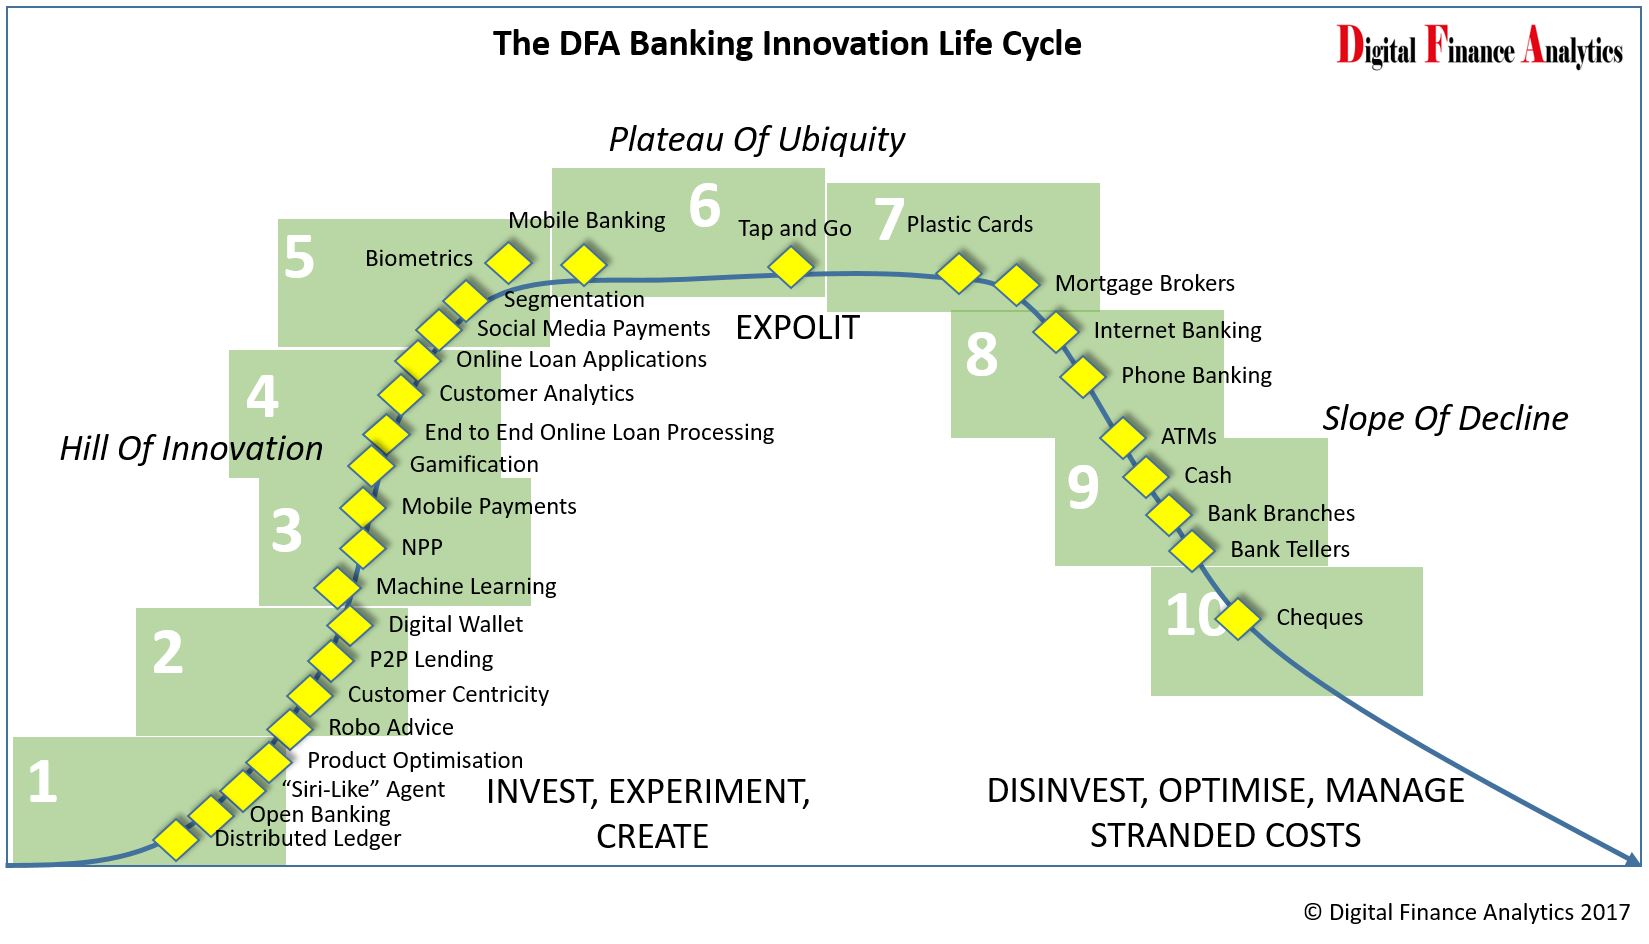 We are now at a critical inflection point in the development of banking as digital now takes the lead. Players must move from omni-channel towards digital first strategies, where the deployment of existing services via mobile is just the first stage in the development of new services, designed from the customers point of view and offering real value added capabilities. These must be delivered via mobile devices, and leverage the capabilities of social media, big data and advanced analytics.
This is certainly not a cost reduction exercise, although the reduction in branch footprint, which we already see as 10% of outlets have closed in the past 2 years, does offer the opportunity to reduce the running costs of the physical infrastructure. Significant investment will need to be made in new core capabilities, as well as the reengineering of existing back-end systems and processes. At the same time banks must deal with their “stranded costs”.
The biggest challenges in this migration are cultural and managerial. But the evidence is clear that customers are already way ahead of where most banks are in Australia today. This means there is early mover advantage, for those who handle the transition swiftly. It is time to get off the fence, and on the digital transformation fast track. Now, banking has to be rebuilt from the bottom up. Digitally.
Request the report [44 pages] using the form below. You should get confirmation your message was sent immediately and you will receive an email with the report attached after a short delay.
Note this will NOT automatically send you our research updates, for that register here. You can find details of our other research programmes here.
[contact-form to=’mnorth@digitalfinanceanalytics.com’ subject=’Request The Quiet Revolution Report 3 – 2018′][contact-field label=’Name’ type=’name’ required=’1’/][contact-field label=’Email’ type=’email’ required=’1’/][contact-field label=’Email Me The Report’ type=’radio’ required=’1′ options=’Yes Please’/][contact-field label=’Comment if You Like’ type=’textarea’/][/contact-form]
The first edition is still available, in which we discuss the digital branding of incumbents and challengers, using our thought experiment.
Volume 2 from 2016 is also available.
In our latest weekly update, we explore how that RBA is caught between stronger global economic indicators, and weaker local conditions, and what this means for local households, the property market and banks.
 Welcome to the Property Imperative weekly to 11th November 2017. Read the transcript or watch the video.
We start this weeks’ digest with the latest results from the banking sector.
CBA’s 1Q18 Trading Update reported a rise in profit, and volumes, as well as a lift in capital. Expenses were higher, reflecting some provisions relating to AUSTRAC, but loan impairments were lower. WA appears to be the most problematic state. Their unaudited statutory net profit was around $2.80bn in the quarter and their cash earnings was $2.65bn in the quarter, up 6%. Both operating income and expense was up 4%.
Westpac’s FY17 results were a bit lower than expected, impacted by lower fees and commissions, pressure on margins, the bank levy and a one-off drop to compensate certain customers. Despite a strong migration to digital, driving 59 fewer branches and a net reduction of ~500 staff, expenses were higher than expected. There has been a 23% reduction in branch transactions over the past two years in the consumer bank, once again highlighting the “Quiet Revolution” underway and the resulting problem of stranded costs. Treasury had a weak second half. But the key point, to me, is that around 70% of the bank’s loan book was in one way or another linked to the property sector, so future performance will be determined by how the property market performs. Provisions were lower this cycle, and at lower levels than recent ANZ and NAB results. WA mortgage loans have the highest mortgage arrears but were down a bit.
Looking at mortgage defaults across the reporting season, there were some significant differences. Some, like Westpac, indicated that WA defaults in particular are easing off now, while others, like ANZ and Genworth, are still showing ongoing rises. This may reflect different reporting periods, or it may highlight differences in underwriting standards. Our modelling suggests that the rate of growth in stress in WA is indeed slowing, but it is rising in NSW (see the Nine TV News Segment on this which featured our research) and VIC; and there is an 18 to 24-month lag between mortgage stress and mortgage default. So, in the light of expected flat income growth, continued growth in mortgage lending currently at 3x income, rising costs of living and the risk of international funding rates rising too, we think it is too soon to declare defaults have peaked. One final point, many households have sufficient capital buffers to repay the bank, thanks to ongoing home price rises. Should prices start to fall, this would change the picture significantly.
Banks have enjoyed strong balance sheet growth in recent years as they lend ever more for mortgages, at the expense of productive business lending. A number of factors have driven the housing boom including population and income growth for the past 25 years, a huge fall in interest rates and increases in the tax advantages to property investment through negative gearing and the halving of the capital gains tax level.
Fitch Ratings says the banks’ had solid results for the 2017 financial year, supported by robust net interest margins and strong asset quality. However, Australia’s four major banks will face earnings pressure from higher impairment charges and lower revenue growth in their 2018 financial year, and cost control to remain an important focus. They benefitted from the APRA inspired repricing of mortgages, and from lower impairment charges. Fitch said that mortgage arrears have increased modestly from low bases in most markets – Western Australia has had more noticeable deterioration – and they expect this trend to continue in FY18 due in part to continued low wage growth and an increase in interest rates for some types of mortgages.
The latest household finance data from the ABS confirms what we already knew, lending momentum is on the slide, and first time buyers, after last month’s peak appear to have cooled. With investors already twitchy, and foreign investors on the slide, the level of buyer support looks anaemic. Expect lots of “special” refinance rates from lenders as they attempt to sustain the last gasp of life in the market.
The number of new loans to first time buyers was down 6.3%, or 630 on last month. We also see a fall in fixed loans, down 14%. The DFA sourced investor first time buyers also fell again, down 4%. More broadly, the flow of new loans was down $19 million or 0.06% to $33.1 billion. Within that, investment lending flows, in trend terms, fell 0.52% or $62.8 million to $12.1 billion, while owner occupied loans rose 0.32% or $47.7 million to $15.0 billion. So investment flows were still at 44.6% of all flows, excluding refinances. Refinances comprise 17.9% of all flows, down 0.07% or $3.9 million, to $5.9 billion.
Auction volumes were also lower this past week, partly because of the Melbourne Cup festivities, and CoreLogic’s latest data suggests a slowing trend, more homes listed, and further home price falls in Greater Sydney. As a result, we expect home lending to trend lower ahead.
The MFAA says there has been a boom in mortgage brokers, but this may be unsustainable, given lower mortgage growth. The snapshot, up to March 2017, shows that the number of brokers was estimated to be 16,009, representing 1 broker for every 1,500 in the population and they originated around 53% of new loans. Overall the number of brokers rose 3.3% but net lending grew only 0.1%. As a result, the average broker saw a fall in their gross annual income. Also, on these numbers, brokers cost the industry more than $2 billion each year!
We published data on the dynamic loan-to-income data (LTI) from our household surveys. Currently we estimate that more than 20% of owner occupied mortgage loans on book have a dynamic LTI of more than 4 times income. Some LTI’s are above 10 times income, and though it’s a relatively small number, they are at significantly higher risk. Looking at the data by state, we see that by far the highest count of high LTI loans resides in NSW (mainly in Greater Sydney), then VIC and WA. Younger households have a relatively larger distribution of higher LTI loans. Reading across our core segmentation, we see that Young Affluent, Exclusive Professional and Multi-Cultural Establishment are the three groups more likely to have a high dynamic LTI. We also see a number of Young Growing Families in the upper bands too. As many lenders also hold the transaction account for their mortgage borrowers, it is perfectly feasible to build an algorithm which calculates estimated income dynamically from their transaction history, and use this to estimate a dynamic LTI. This would give greater insight into the real portfolio risks, compared with the blunt instrument of LVR. It is less misleading that LTI or LVR at origination.
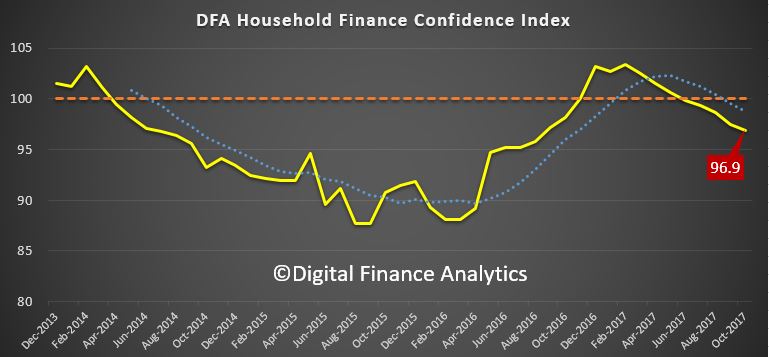
The latest edition of our Household Financial Security Confidence Index to end October shows households are feeling less secure about their finances than in September. The overall index fell from 97.5 to 96.9, and remains below the 100 neutral setting. We use data from our household surveys to calculate the index. While households holding property for owner occupation remain, on average, above the neutral setting, property investors continue to slip further into negative territory, as higher mortgage rates bite, rental returns slide and capital growth in some of the major markets stalls. Property inactive households remain the most insecure however, so owning property in still a net positive in terms of financial security. There are significant variations across the states. VIC households continue to lead the way in terms of financial confidence, and WA households are moving up from a low base score. However, households in NSW see their confidence eroded as prices slide in some post codes (the average small fall as reported does not represent the true variation on the ground – some western Sydney suburbs have fallen 5-10% in the past few months). Households in QLD and SA on average have held their position this month. Confidence continues to vary by age bands, although the average scores have drifted lower again. Younger households are consistently less confident, compared with older households, who tend to have smaller mortgages relative to income, and more equity in property and greater access to savings.
As expected the RBA held the cash rate again this week, for the 15th month in a row. The RBA’s statement on Monetary Policy highlighted the tension between stronger global growth, reflected in expected rising interest rate benchmarks in several countries, including the USA; and weaker inflation and growth in Australia. As a result, pressure to lift the cash rate here appears lower than before. Underlying inflation is expected to remain steady at around 1¾ per cent until early 2019, before increasing to 2 per cent. The revised CPI weightings now announced by the ABS, will tend to reduce the inflation numbers in the next release. The RBA suggests growth will be lower for longer though is still holding to a 3% growth rate over their forecast period, They also highlighted the impact of stagnant wage growth and high household debt once again.
If rates do stay lower for longer here, it may benefit households already suffering under mountains of mainly housing related debt, but put pressure on the dollar and terms of trade, as rates overseas climb, sucking investment dollars away from Australia and lifting funding costs. Some are suggesting that the gap between income and credit growth, 2% compared with 6% over the past year, will require the RBA to lift the cash rate sooner, and ANZ for example is still forecasting rate hikes in 2018.
International conditions are on the improve, and many assume the rises in benchmark cash rates will be slow and steady. However, A GUEST post on the unofficial Bank of England’s “Bank Underground” blog makes the point, by looking at data over the past 700 years, that most reversals after periods of interest rate declines are rapid. When rate cycles turn, real rates can relatively swiftly accelerate. The current cycle of rate decline is one of the longest in history, but if the analysis is right, the rate of correction to more normal levels may be quicker than people are expecting – and a slow rate of increases designed to allow the economy to acclimatize may not be possible. Not pretty if you are a sovereign or household sitting on a pile of currently cheap debt!
So, we see on one side global conditions improving, with interest rates set to rise, while locally economic indicators are weakening suggesting the RBA may hold the cash rate lower for longer. This is creating significant tension, and highlights the dilemma the regulators face. But as we said before, this is a problem of their own making, as they dropped rates too far, and did not recognise the growing risks in the housing sector soon enough. So, already on the back foot, we expect to see some further targeted regulatory intervention, and we expect the cash rate to stay lower for longer, until the international upward pressure swamps the local situation. We think this may be much sooner than many, who are now talking of no rate change for a couple of years. Meantime households with large loans, little income growth and facing rising costs will continue to spend less, tap into savings, and muddle though. Not a good recipe for future growth, and economic success. As Laurel and Hardy used to say ” Well, here’s another nice mess you’ve gotten me into!”
And that’s the Property Imperative Weekly to 11th November 2017. If you found that useful, do leave a comment, subscribe to receive future updates, and check back next week.
The latest edition of the Digital Finance Analytics Household Financial Security Confidence Index to end October shows households are feeling less secure about their finances than in September. The overall index fell from 97.5 to 96.9, and remains below the 100 neutral setting. We use data from our household surveys to calculate the index.
 While households holding property for owner occupation remain on average above the neutral setting, property investors continue to slip further into negative territory, as higher mortgage rates bite, rental returns slide and capital growth in some of the major markets stalls. Those property inactive households remain the most insecure however, so owning property in still a net positive in terms of financial security.
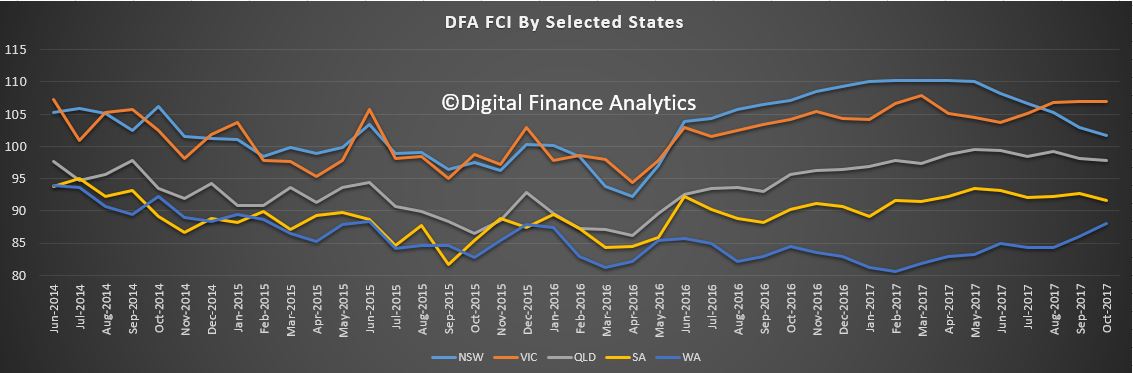
 There are significant variations across the states. VIC households continue to lead the way in terms of financial confidence, and WA households are moving up from a low base score. However, households in NSW see their confidence eroded as prices slide in some post codes (the average small fall as reported does not represent the true variation on on the ground – some western Sydney suburbs have fallen 5-10% in the past few months). Households in QLD and SA on average have held their position this month.
 Confidence continues to vary by age bands, although the average scores have drifted lower again. Younger households are consistently less confident, compared with older households, who tend to have smaller mortgages relative to income, and more equity in property and greater access to savings.
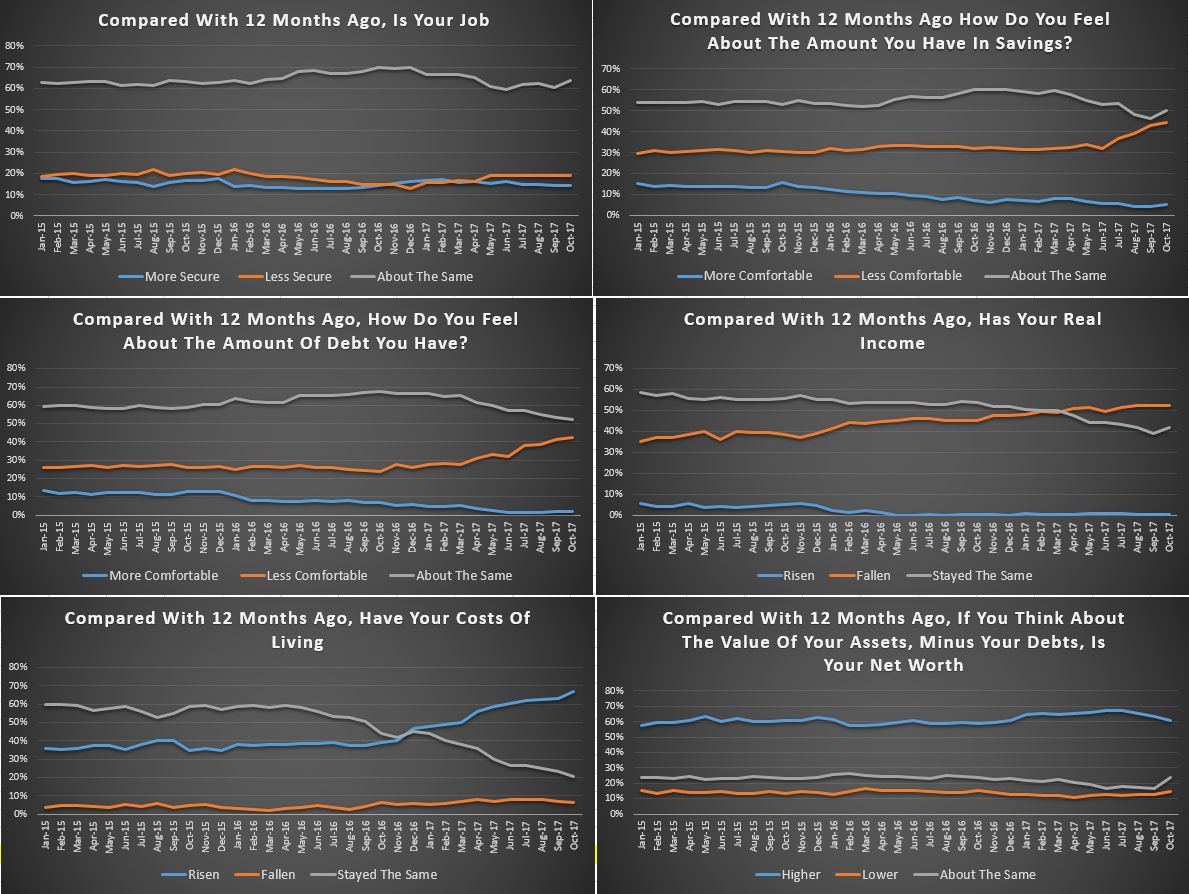
 Looking in more detail at the FCI scorecard, 63% of household saw no change in their job prospects last month, while 19% felt less secure, especially in WA and SA. Those with savings were a little less comfortable, reflecting both a net reduction in the amount saved (more households are raiding their savings to cover their costs of living) and lower interest rates on deposits. Those with shares and other investments benefited from higher stock prices.
The burden of debt weighed heavy on many households with 42% of households less comfortable with their debt, a rise of 1.4% in the month. Some were concerned about potential interest rate rises, while others, especially those on interest only loans, were exercised by the prospect of having to refinance down the track.
More than half of households say their real incomes have fallen in the past year, and 67% said their costs of living have risen, up 4.1% from last month. Utility bills are higher, as are child care costs and school fees. We see more household relying on multiple part-time jobs to bring in sufficient income to pay the bills, and even then many are having to tap into savings to keep afloat.
 We see little evidence of income growth in real terms, while credit growth continues at more than three time income. Given the recent slide in property values, and continued rises in living costs, we do not expect the index to move back into positive territory in the next few months.
By way of background, these results are derived from our household surveys, averaged across Australia. We have 52,000 households in our sample at any one time. We include detailed questions covering various aspects of a household’s financial footprint. The index measures how households are feeling about their financial health. To calculate the index we ask questions which cover a number of different dimensions. We start by asking households how confident they are feeling about their job security, whether their real income has risen or fallen in the past year, their view on their costs of living over the same period, whether they have increased their loans and other outstanding debts including credit cards and whether they are saving more than last year. Finally we ask about their overall change in net worth over the past 12 months – by net worth we mean net assets less outstanding debts.
We will update the results again next month.
A brief segment broadcast today on the Nine network, using the data from our mortgage stress surveys.
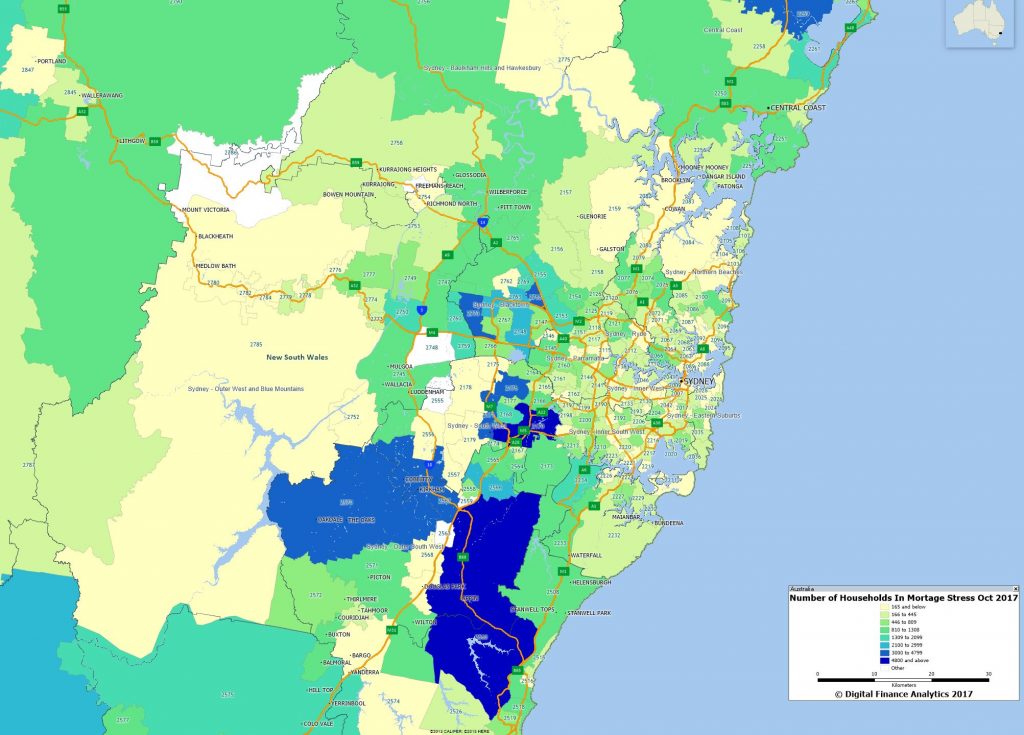
Here is our Greater Sydney mapping in detail. Read more here.
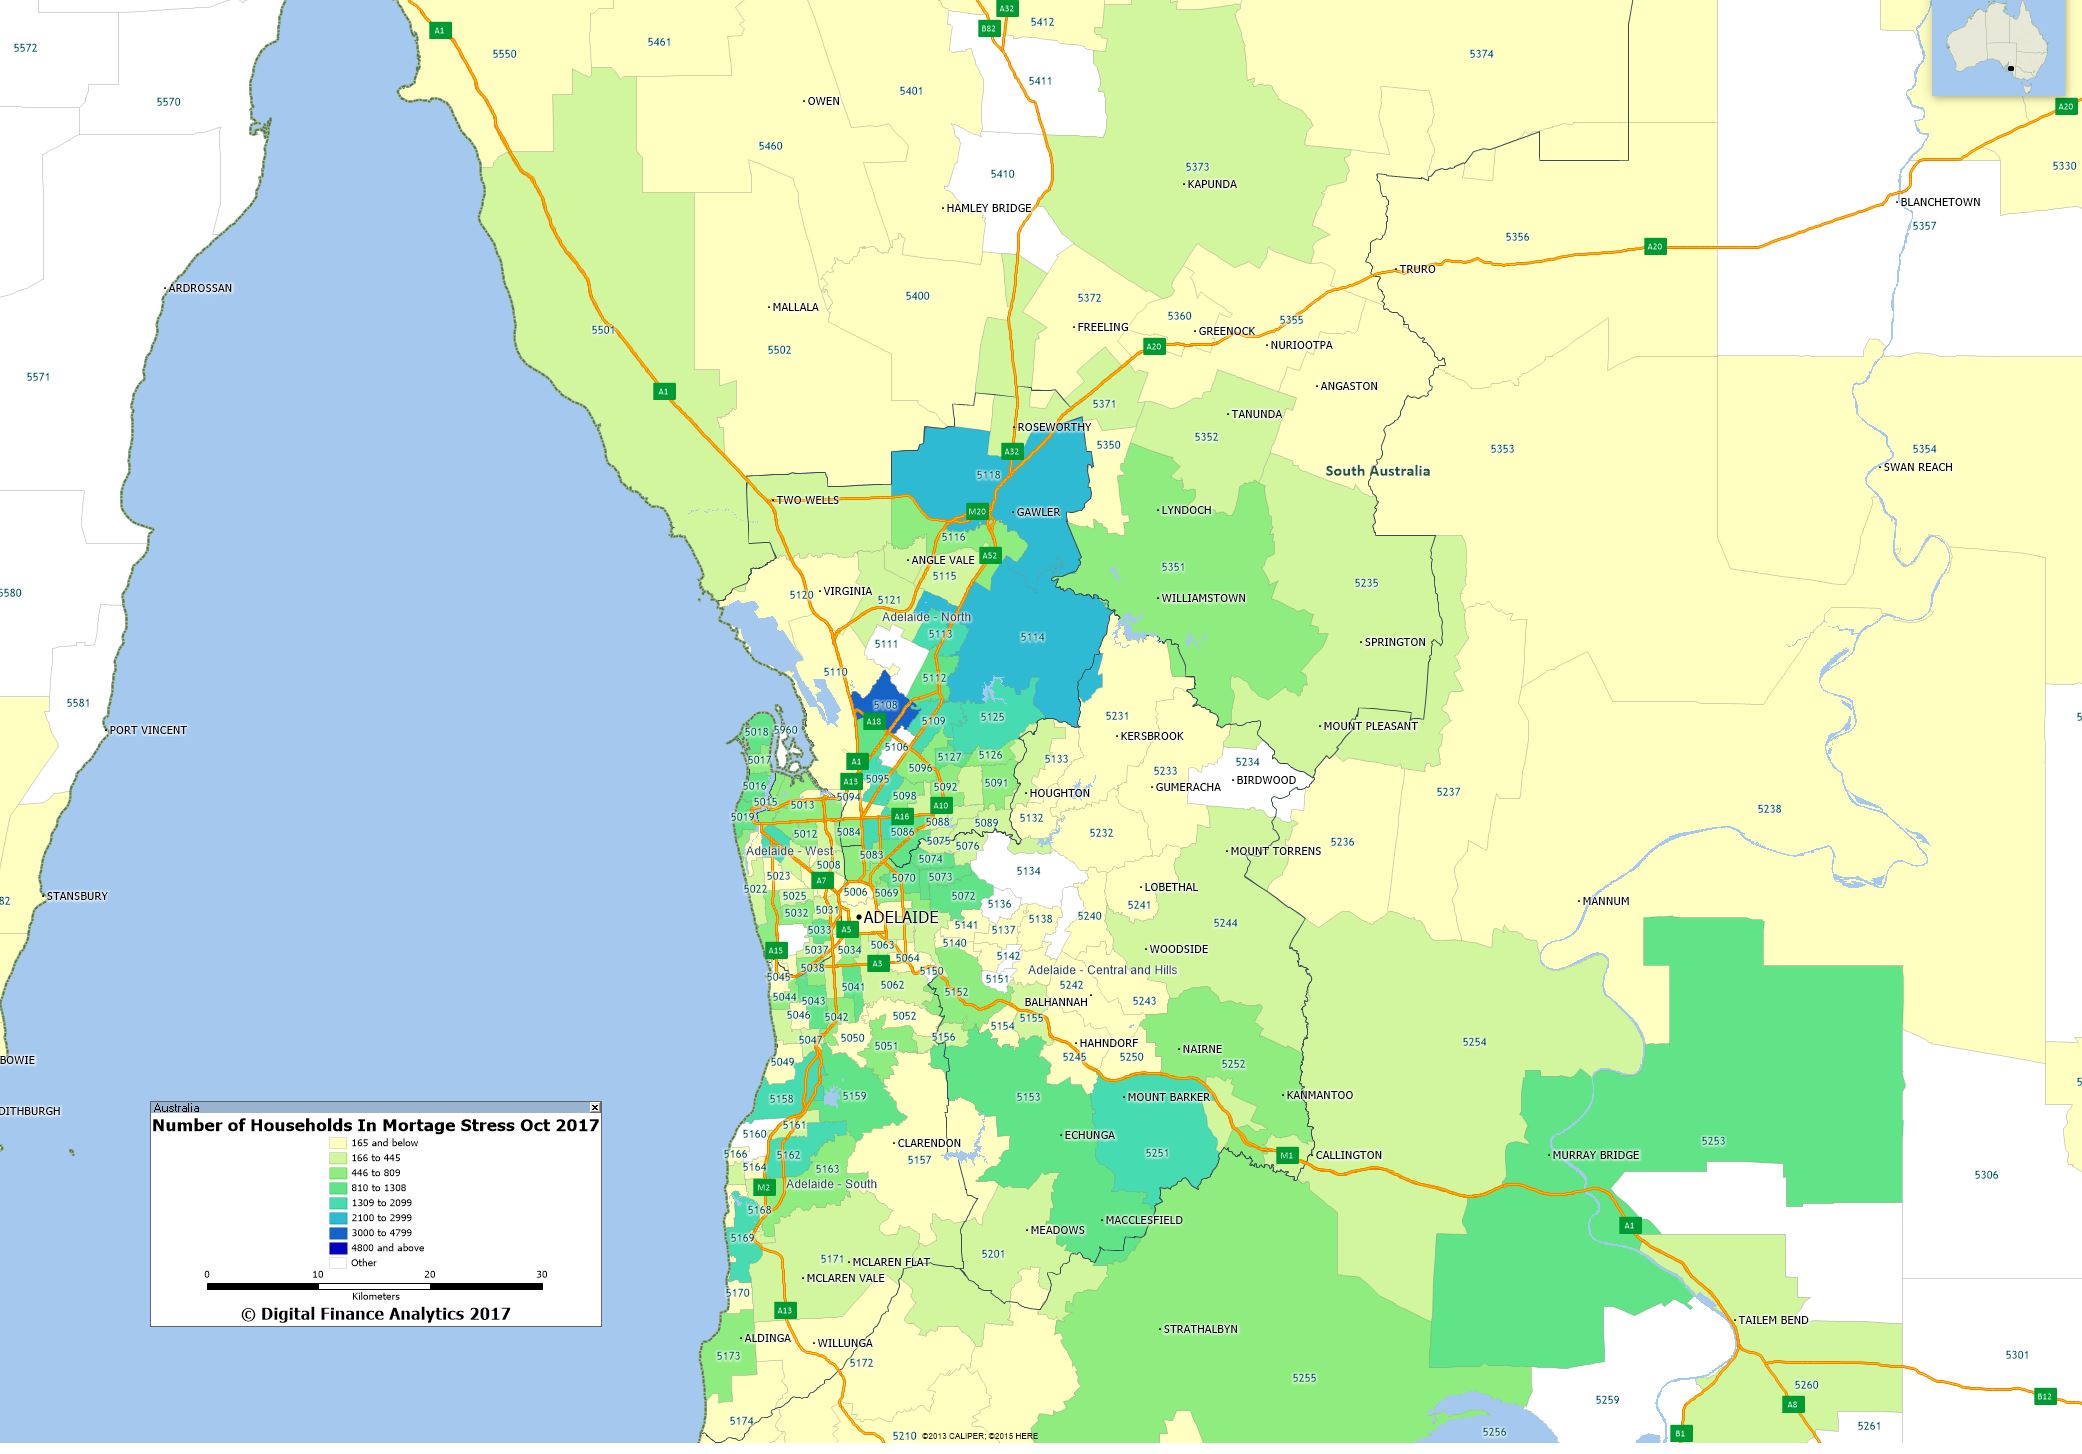
Following our October 2017 Mortgage Stress update, here is a map of the count of households in mortgage stress in Greater Adelaide, using our Core Market Model.
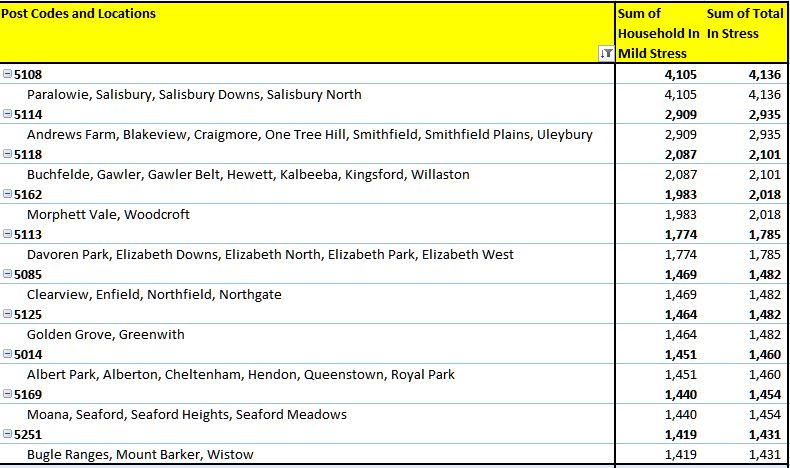
 Here is a list of the top 10 most stressed post codes in SA, by the number of households in stress.
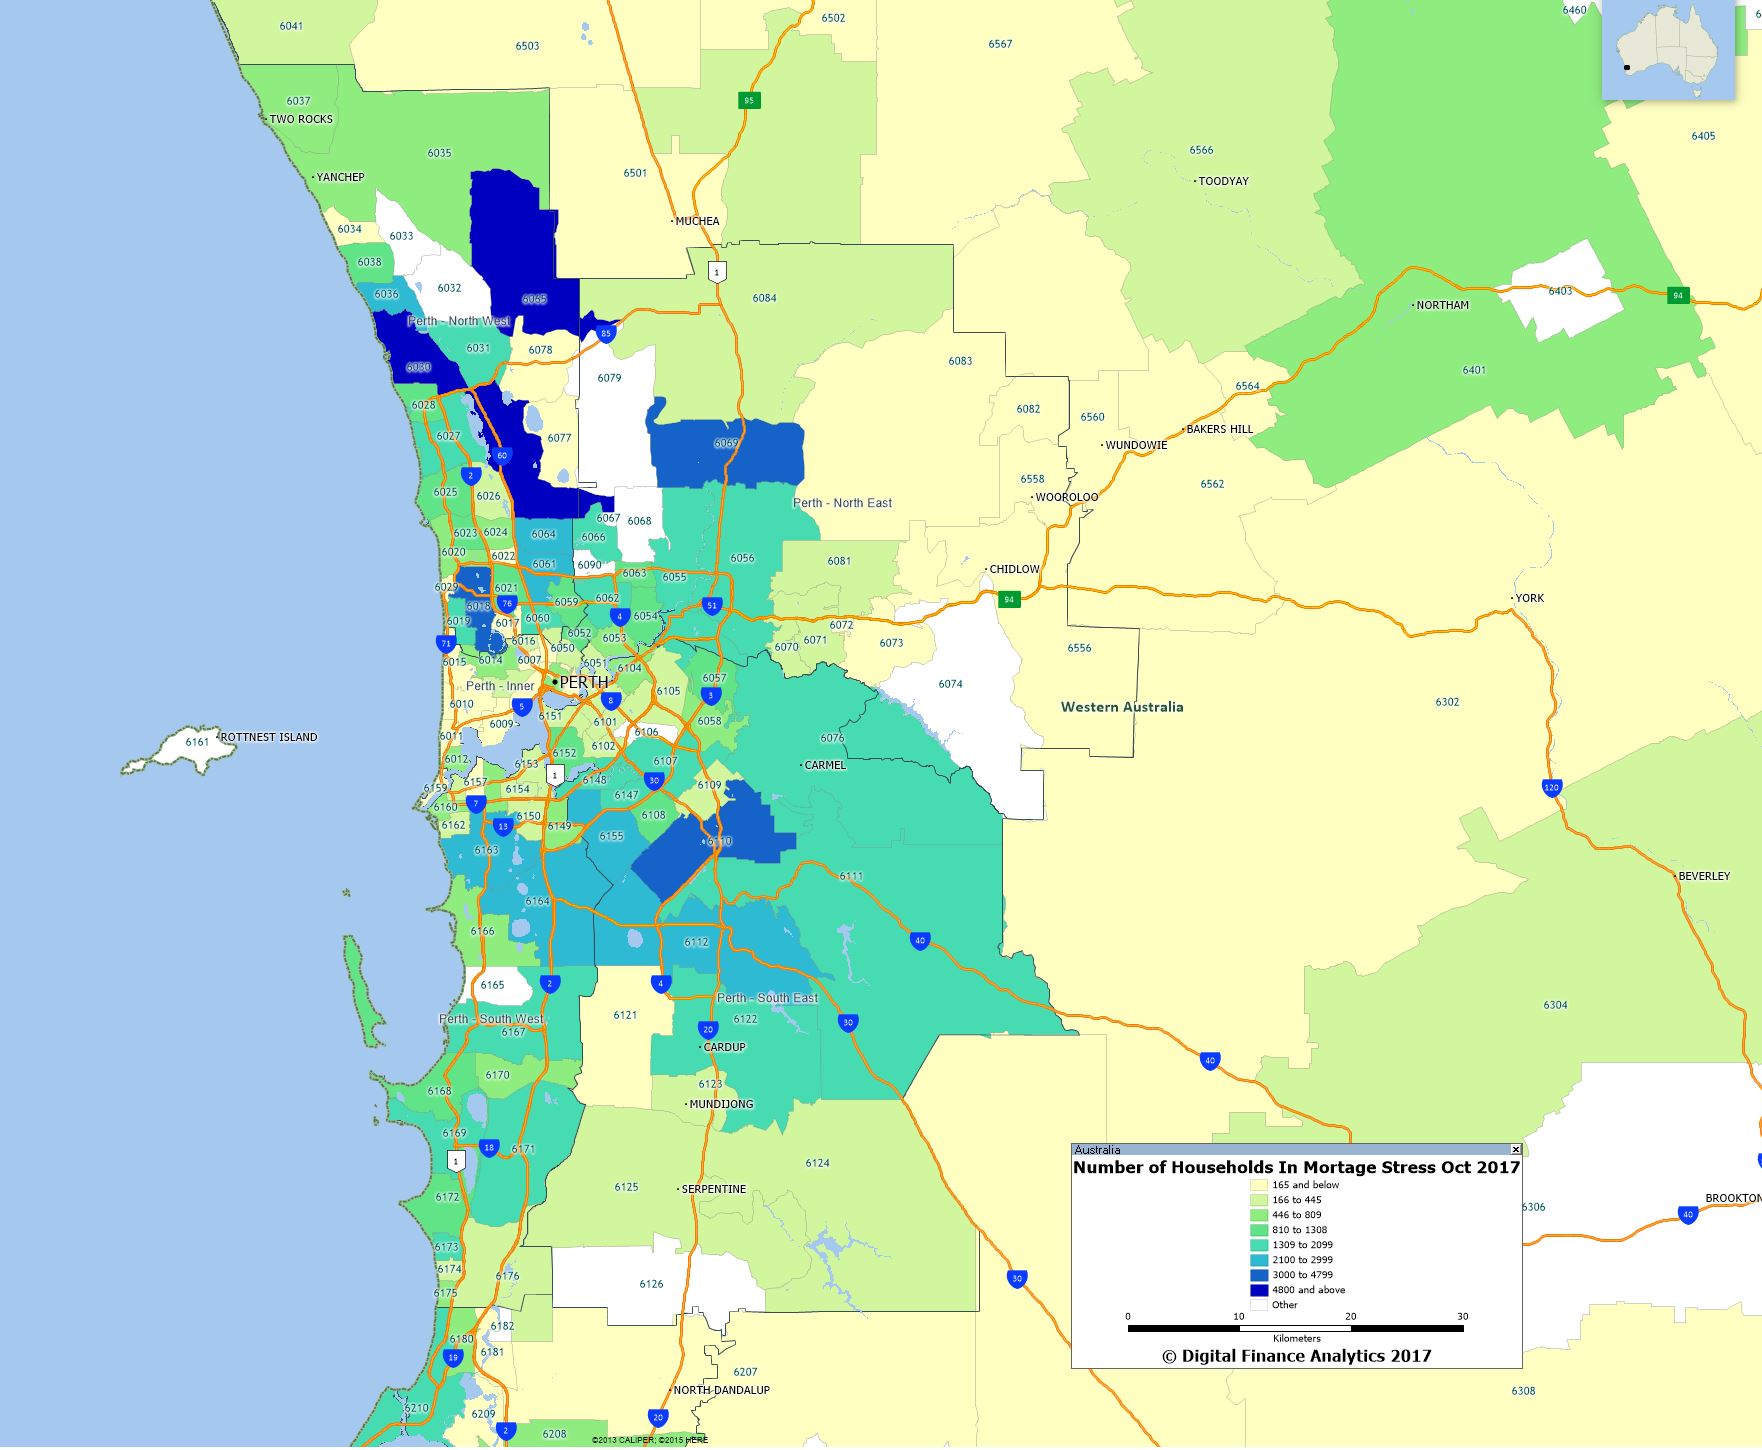
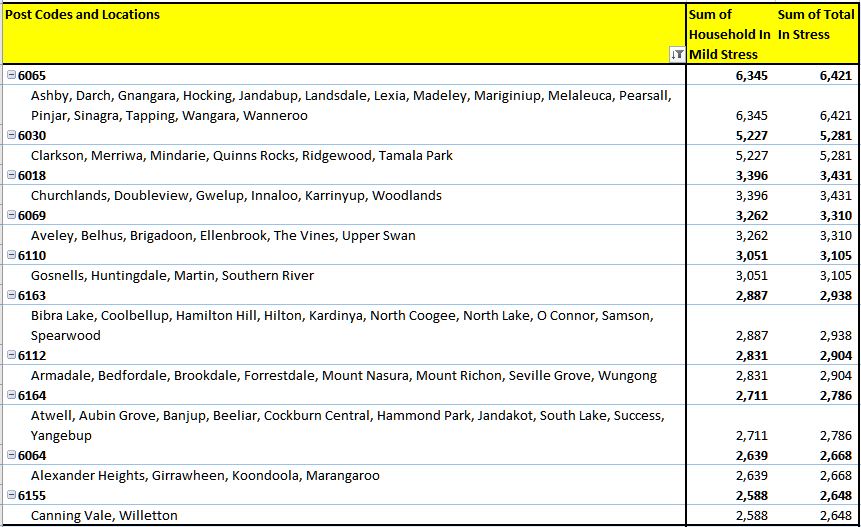
Following our October 2017 Mortgage Stress update, here is a map of the count of households in mortgage stress in Greater Perth, using our Core Market Model.
 Here is a list of the top 10 most stressed post codes in the WA, by the number of households in stress.
 We will post similar maps and lists across the other states shortly.
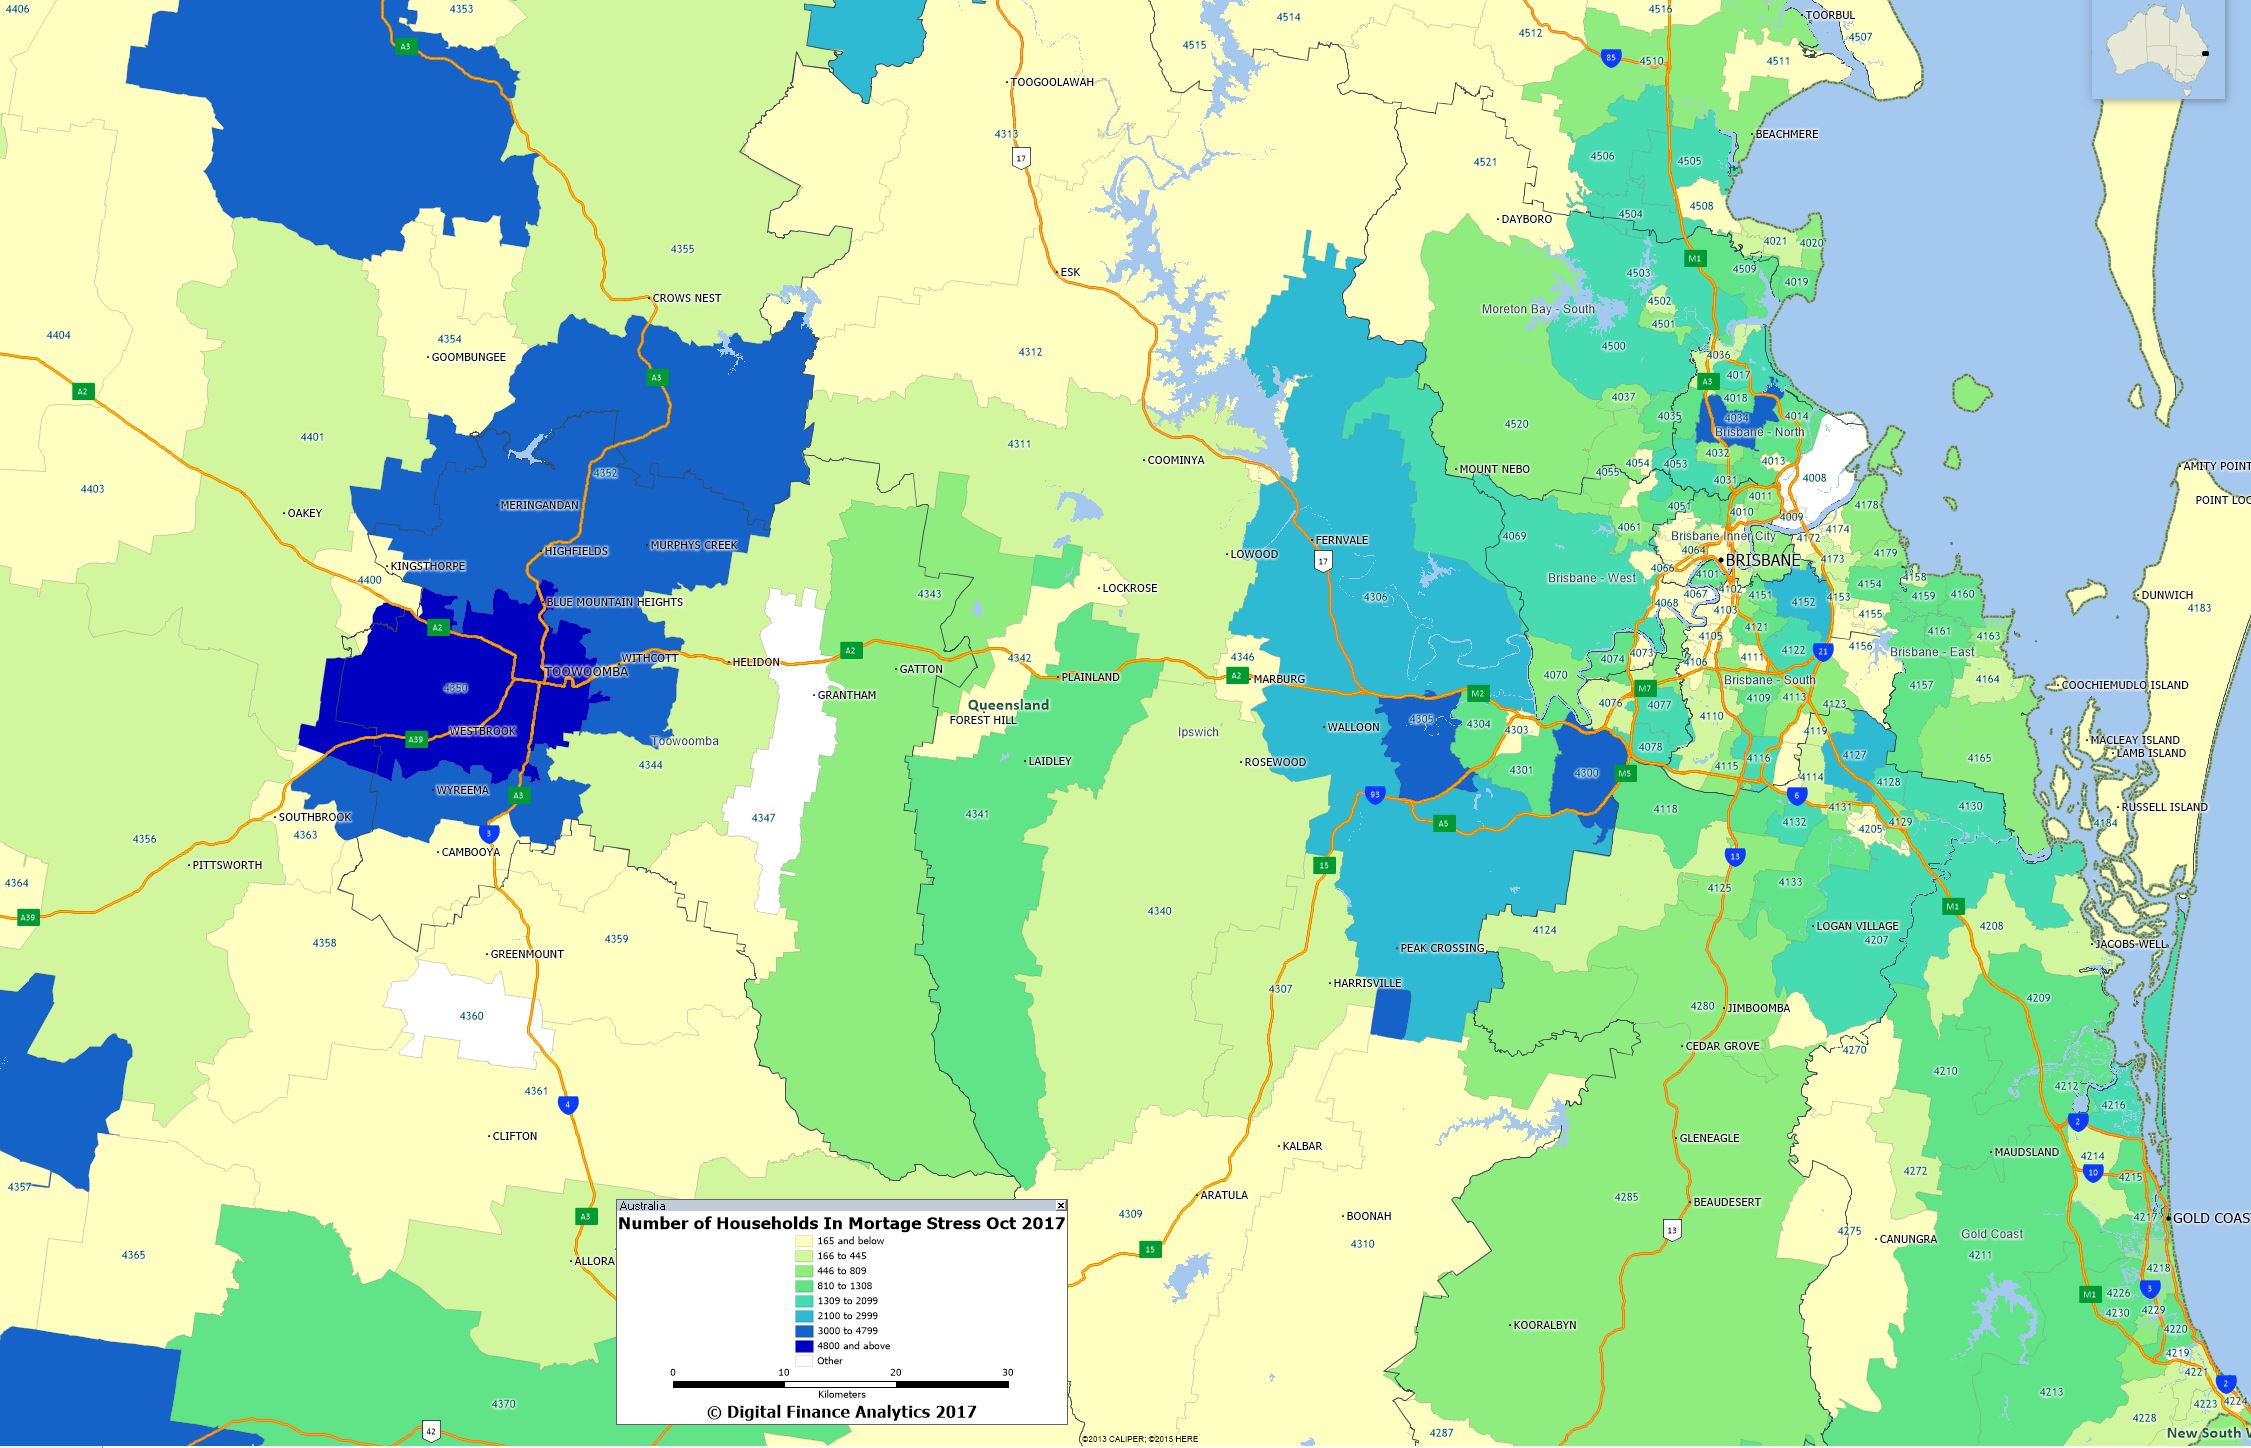
Following our October 2017 Mortgage Stress update, here is a map of the count of households in mortgage stress in Greater Brisbane, using our Core Market Model.
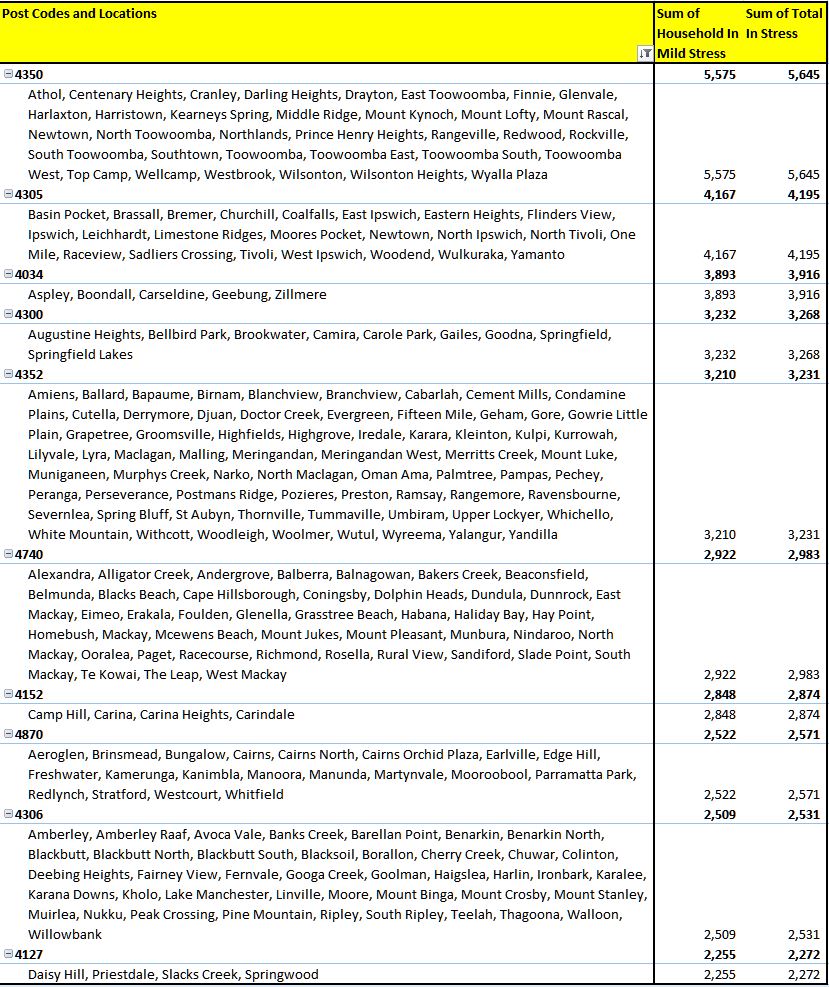
 Here is a list of the top 10 most stressed post codes in Queensland, by the number of households in stress.
 We will post similar maps and lists across the other states shortly.
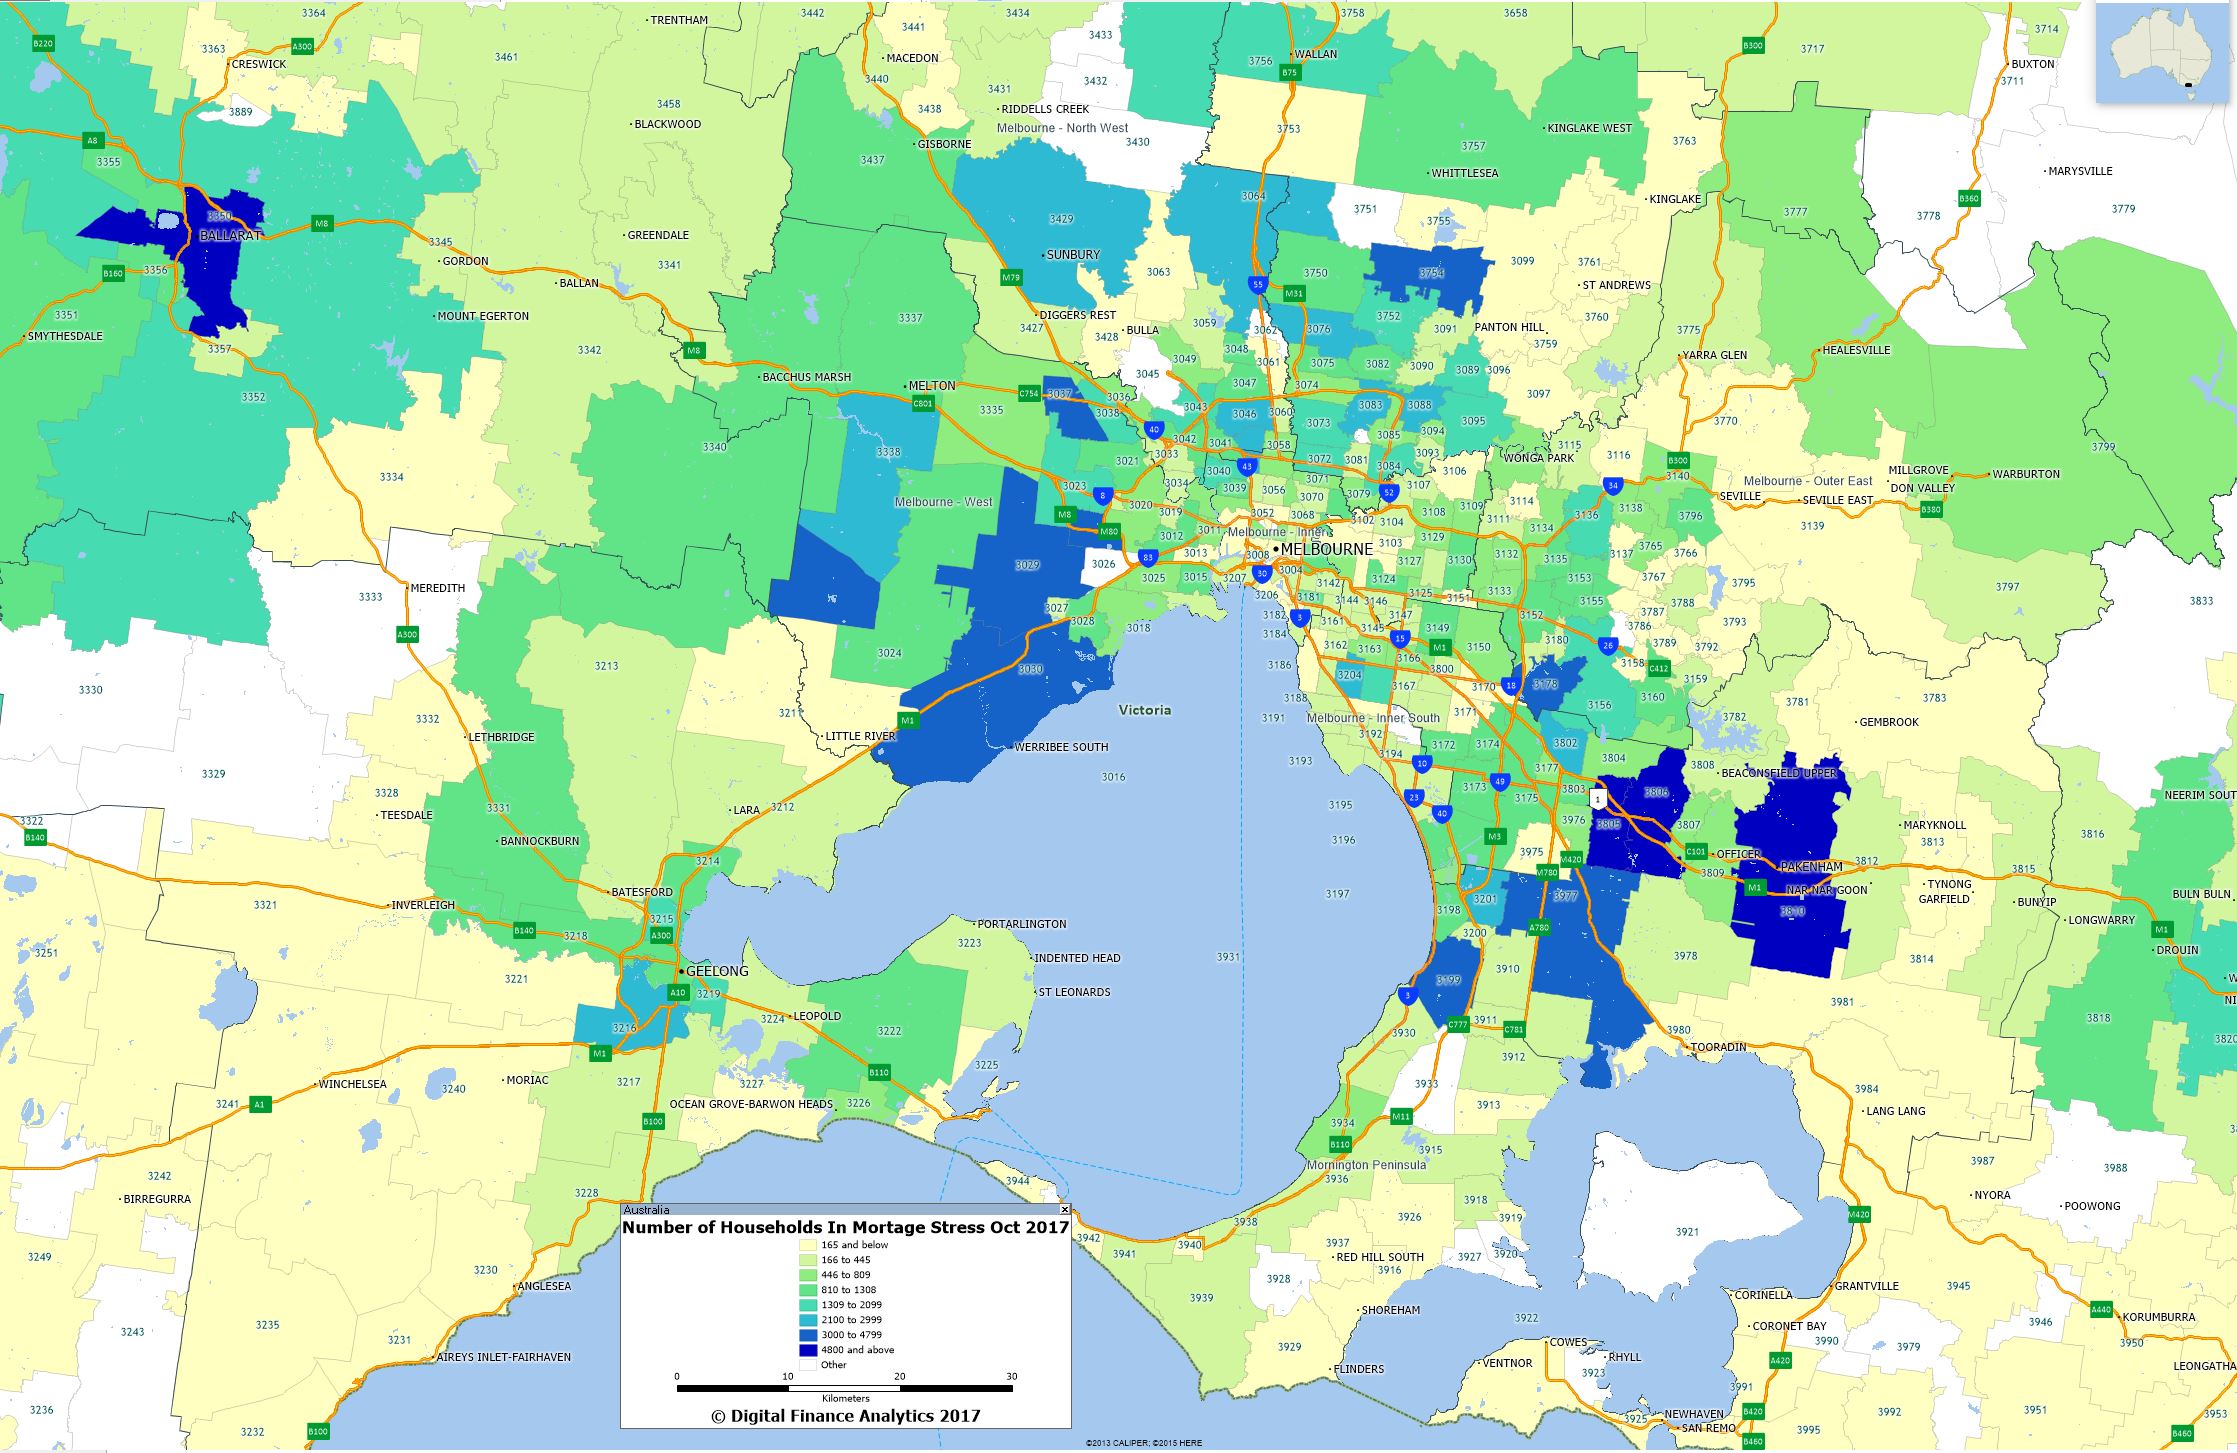
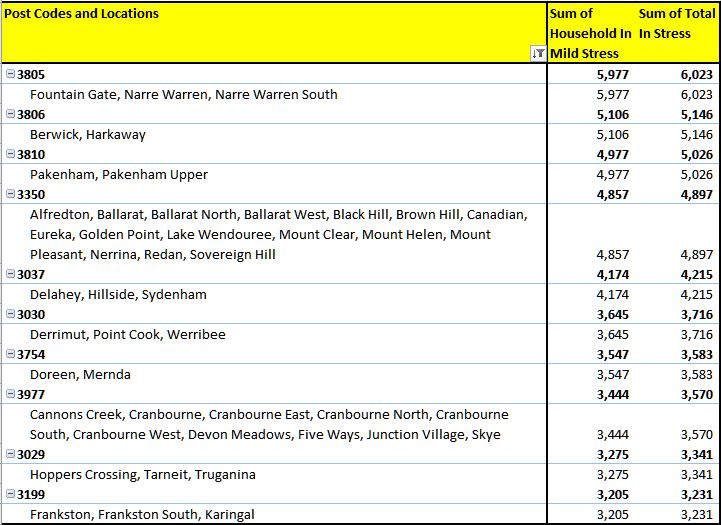
Following our October 2017 Mortgage Stress update, here is a map of the count of households in mortgage stress in Greater Melbourne, using our Core Market Model.
 Here is a list of the top 10 most stressed post codes in the region, by the number of households in stress.
 We will post similar maps and lists across the other states shortly.