The Commonwealth bank has released their 1H18 results today. Overall a mixed bag, but the contribution from home loan repricing was significant, as were the various adjustments relating to AUSTRAC and other reviews. The impact of the reduction in ATM fees, the bank levy and changes to interchange fees all hit home. Institutional Banking is under some pressure, so they rely on the retail bank to support the overall result. This is a essay in complexity!
On a ‘continuing operations’ basis, the Group’s statutory net profit after tax (NPAT) for the half year ended 31 December 2017 was $4,895 million, which represents a 1 percent increase on the prior comparative period. This is below expectations.
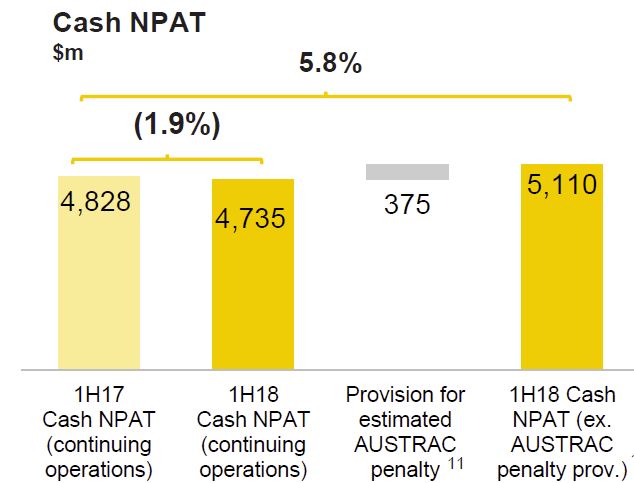
Cash NPAT was $4,735 million, a decrease of 2 percent. Return on equity (cash basis) was 14.5 percent. Discontinued operations include the Group’s life insurance businesses in Australia and New Zealand.
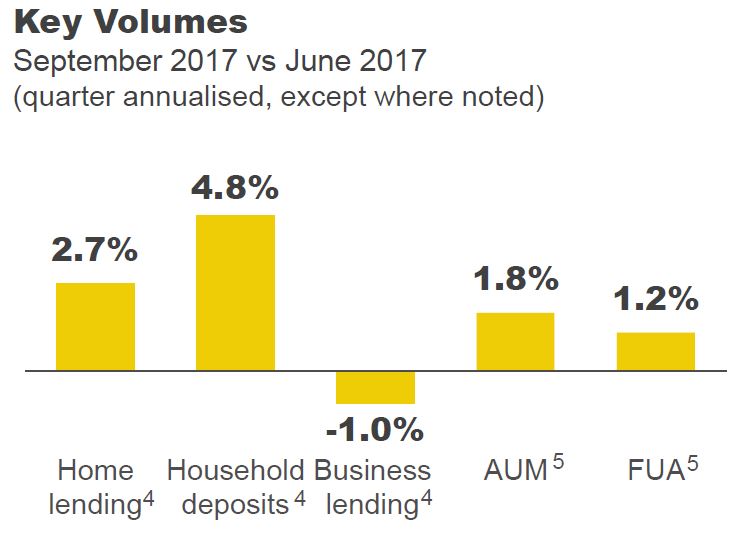
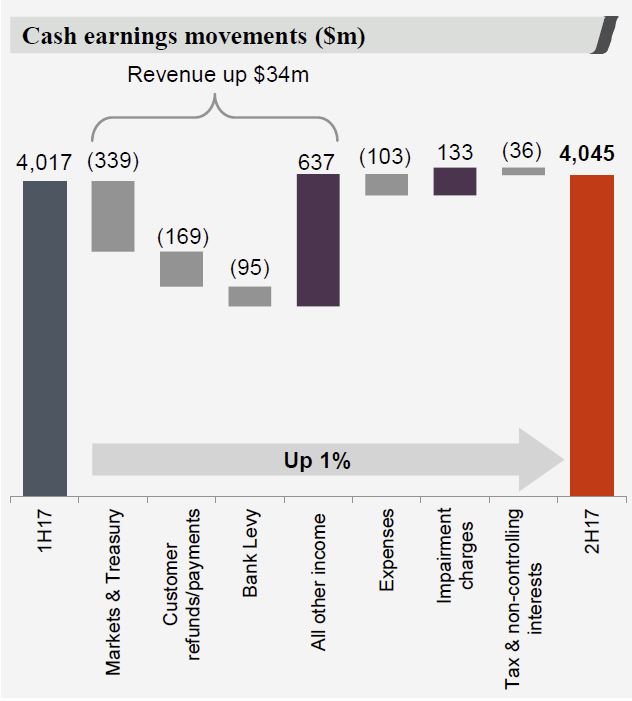
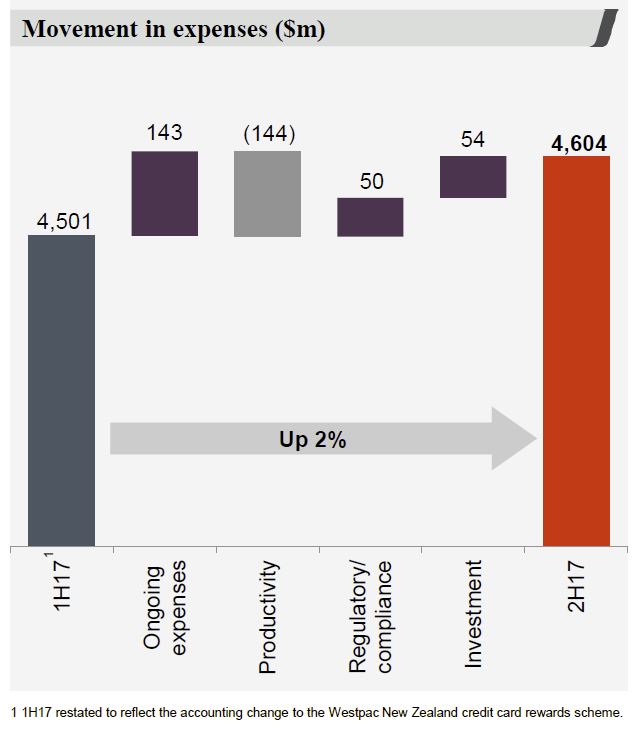
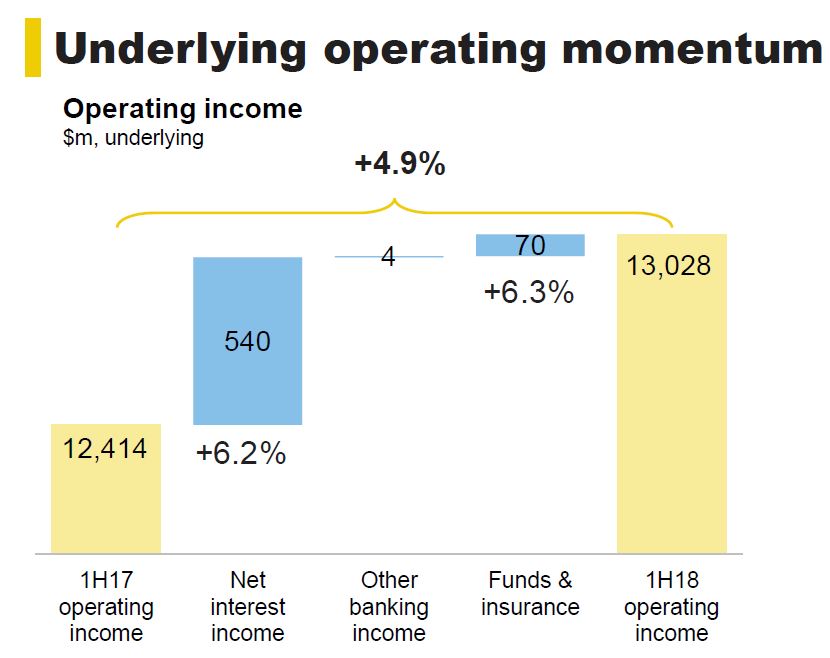
 Underlying operating income increased 4.9%, due mainly to higher net interest income which was up 6.2%. Lending volumes were up 3.5% . Other banking income was flat. Higher structured asset finance income and lending fees were offset by lower trading income in the institutional business reflecting reduced market volatility and by lower interchange rates and ATM fees in the retail bank.. Strong investment markets drove funds management income. This was partly offset by lower general insurance income which was impacted by higher claims due to weather events. Underlying operating expenses increased 4.7% to $5,318m, driven by a $200m expense provision for expected regulatory, compliance and remediation program costs.
 The underlying cost-to-income ratio reduced a further 10 basis points to 40.8%.
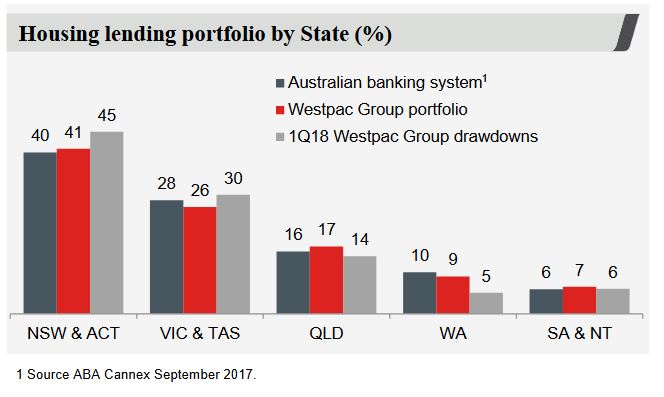
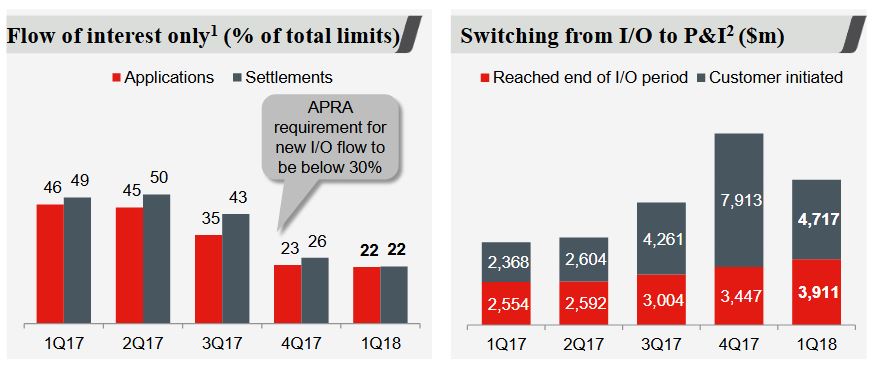
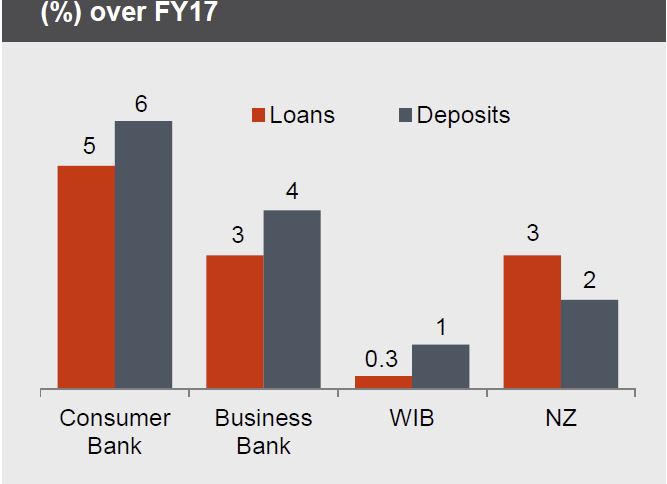
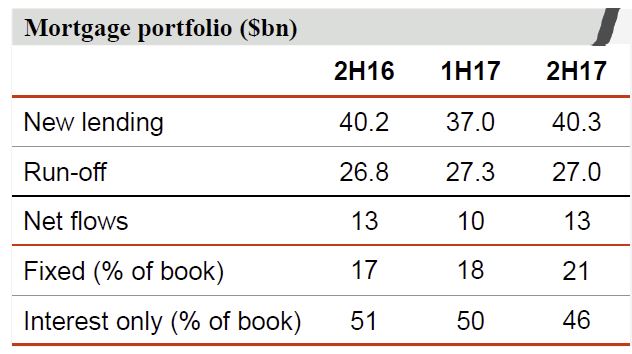
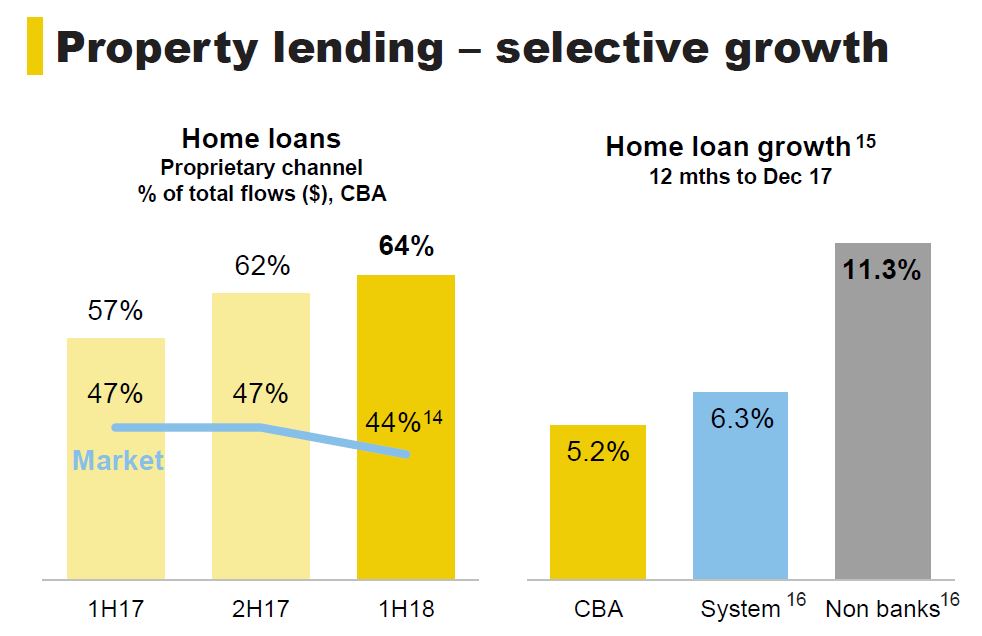
CBA has been selective in its home loan growth, with more new loans via proprietary channels, and lower volumes of investor loans than the market.
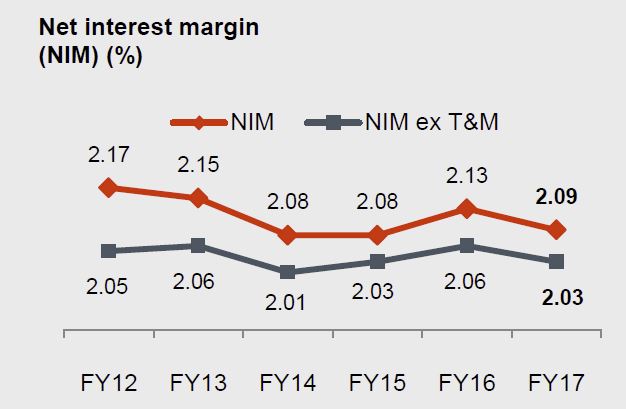
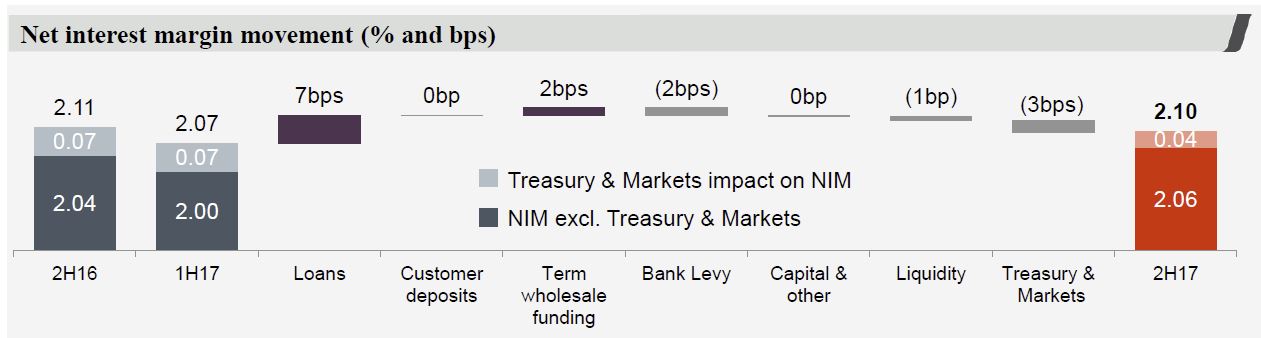
 There was a 6 basis point uplift in net interest margin to 2.16% (and a lift of more than 10 basis points in Australian Retail Banking, thanks to the mortgage book repricing).
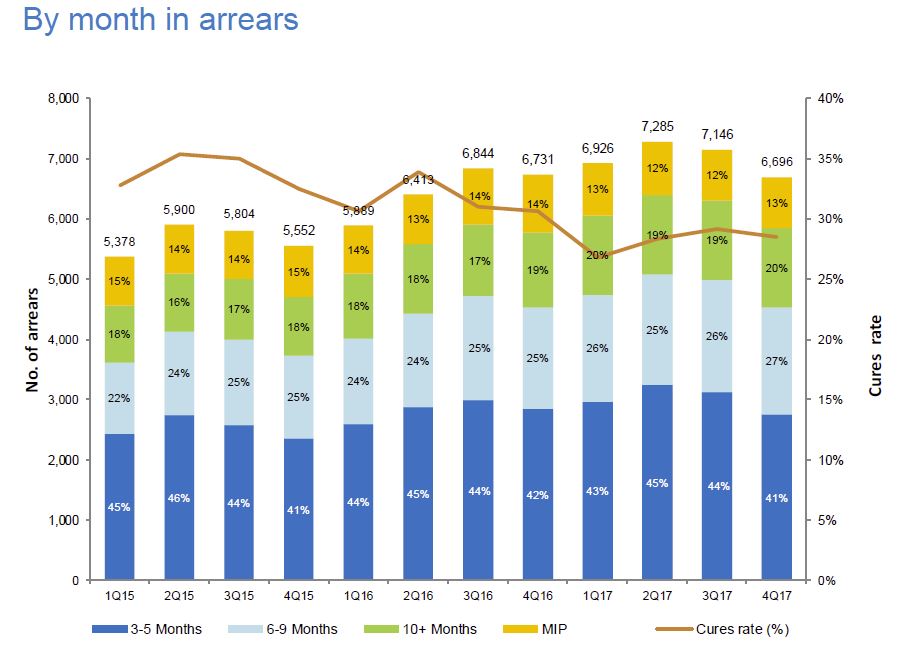
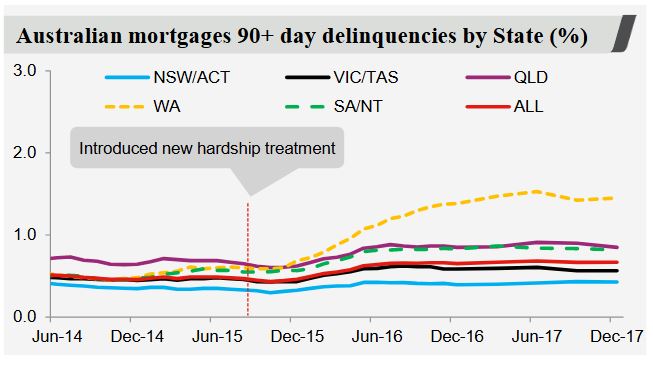
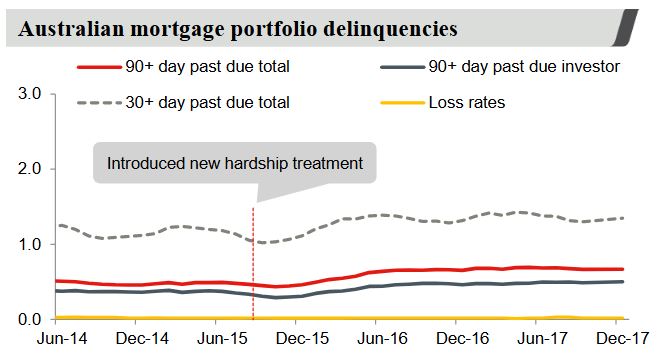
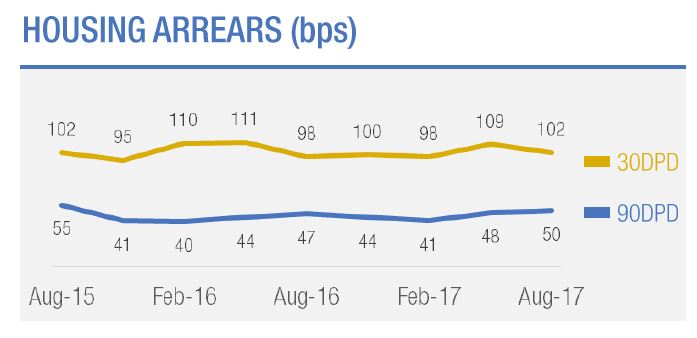
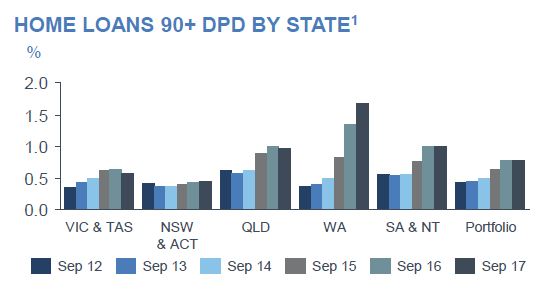
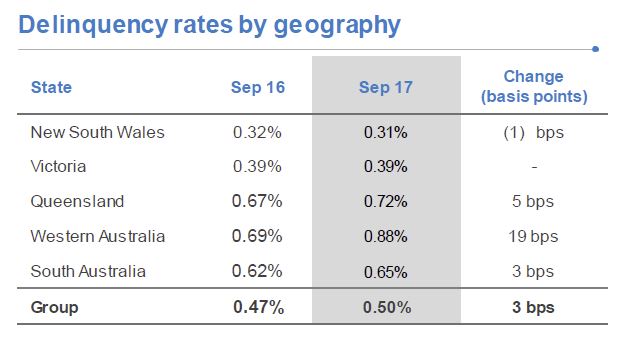
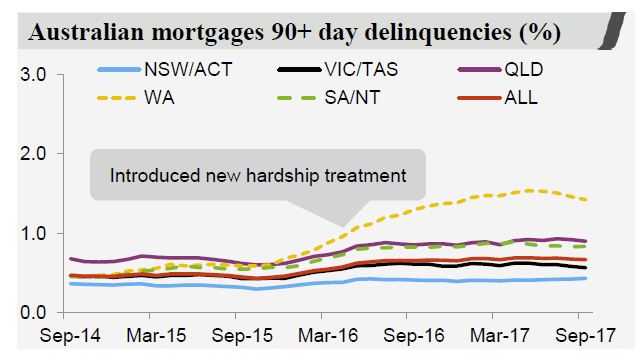
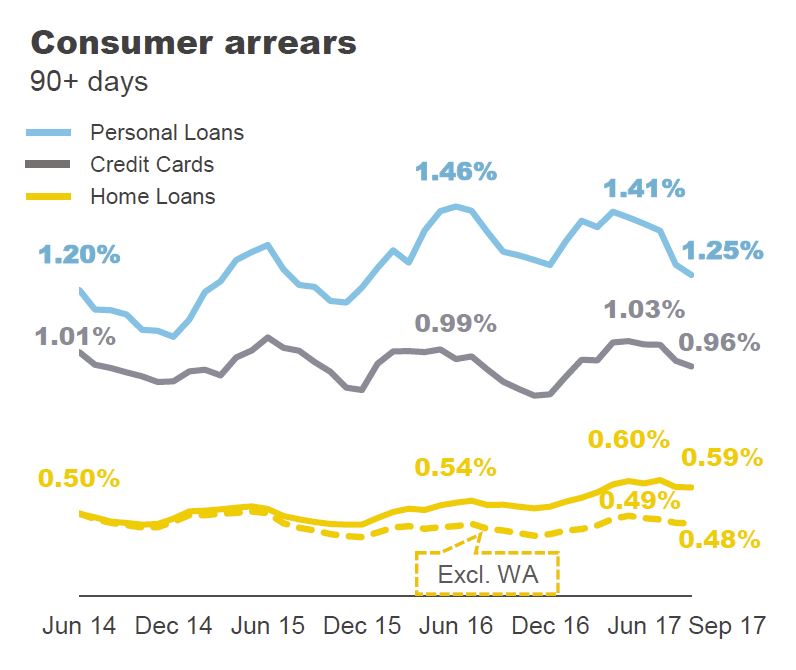
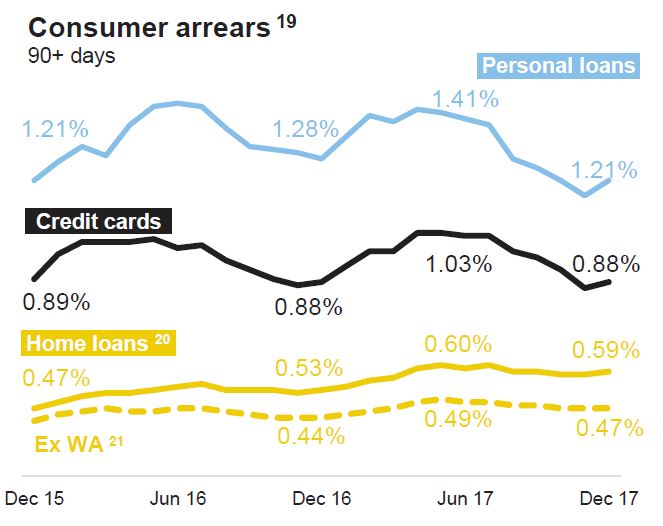
Consumer arrears look contained, though WA home loans still above the average.
 The Board determined an interim dividend of $2.00 per share, a 1 cent increase on the 2017 interim dividend.
 The interim dividend, which will be fully franked, will be paid on 28 March 2018 with the ex-dividend date being 14 February 2018.
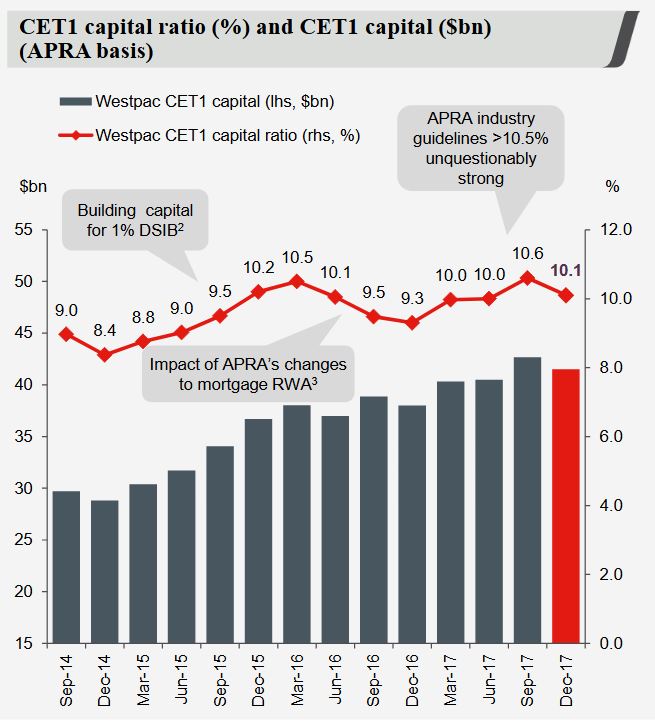
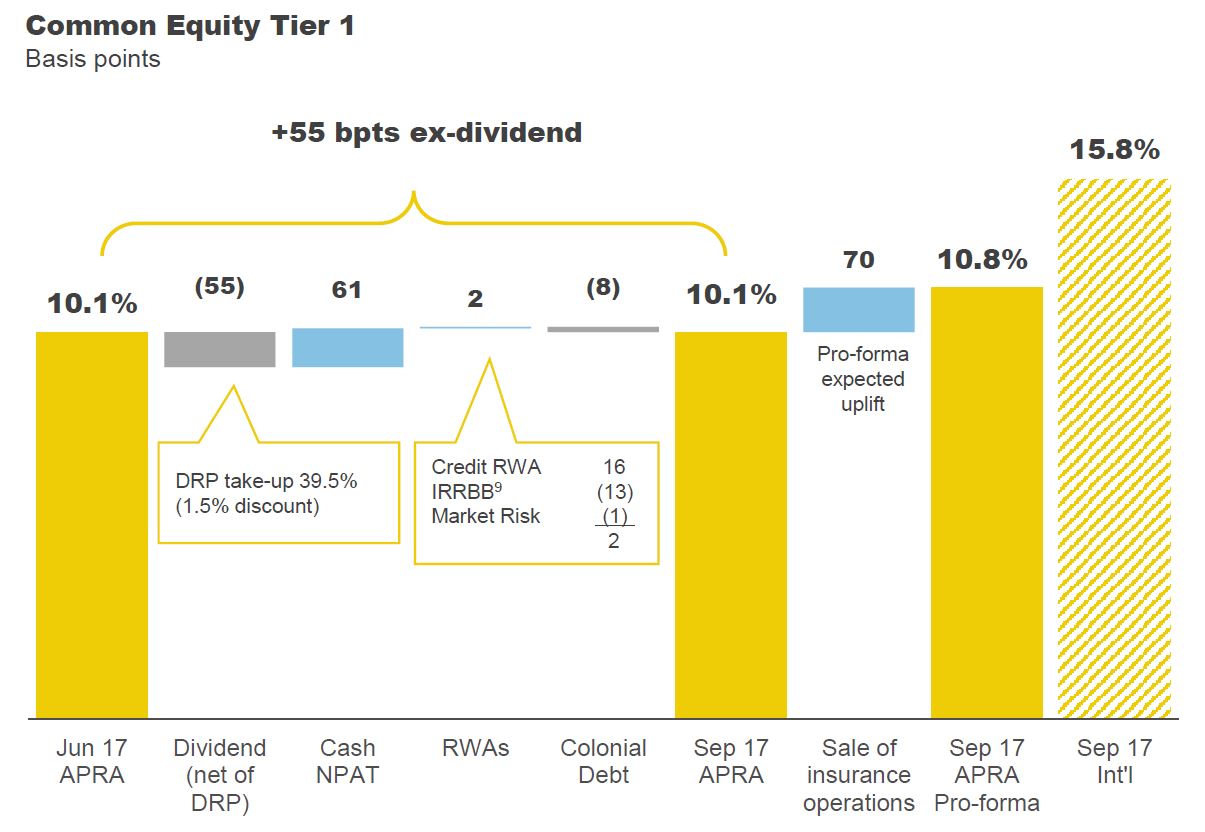
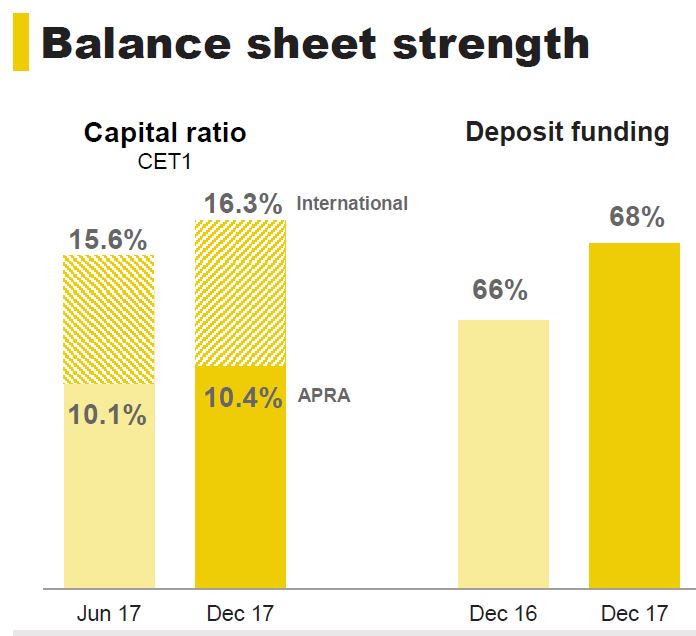
The CET1 ratio is 10.4%, lower than some expected, thanks to provisions, and CBA also flagged that by adopting the AASB9 standard CET1 will fall by around 25 basis points.
 Some interesting commentary on the outlook:
Global growth trends are positive overall, as are Australia’s GDP outlook and employment trends. However, we remain wary of the risks of market volatility, particularly as expansionist monetary policy unwinds and interest rates rise. Similarly, low wage growth undermines families’ sense of confidence and wellbeing. As we have been for many years, we remain very much aware of the inevitability of intensified competition in the financial services sector.
But the results are quite a bit more complex given a number of one off adjustments.
CBA’s net profit after tax is disclosed on both a statutory and cash basis. A number of items have been included “above the line”.
- The Group has provided for a civil penalty in the amount of $375 million (not deductible for tax) re AUSTRAC.
- A $200 million expense provision was taken for expected costs relating to currently known regulatory, compliance and remediation program costs, including the Financial Services Royal Commission.
- the sale of 100% of its life insurance businesses in Australia
(“CommInsure Life”) and New Zealand (“Sovereign”) to AIA Group Limited (“AIA”) for $3.8 billion.
They also made adjustments to underlying performance.
- 1H17 has been adjusted to exclude a $397 million gain on sale of the Group’s remaining investment in Visa Inc. and a $393 million one-off expense for acceleration of amortisation on certain software assets.
- the impact of consolidation and equity accounted profits of AHL Holdings Pty Ltd (trading as Aussie Home Loans) has been excluded
- 1H18 is adjusted to exclude an expense provision which the Group believes to be a reliable estimate of the level of penalty that a Court may impose in the AUSTRAC proceedings.
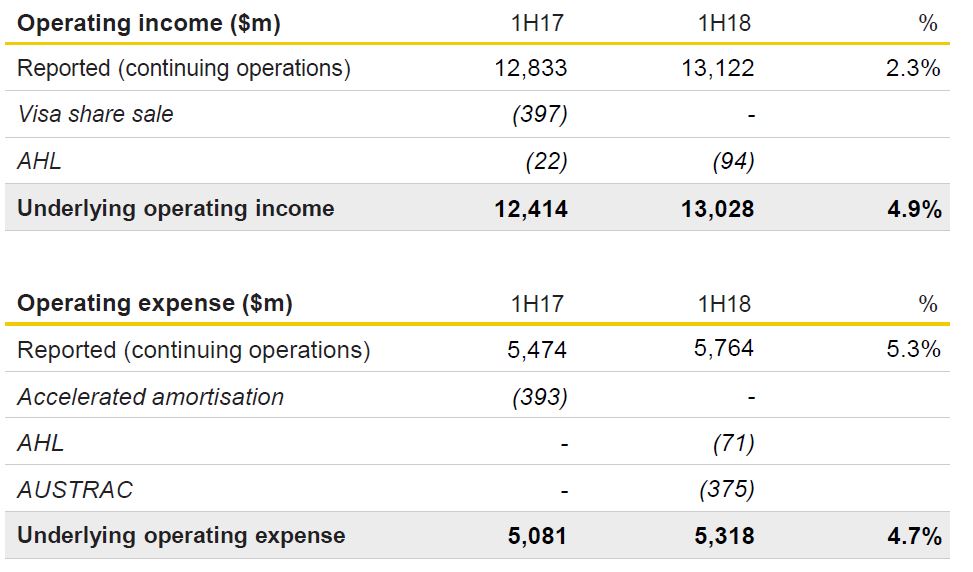 On this basis, the underlying cost-to-income ratio is 40.8% compared to the reported cash NPAT (continuing operations, including AUSTRAC penalty provision) cost-to-income ratio of 43.9%.
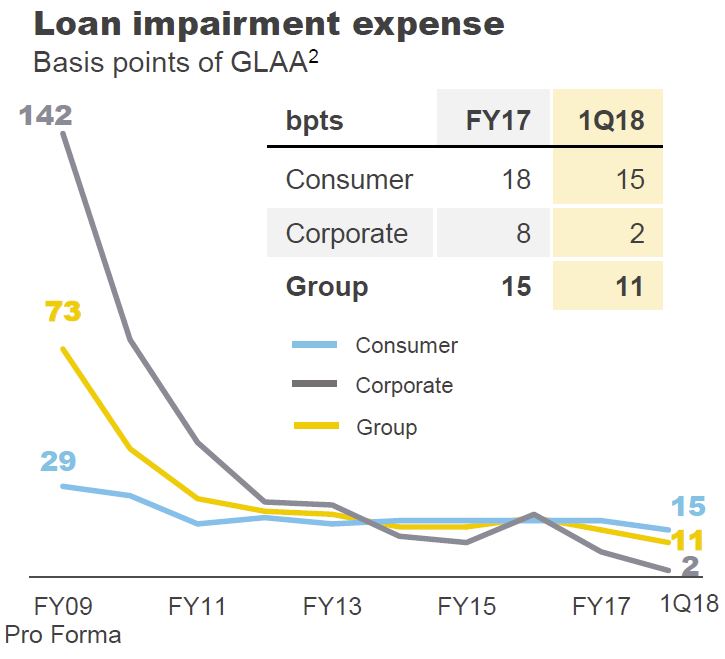
Looking at the divisional performance, Retail Banking Services has more than 10 million personal and small business customers, a network of ~1,000 branches and more than 3,000 ATMs. More than 6 million customers now use digital channels with a quarter of new accounts opened online, and more than 50% of transactions by value completed digitally. Retail Banking Services cash net profit after tax for the half year ended 31 December 2017 was $2,653 million, an increase of 8% on the prior comparative period. Since 2006, Retail Banking Services have improved customer satisfaction by more than 25%, and has been number one in Roy Morgan Retail MFI customer satisfaction for 45 out of the past 54 months. Net interest income was $4,949 million, an increase of 8% on the prior comparative period. This reflected a higher net interest margin, solid balance growth in home lending and strong growth in transaction deposits. Net interest margin increased 11 basis points, reflecting: Higher home lending margin from repricing of interest only and investor loans, and lower cash basis risk, partly offset by unfavourable portfolio mix, with a shift to fixed home loans, and switching from interest only to principal and interest home loans; and higher deposit margin resulting from repricing and favourable portfolio mix, partly offset by lower cash basis risk; partly offset by the impact of the major bank levy. Other banking income was $955 million, a decrease of 5% on the prior comparative period, thanks to lower interchange rates and lower deposit fee income and removal of ATM withdrawal fees. FTE were 11,555, a decrease of 2% on the prior comparative period, yet operating expenses were $1,775 million, an increase of 2% on the prior comparative period. The operating expense to total banking income ratio was 30.1%, an improvement of 90 basis points on the prior comparative period. Net interest income increased 7% on the prior half, reflecting higher net interest margin, balance growth in home lending and deposits, and three additional calendar days than the prior half. Net interest margin increased 10 basis points, reflecting: higher home lending margin with repricing of interest only and investor loans to manage regulatory limits, and lower cash basis risk; partly offset by unfavourable portfolio mix, with a shift to fixed home loans, and switching from interest only to principal and interest home loans; lower deposit margin resulting from lower cash basis risk, partly offset by repricing; and the impact of the major bank levy. Loan impairment expense was $356 million, an increase of 1% on the prior comparative period. The result was mainly driven by increased home loan and personal loan collective provisions, which include the impact of slightly higher home loan arrears, predominately in Western Australia. Home loan growth up 5% driven by strong growth in the proprietary channel leading to an increase in the proprietary flows mix from 57% to 64%; Total deposit growth of 4%, driven by strong growth in Transaction accounts; and Consumer finance balance decrease of 1%, broadly in line with system.
Business and Private Banking cash net profit after tax for the half year ended 31 December 2017 was $960 million, an increase of 9% on the prior comparative period. Net interest income was $1,694 million, an increase of 5% on the prior comparative period. This was driven by strong deposit balances growth, subdued growth in lending balances and an increase in net interest margin. Net interest margin increased six basis points. Other banking income was $517 million, an increase of 6%. Operating expenses were $789 million, flat on the prior comparative period. FTE were 3,557 up 1% primarily due to an increase in frontline bankers and project resources supporting the Bankwest east coast business banking transition. The operating expense to total banking income ratio was 35.7%, an improvement of 180 basis points on the prior comparative period. Loan impairment expense was $49 million, a decrease of 11% on the prior comparative period. Deposit growth of 6%, driven by strong demand for transaction deposits; home loan growth of 2%, driven by growth in owner occupied loans; and business lending growth of 1% driven by growth in target industries partly offset by decline in residential property development. Loan impairment expense was $49 million, an increase of $42 million on the prior half reflecting higher collective provisions, partly offset by lower individual provisions.
Institutional Banking and Markets cash net profit after tax for the half year ended 31 December 2017 was $591 million, a decrease of 13% on the prior comparative period. Net interest income was $737 million, a decrease of 4% on the prior comparative period. Other banking income was $679 million, a decrease of 6% on the prior comparative period. Operating expenses were $542 million, a decrease of 2% on the prior comparative period. The decrease was driven by the ongoing realisation of productivity benefits, partly offset by higher project, risk and compliance costs. The operating expense to total banking income ratio was 38.3%, an increase of 130 basis points on the prior comparative period. FTE were 1,510, an increase of 4% primarily due to growth in project related FTE and increased risk and compliance resourcing. Loan impairment expense was $105 million, an increase of $61 million on the prior comparative period. Asset quality of the portfolio has remained stable with the percentage of the book rated as investment grade increasing slightly by 40 basis points to 86.0%. Net interest income decreased 2% on the prior half, driven by lower margins, partly offset by average deposit balance growth. Net interest margin decreased seven basis points. Other banking income increased 8% on the prior half. Loan impairment expense increased $85 million on the prior half reflecting higher individual and collective provisions, partly offset by higher write-backs.
Wealth Management cash net profit after tax for the half year ended 31 December 2017 was $375 million, a 51% increase on the prior comparative period. Excluding the contribution from the CommInsure Life Business (discontinued operations), cash net profit after tax was $281 million, a 33% increase on the prior comparative period. The result was driven by strong growth in funds management income and lower operating expenses partly offset by lower insurance income. Funds management income was $987 million, an increase of 10% on the prior comparative period. Average Assets Under Management (AUM) increased 9% to $220 billion reflecting higher investment markets partly offset by higher net outflows in the emerging market equities and fixed income businesses. AUM margins declined reflecting investment mix shift to lower margin products. General insurance income was $82 million, a decrease of 24% on the prior comparative period due to higher weather event claims, partly offset by growth in premiums driven by pricing initiatives. Operating expenses were $707 million, a decrease of 3% on the prior comparative period. This was driven by ongoing realisation of productivity benefits partly offset by continued investment in business capabilities. FTEs were 3,534, a decrease of 11% on the prior comparative period. The operating expenses to total operating income ratio was 66.1%, an improvement of 610 basis points on the prior comparative period.
New Zealand cash net profit after tax for the half year ended 31 December 2017 was NZD589 million, an increase of 15% on the prior comparative period, driven by strong volume growth, improved lending margins, lower loan impairment expense and 20% increase in Sovereign’s profit. ASB cash net profit after tax for the half year ended 31 December 2017 was NZD575 million, an increase of 15% on the prior comparative period. The result was driven by operating income growth and a lower loan impairment expense, partly offset by higher operating expenses. Net interest income was NZD984 million, an increase of 8% on the prior comparative period, driven by strong volume growth and improved net interest margin. Net interest margin increased, reflecting an increase in lending margins, partly offset by an unfavourable retail deposit mix shift to lower margin investment deposit accounts. Other banking income was NZD212 million, an increase of 5% on the prior comparative period, primarily driven by higher card income and insurance commissions, partly offset by lower service fees as customers leverage digital channels. Funds management income was NZD55 million, an increase of 17% on the prior comparative period, due to strong net flows and market performance. Operating expenses were NZD427 million, an increase of 3% on the prior comparative period. This increase was driven by higher staff costs, continued investment in technology capabilities and higher regulatory compliance costs, partly offset by lower property costs and lower depreciation. FTE were 4,826, up 3% primarily due to an increase in frontline and compliance staff, partly offset by productivity initiatives. The operating expense to total operating income ratio for ASB was 34.1%, an improvement of 160 basis points, reflecting improved operating leverage supported by cost control and a continued focus on productivity.
Loan impairment expense was NZD26 million, a decrease of 47% on the prior comparative period, primarily due to lower provisions in the dairy portfolio. Home loan and consumer finance arrears rates continue to remain low at 12 basis points and 50 basis points respectively. This is despite a 12 basis point increase in consumer finance arrears on the prior comparative period primarily driven by the timing of write-offs. Balance Sheet growth included: home loan growth of 5%, marginally below system; strong business and rural loan growth of 8%, remaining above system, with the long-term strategic focus on this segment continuing to deliver strong results; and strong customer deposit growth of 7% in a competitive retail funding environment. Risk weighted assets increased 1%, primarily driven by lending volume growth, partly offset by improved credit quality in the business and rural portfolios.
Bankwest cash net profit after tax for the half year ended 31 December 2017 was $339 million, an increase of 17% on the prior comparative period. The result was primarily driven by strong growth in total banking income, lower loan impairment expense and flat operating expenses. Net interest income was $778 million, an increase of 6% on the prior comparative period. The result was driven by strong balance growth in home lending and deposits, and a higher net interest margin. Other banking income was $107 million, an increase of 7% on the prior comparative period, reflecting an increase in fee based package offerings, partly offset by lower business lending fees. Operating expenses were $368 million, flat on the prior comparative period, reflecting a continued focus on productivity and disciplined expense management. FTE were 2,866, up 2% on the prior comparative period as a result of increased investment in customer facing technology platforms. The operating expense to total banking income ratio was 41.6%, an improvement of 250 basis points compared to the prior comparative period. Loan impairment expense was $30 million, a decrease of 40% on the prior comparative period. This was driven by reduced home loan impairments and lower business loan collective provisions. Home loan arrears increased in line with the softening Western Australian economy. Balance sheet growth included: home loan growth of 6%, slightly lower than system reflecting the Western Australian economy lagging national growth rates; total deposit growth of 11% resulting from strong growth in Investment and Transaction deposits, reflecting a continued focus on deepening customer relationships; and core business lending growth of 6%. Risk weighted assets increased by 18% on the prior comparative period driven by regulatory changes to the home loan risk weighting. The underlying increase excluding regulatory changes was 10% driven by volume growth in business and home loans and an increase in Operational Risk.

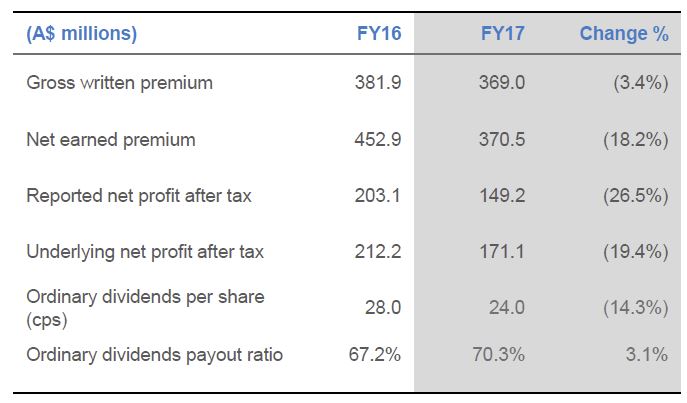
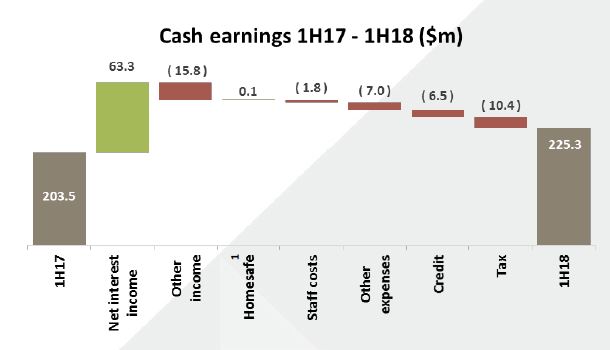 The results were supported by strong margin growth, but were impacted by reduced trading income and lower ATM and transaction fees.
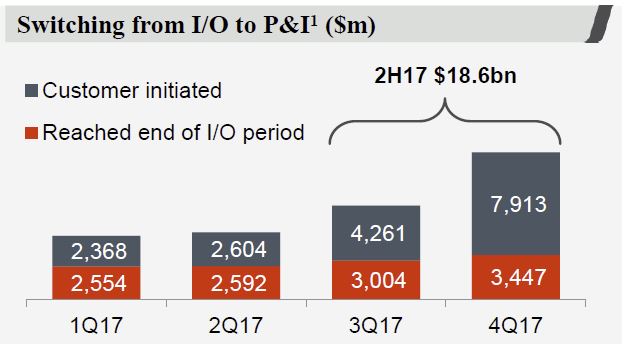
 Growth in Owner Occupied home loans was up 13% pcp, whilst total loans were up 0.7% (implying a fall in investor loan, flows down 59%). Interest only loans flows were down 41%.
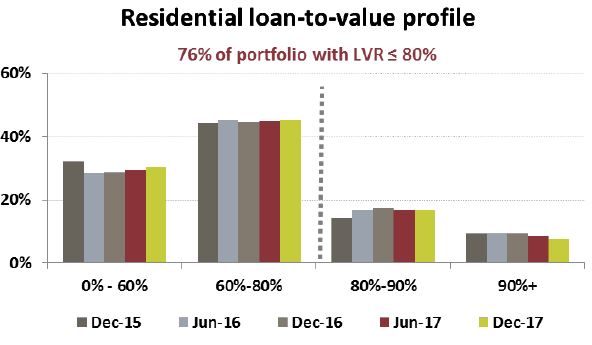 Home safe proceed to completed contracts continue to exceed pre-overlay values. The overlay assumes a 3% rise in property prices for the next 18 months, then rising back to 6%. This may be optimistic!
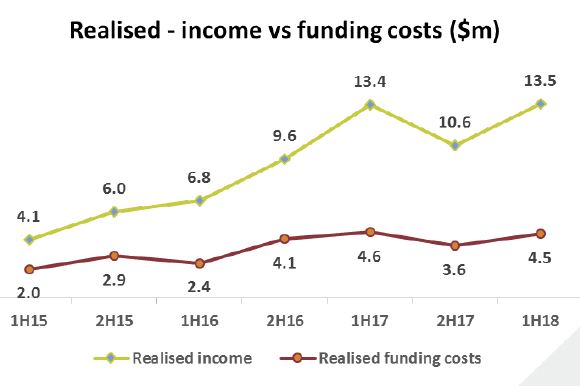 Arrears appear benign, though with a small rise on past 90-day due home loans. WA remains the most trouble state. But in value terms, past due 90 day loans were down $57.2m (10.7%).
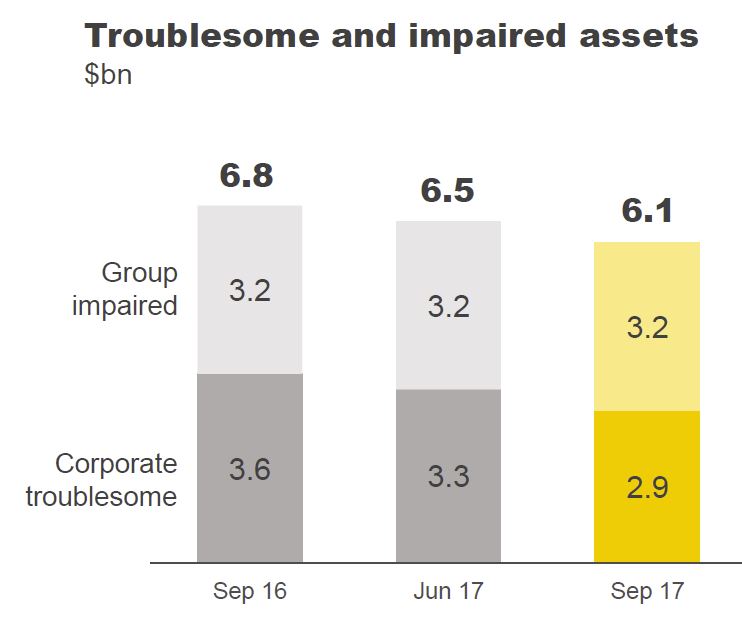
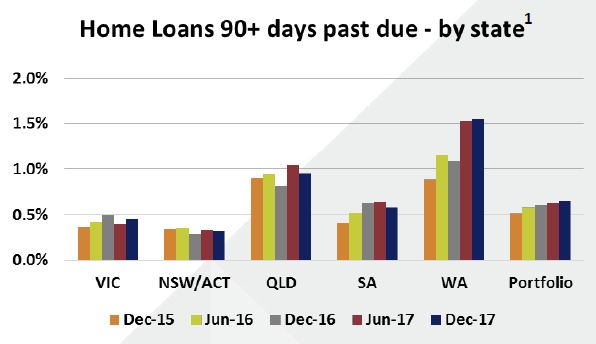 Total impaired assets were down $11.9m to $288.8m. Great Southern past due 90 days fell down $40.5m to $62.7m.
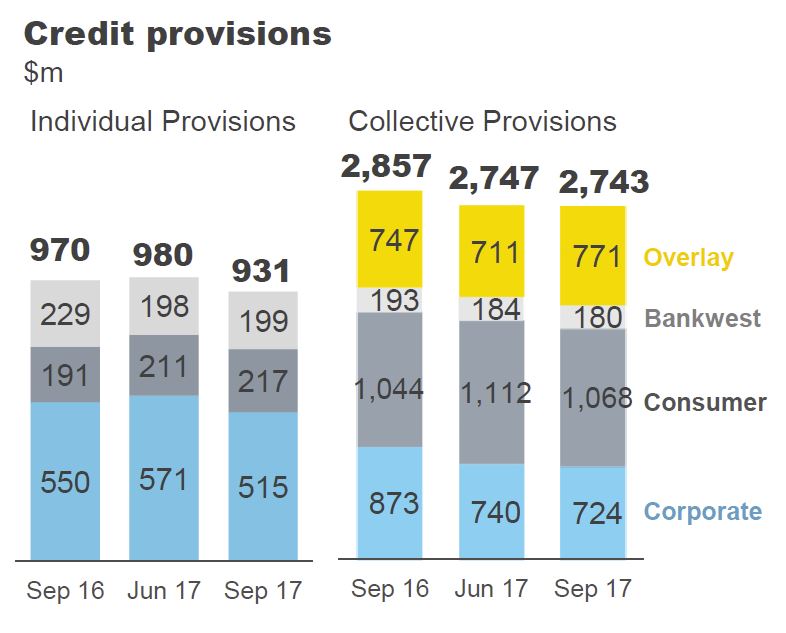
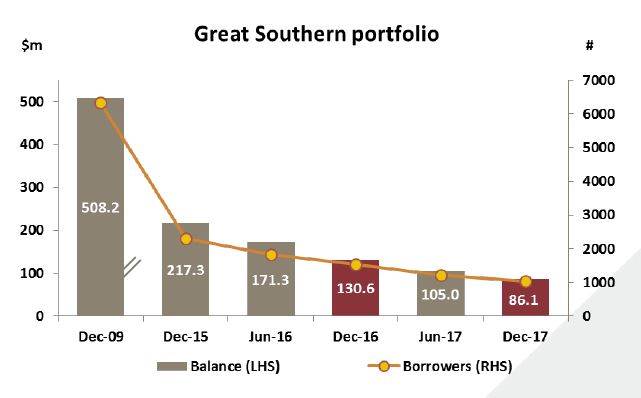 Specific provisions were $113.2 million, with business lending showing the largest move, mainly relating to commercial property lending. B&DD stood at $46 million, which is higher than expected.
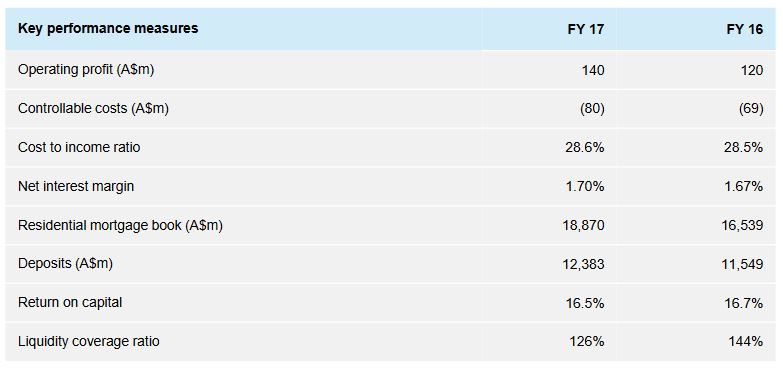
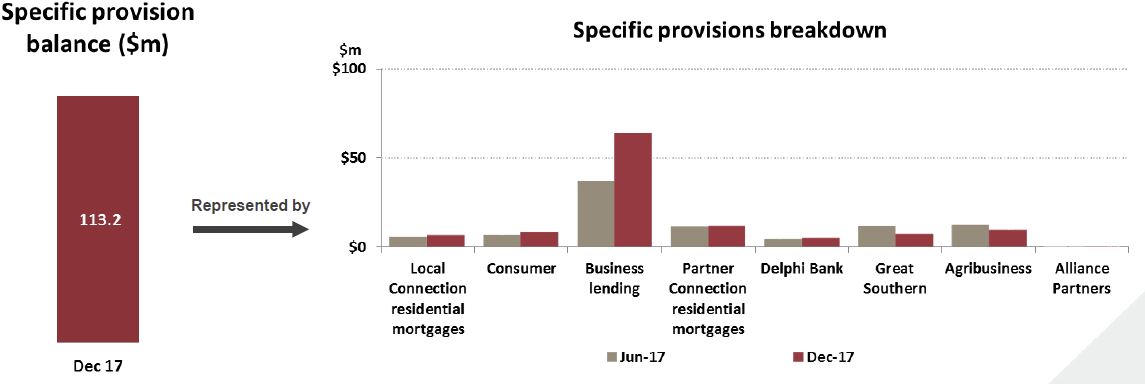 Cost to income ratio moved down 220 basis points to 54.2%. Software amortisation was up $4.5% (50%) on 1H17 and staff costs up 0.7% pcp.
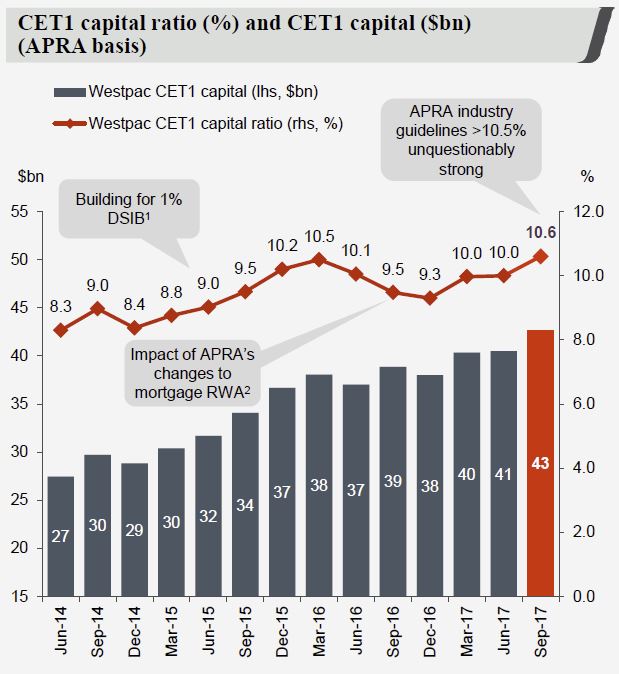
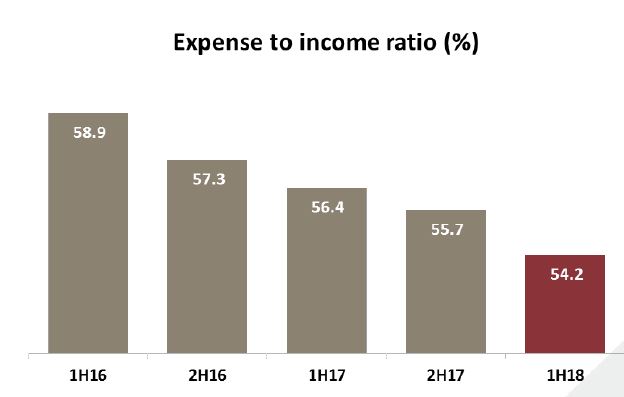 Their CET1 ratio was 8.61%, up 64 basis points and they expect to be able to meet the “unquestionably strong” benchmark.
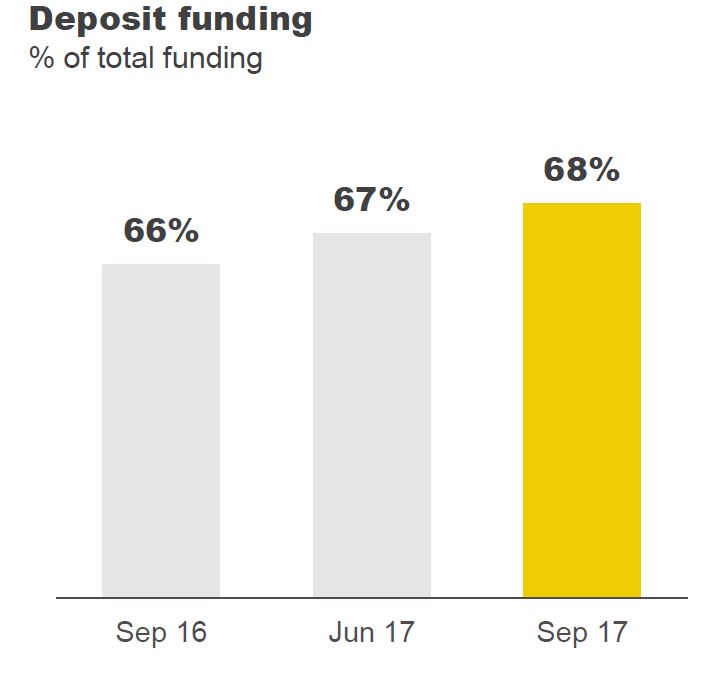
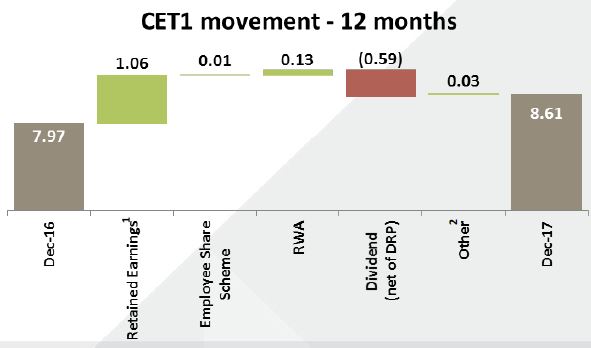 Progress toward Advanced Accreditation awaits APRA’s release of new guidelines. 79.6% of funding comes from retail customers