Today we examine how costs and risks are systematically transferred from corporations to society, thus inflating their true profit, whilst we are left to pick-up the tally. And its true across many sectors of the economy. Worse, regulators are captured thus reinforcing this inequitable trend.
Asbestos is one prime example of the capacity of corporations to make decisions that prioritise short-term profit gains while dismissing or discounting the future adverse effects on employees, customers, and the broader community.
The information contained in this show was provided by Asbestos Awareness Australia, and the full report plus full footnotes is available below.
Go to the Walk The World Universe at https://walktheworld.com.au/
Here is the full report for download or online viewing.
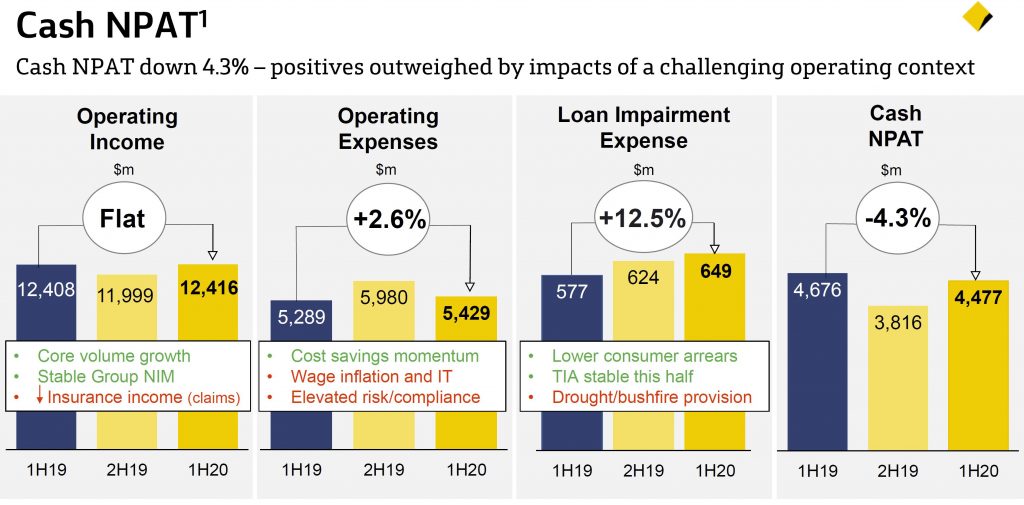
CBA released their 1H20 result today, with a statuary NPAT of $6,161 million, up 34%, but this included a one off gain from the sale of CFSGAM, so its not really meaningful.
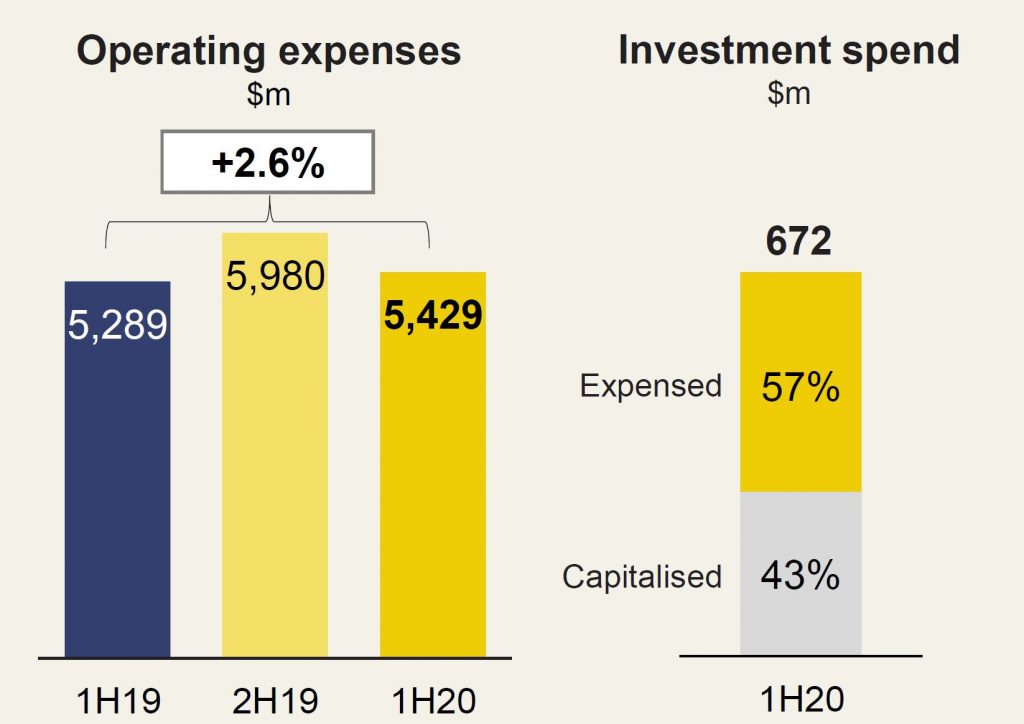
On a cash basis, the cost base remains under pressure from compliance, wage inflation and IT investment, plus rising insurance claims and provisions for drought and bushfire. But volume grew, and consumer arrears are lower. Overall one of the better managed banks in Australia.
Thus this cash result on a continuing basis is more relevant. It was down 4.3% on pcp to $4,477m, thanks to stronger revenue growth than anticipated – especially from trading income, despite higher provisions and expenses.
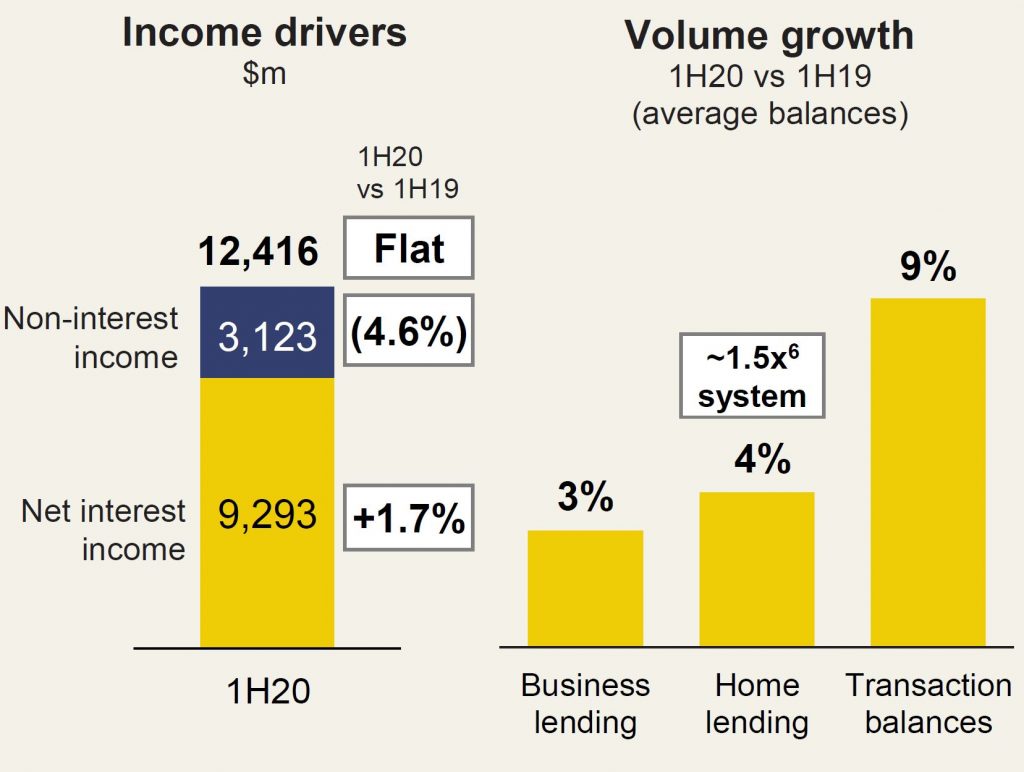
Operating income was flat at $12,416 million while net interest income was up 1.7% thanks to growth of book.
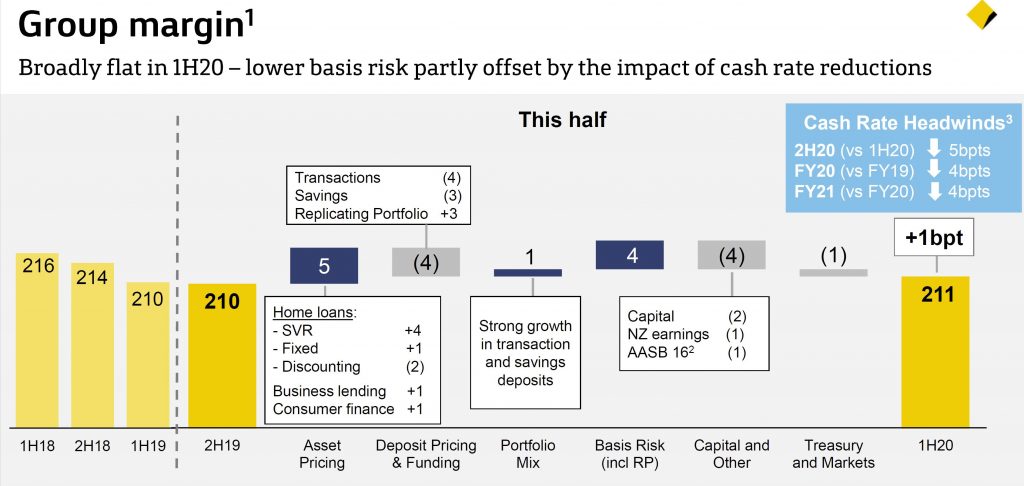
The Group net interest rate margin was 2.11%, up 1 basis point from 2H19. They indicated that the lower cash rate will continue to impact NIM – by around 5 basis points in 2H20, and 4 basis points across the FY 20 and FY 21.
Non-interest income was down 4.6%, mainly thanks to the impact of bushfire related claims ($83m) on insurance income, changes to wealth management fees and hedging losses.
Operating expenses were up 2.6% to %5,429m with $630m was refunded to customers to 31 Dec 2019 following the Royal Commission misconduct and other required remediation. A further $596m is outstanding.
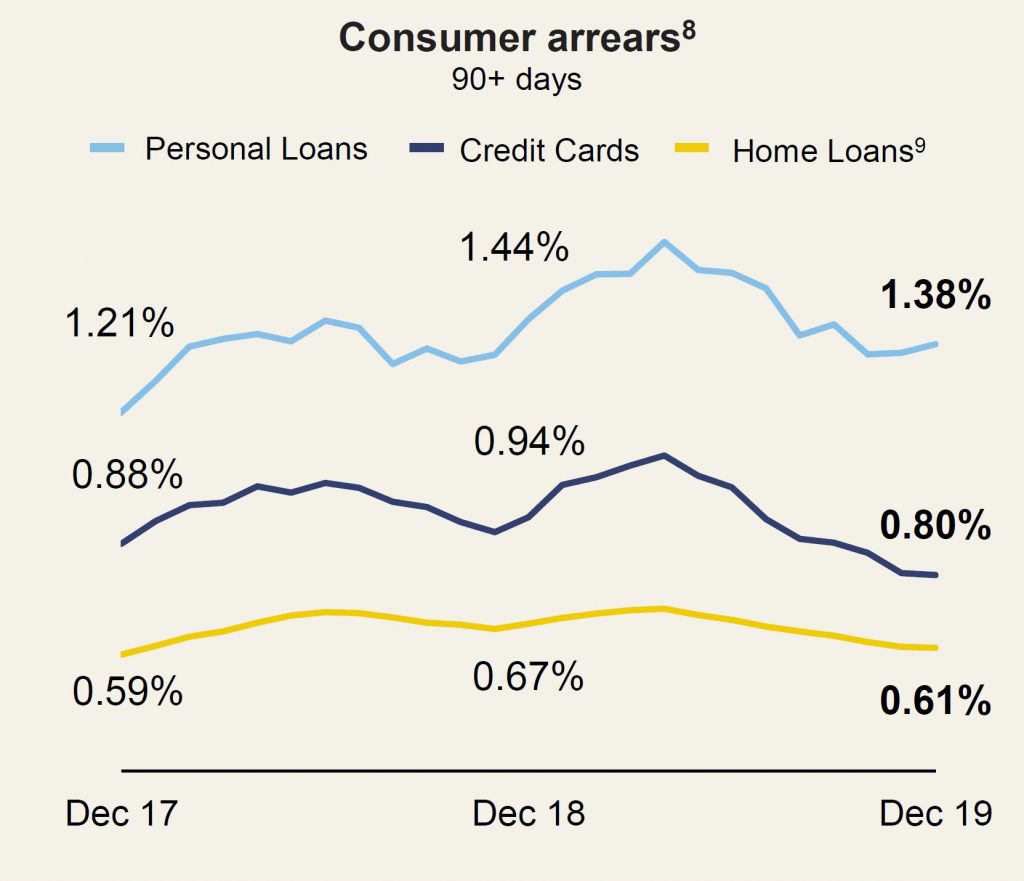
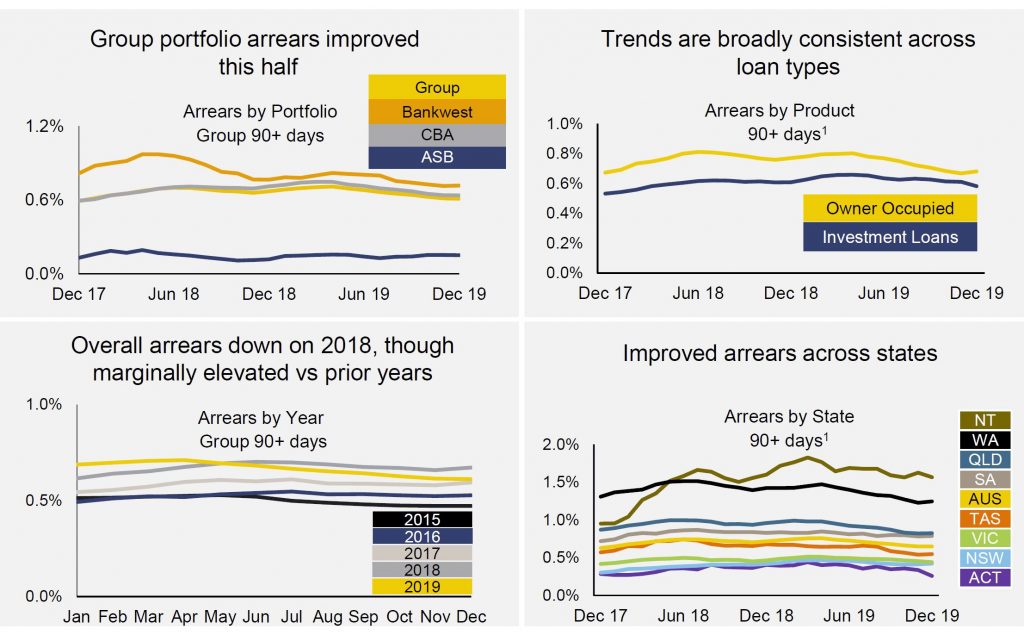
Loan impairment expenses were 17 basis point of average gross loans and acceptances. This was up 2 basis points, but includes 3 basis points for drought and bushfire provisions. They note a fall in consumer arrears thanks to the improved property market, but said pockets of stress remain in the discretionary retail, agricultural and construction sectors. Provisions lifted from 1.28% to 1.34% to $5,026 million.
Mortgage arrears are down a little, though are marginally elevated vs prior years.
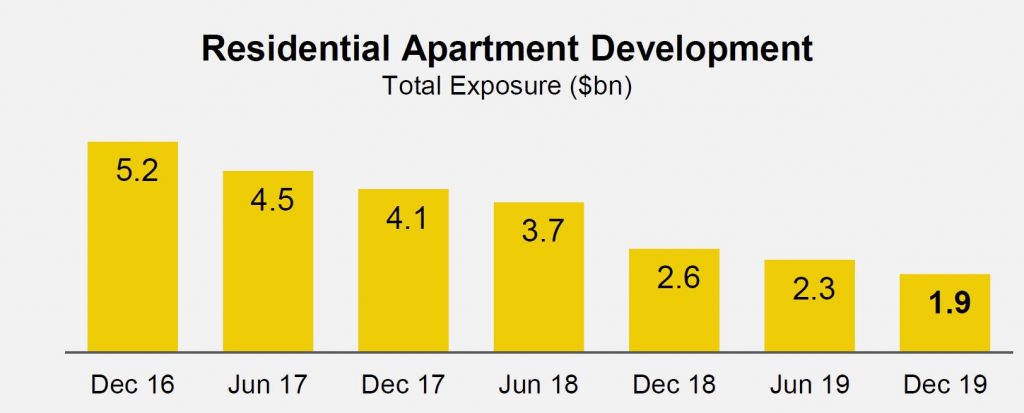
Exposure to apartment development has reduced b y 63% since December 2016. Sydney represent 60% of the development exposure.
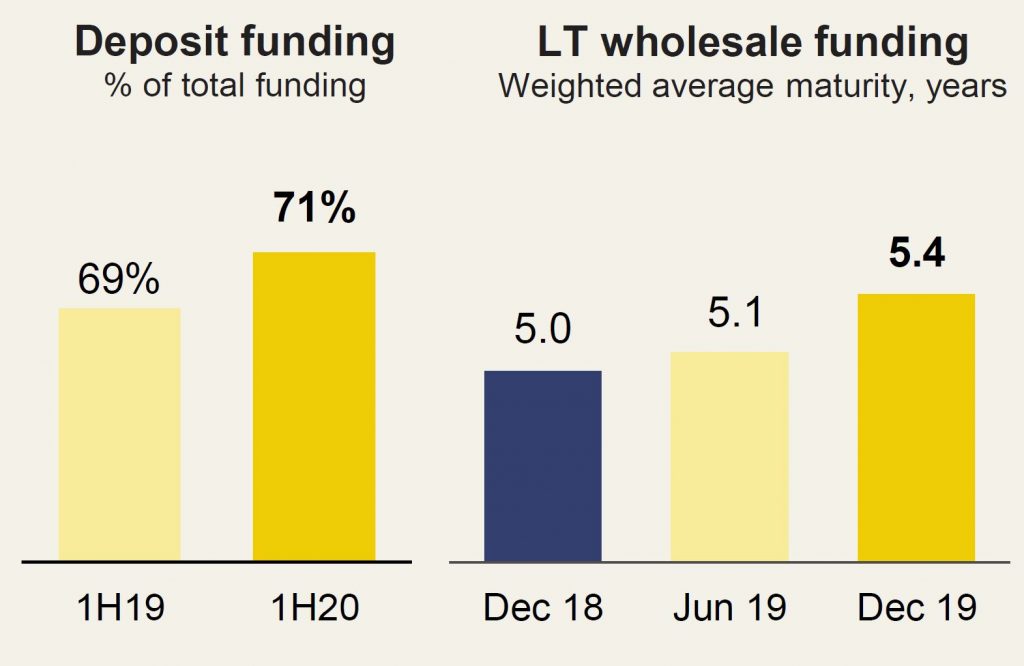
The percentage of book funded by deposits rose to 71% from 69% in 1H19. Overall average wholesale funding is 5.4 years. The Net Stable Funding ratio improved 1% to 113% and the Liquidity Coverage Ratio increased by 3% to 134%.
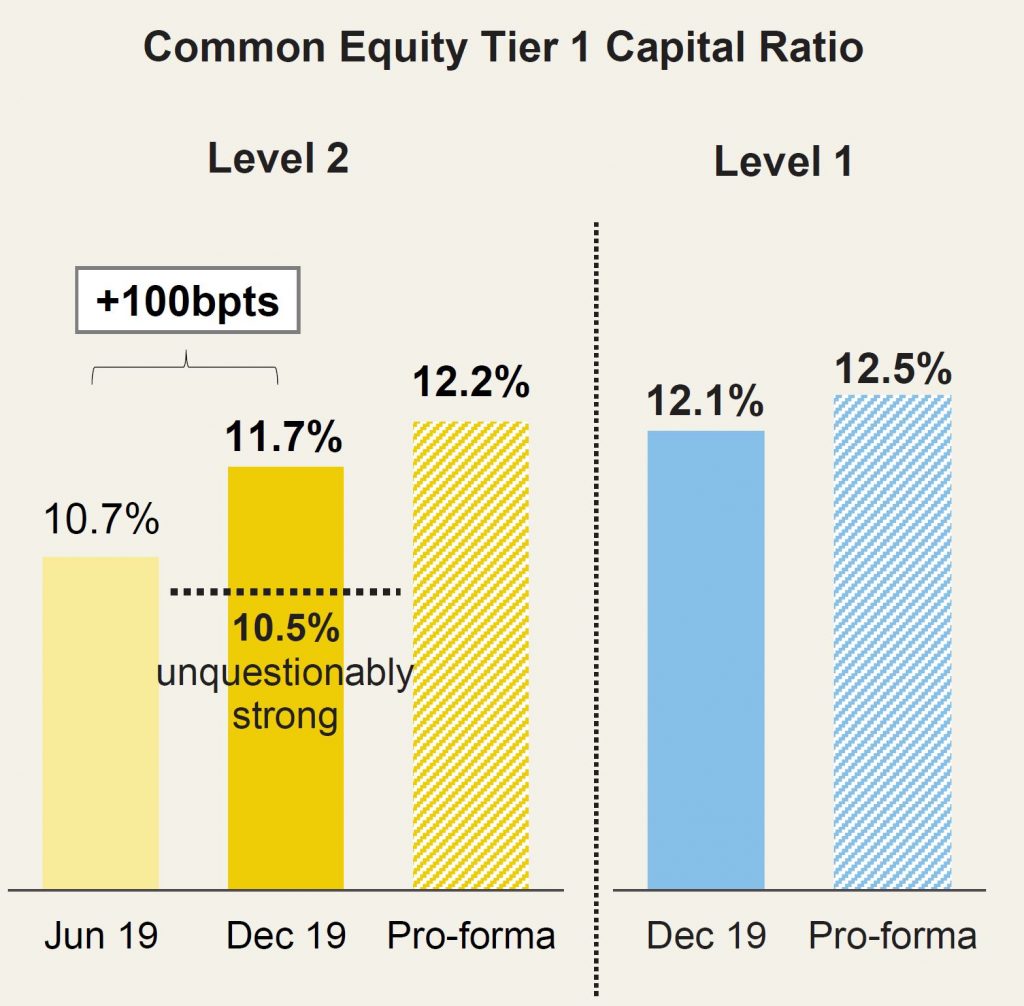
The Lever 2 CET1 ratio rose by 100 basis points to 11.7% and is above the APRA threshold. This was helped by recent asset sales. Further divestment proceeds will assist ahead.
A $500m on-market purchase will support the Dividend Reinvestment Plan. No discount will be applied to shareholders.
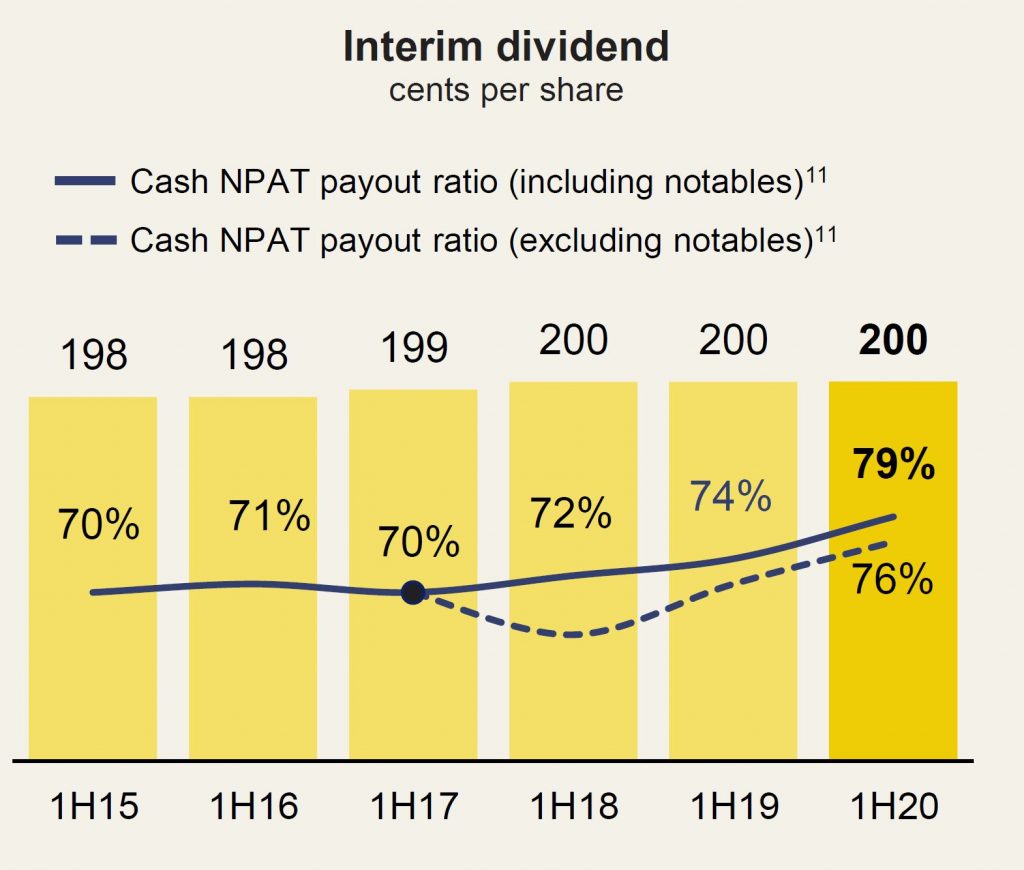
The bank declared a dividend of $2.00 per share, fully franked – unchanged from 1H19 interim.
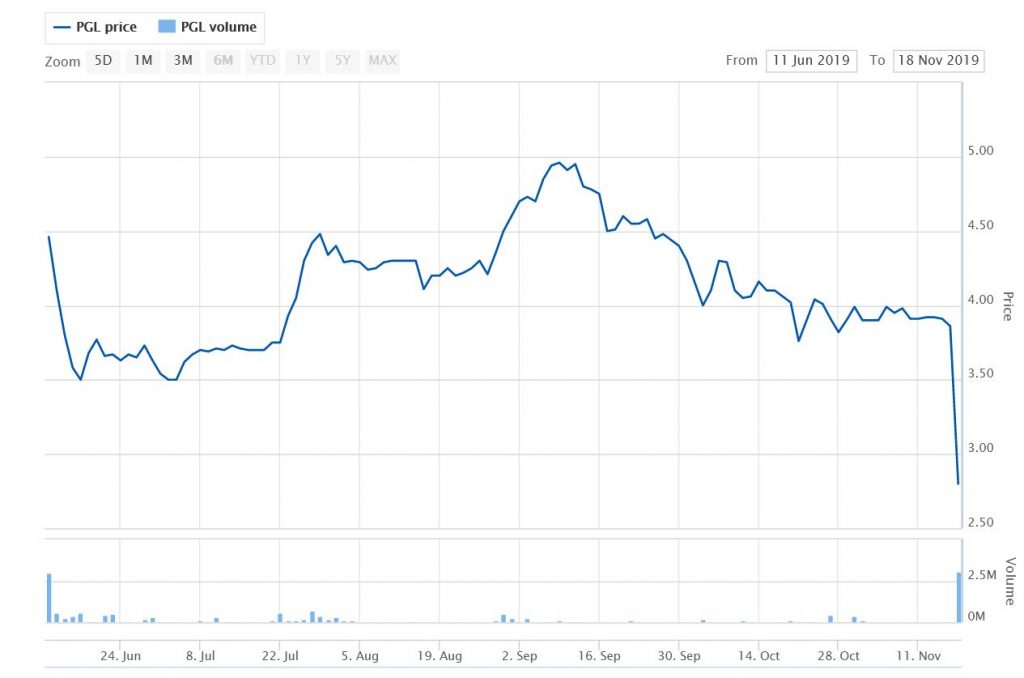
Underestimating the appetite of premium quality borrowers has led to a revenue downgrade for fintech business lender Prospa and a 28 per cent reduction in its share price. Via InvestorDaily.
Prospa
shares crashed 27 per cent to a record low of $2.80 on Monday morning
following the release of the group’s trading and guidance update.
Prospa
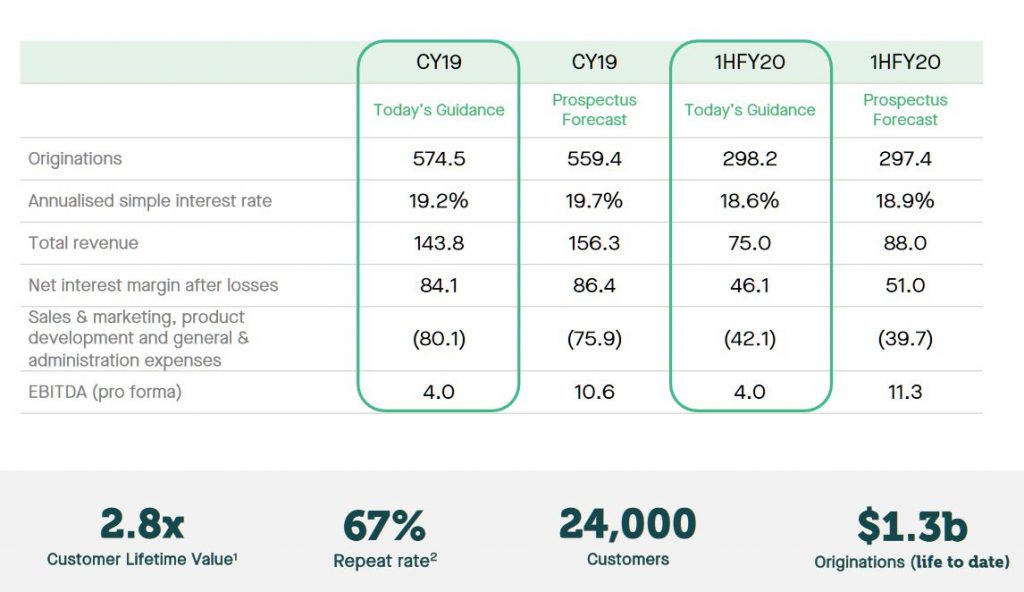
has revised its revenue forecasts down by 8 per cent to $143.8 million
from the $156.4 million as advertised in the company’s prospectus.
Prospa floated on the ASX in June with an IPO price of $3.78 and rallied
almost 20 per cent in day of trading, lifting the company’s market cap
to $720 million.
However, following this week’s trading update,
the company is now valued at $450 million. Sales and marketing expenses
are forecasted to be $80.1 million for the calendar year, up 5.5 per
cent from the $75.9 million forecast in the prospectus.
EBITDA is forecast to take a 62 per cent hit from $10.6 million to $4 million.
Prospa
stated that the downward revision to its revenue predictions is largely
due to its “premiumisation strategy exceeding our forecast”.
Premiumisation is traditionally a strategy employed by companies to make
consumers pay more for a product by promoting its exclusivity. But for a
small business lender like Prospa, premium customers are actually less
profitable.
“While we continue to grow our lending to all credit
grades, we are seeing increased appetite for our solutions from premium
credit quality customers who pay lower interest rates over longer
terms,” the company said.
Prospa said its strategy to optimise
its cost of funding has facilitated lower rates for customers and
broadened its customer base and appeal – allowing the company to tap
more of the $20 billion addressable market.
“The introduction of a
new rate card in early April was more successful than anticipated, with
approximately 43 per cent of Prospa’s portfolio now represented by
premium customers,” the company said.
“The evolution in book
composition towards premium grades has led to a short-term impact on
revenue, despite the positive impact premiumisation has had on market
penetration, operating leverage, funding diversity and portfolio
resilience.”
Lending rates to premium customers are lower than the
average book rate and the loan duration is longer. In the four months
to 31 October 2019, the average simple interest rate on Prospa’s book
has adjusted to 18.5 per cent compared to the prospectus forecast at
18.9 per cent and average loan term has increased to 14.6 months
(Prospectus at 14 months).
Early indications are that the static
loss rates in the growing premium section of our loan book are well
below 4 per cent, which is the bottom of the risk appetite range.
Greg
Moshal, co-founder and joint CEO of Prospa, admitted that the lender is
experiencing some short-term impacts on its forecasts, but said he
remains confident Prospa has the right growth strategies to deliver
long-term shareholder value and solve the funding challenges of small
business owners across Australia and New Zealand.
“Originations
are growing,” he said. “Portfolio premiumisation means a higher quality
loan book and lower rates and longer average terms for our customers.
Early loss indicators continue to improve and we expect to continue to
invest in new products, sales and marketing.”
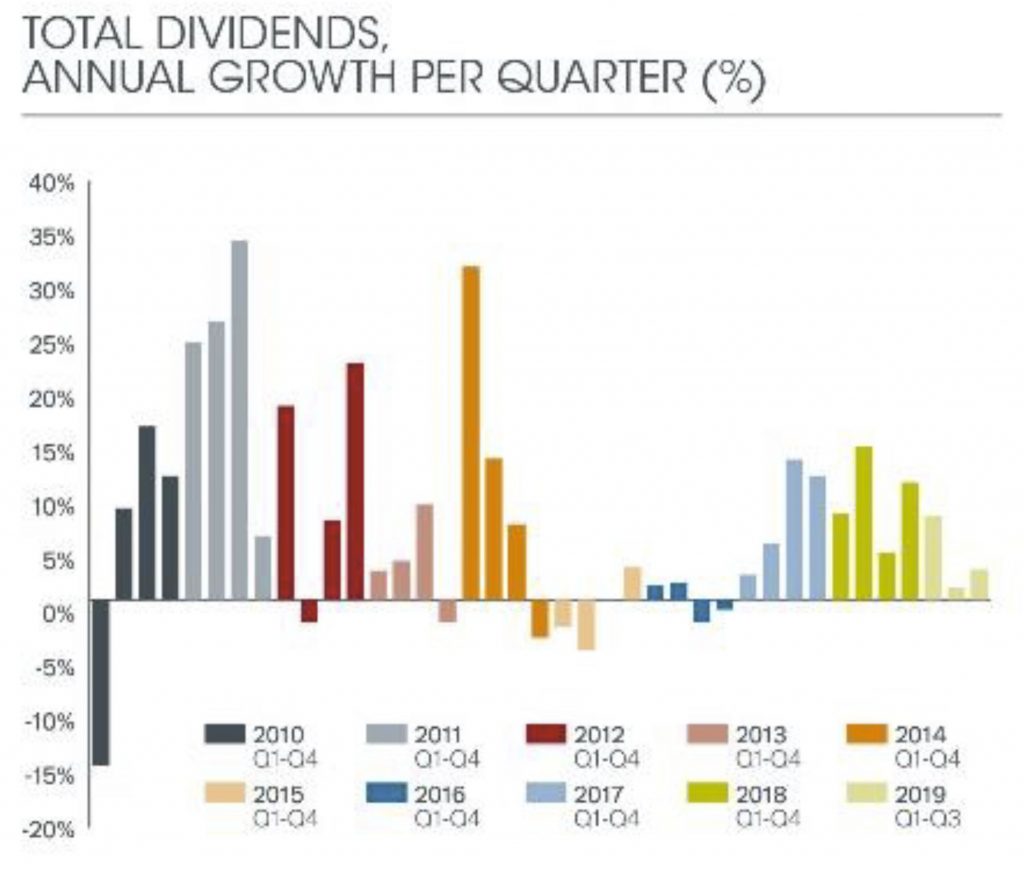
A slowdown in global dividend growth is underway, according to the latest Janus Henderson Global Dividend Index (JHGDI). The trend began in the second quarter and continued in the third. Even at their slower pace, dividends are still growing comfortably, however.
Australia saw a big decline in dividends, with two fifths of companies in the index cutting dividends. The total dropped to $18.6bn, the lowest Q3 total since 2010 in US dollar terms, down 5.9% on an underlying basis. The biggest impact came from National Australia Bank, which made its first dividend cut in a decade, and Telstra. Australia already has the lowest dividend cover in the world among the bigger economies.
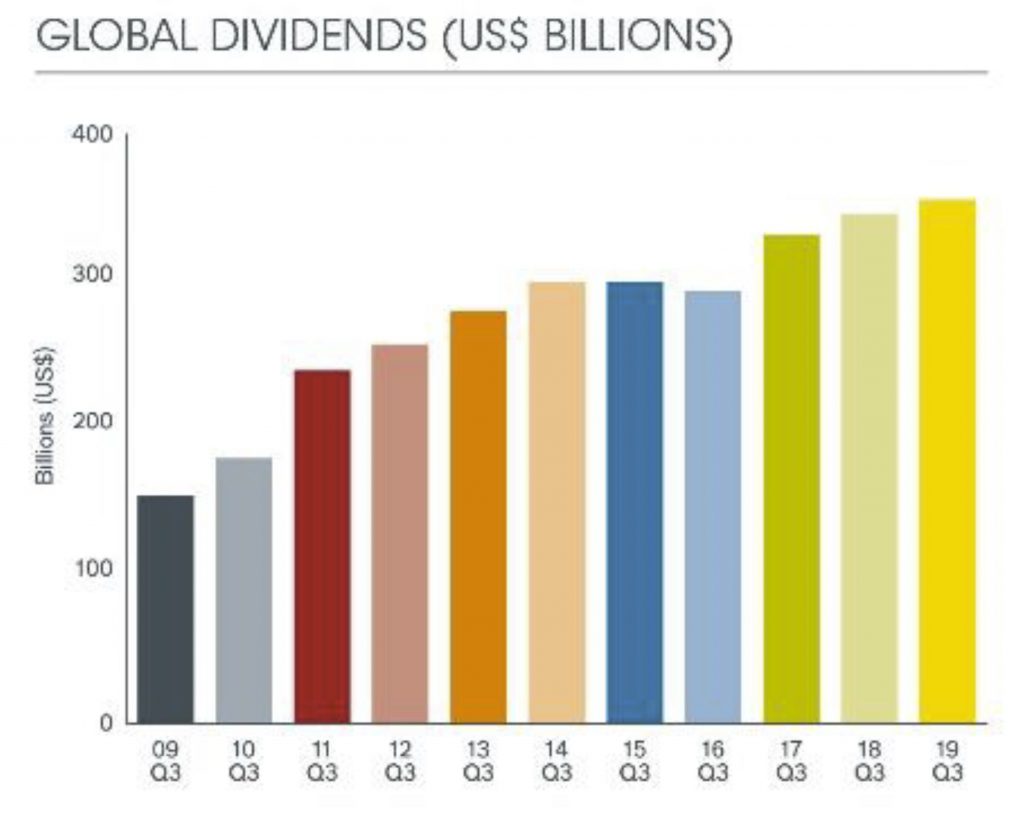
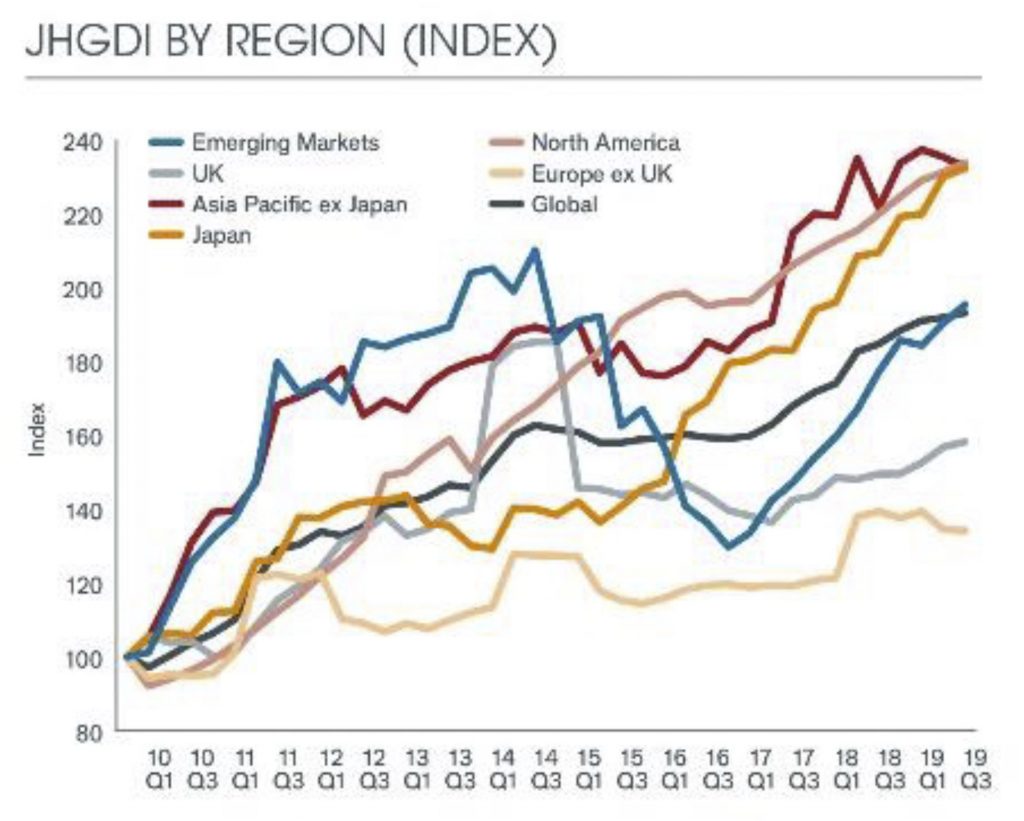
Globally, payouts rose 2.8% on a headline basis to reach a new third-quarter record of $355.3bn, equivalent to an underlying growth rate of 5.3% once the stronger dollar and minor technical factors were taken into account. This is exactly in line with the long-term trend, and Janus Henderson’s forecast. The Janus Henderson Global Dividend Index rose to 193.1, a new record.
Only US dividends reached an all-time record in Q3, up 8.0% on an underlying basis, well ahead of the global average. A slowdown in profit growth is however beginning to impact dividend payments. A rising proportion of US companies held their dividends flat – one in six companies in Q3, up from one in ten in Q1, though there remain few outright cutters. The largest dividend payer in the US this year will be AT&T, jumping ahead of Apple, Exxon Mobil and Microsoft. AT&T’s return to the top spot for the first time since 2012 is thanks to its acquisition of Time Warner in 2018; the combined company will distribute close to $14.9bn, though this will not be enough to dislodge Shell as the world’s largest payer for the fourth year in a row.
Allowing for seasonality Japan, Canada and the
United Kingdom all saw third-quarter records, though in the UK’s case this was
entirely due to very large special dividends from banks and miners. The
underlying trend in the UK remains lacklustre with underlying growth of just
0.6%.
From a seasonal perspective, Q3 is especially
important for Asia Pacific and China. Here there were distinct signs of
weakness. Almost half the Chinese companies in the index reduced their payouts,
and the modest growth that was achieved was dependent on big increases from one
or two companies. Chinese dividends totalling $29.2bn crept ahead 3.7%
year-on-year on an underlying basis and without Petrochina’s large increase,
they would have been lower year-on-year. The slowdown in the
Chinese economy is affecting the dividend-paying
capacity of its companies, particularly since in the short-term dividends are
more closely tied to profits in China than in other parts of the world such as
the US and UK due to companies largely adopting a fixed payout-ratio policy.
Across Asia-Pacific, Australia and Taiwan led
payouts lower, and only Hong Kong delivered strong growth. It was a difficult
quarter in Australia with two fifths of companies in the index cutting
dividends. The total dropped to $18.6bn, the lowest Q3 total since 2010 in US
dollar terms, down 5.9% on an underlying basis. The biggest impact came from
National Australia Bank, which made its first dividend cut in a decade.
Australia already has the lowest dividend cover in the world among the bigger
economies, so if the slowing domestic economy leads to a decline in corporate
profitability, it will be bad news for income investors, highlighting the
importance of taking a diversified global investment approach. Hong Kong’s
payouts jumped 8.1% on an underlying basis, contrasting with the mainland
trend. This was mainly due to dividends from oil company CNOOC and from the
real estate sector.
Q3 marks the seasonal low point for European
dividends. They rose 7.0% on an underlying basis, though the growth rate was
flattered by positive developments at just a few companies, and the total will
not be enough to affect the annual rate significantly.
The energy sector saw the strongest growth in
Q3, with dividends up by just over a fifth on an underlying basis. Most of this
came from Russian oil companies, but China and Hong Kong, Canada and the United
States also made a significant contribution to the increase. Basic materials
headline growth was boosted by special dividends, but telecoms companies around
the world were dogged by cuts, with the biggest impact from Vodafone in the UK,
China Mobile and Telstra in Australia. Only just over half of the telcos in the
index increased their payouts year-on-year.
Janus Henderson has left its $1.43trillion
forecast for global dividends unchanged for 2019. This represents a headline
increase of 3.9%, equivalent to underlying growth of 5.4%. By contrast 2018 saw
underlying growth of 8.5%. 2019 will mark the tenth consecutive year of
underlying growth for dividends.
CBA, who is on a different reporting cycle to the other majors, released their trading update to 30th September 2019 today. These are unaudited numbers and included some one-off items, but generally it looks like CBA managed to navigate the complexities of the current market quite well. But its all a matter of relativity as all the banks remain under pressure.
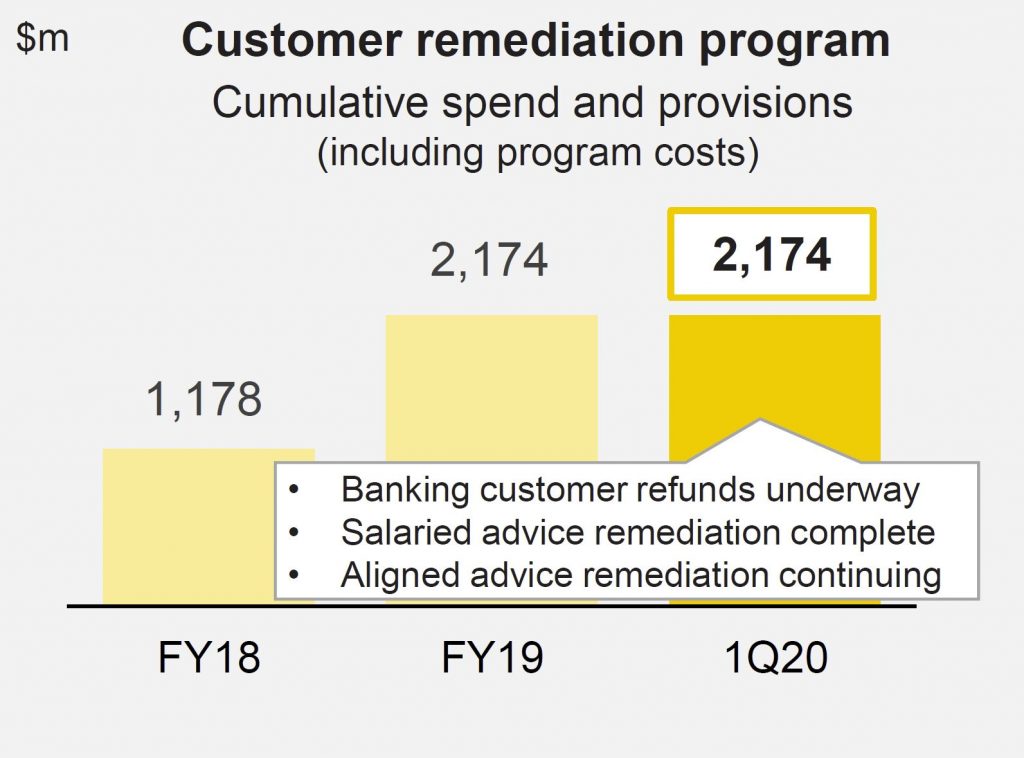
That said, the CET1 ratio was down, there was a considerable increase in corporate troublesome assets (discretionary retail, construction and agriculture), plus pockets of stress across its personal loans portfolio in Western Sydney and Melbourne. The Net Interest Margin was “lower than June 2019 due to headwinds associated with a low interest rate environment, which will continue to impact margins in future periods”. $2.2bn is flagged for customer remediation in program spend and provisions.
They made comparisons with the average of the previous two quarters, which might flatter the results a little. And they may have been later to implement the revised tighter HEM, which might have flattered their loan growth. Overall capital risk wights for mortgages sat at 25.8%.
Worth also noting that according to Banking Day:
Commonwealth Bank was the subject of the highest number of complaints to the Australian Financial Complaints Authority over the year to June, with the other big banks not far behind.
CBA was way out in front, with 3,890 complaints. ANZ, at number two, received more than 1,000 fewer complaints.
Unaudited statutory net profit was around $3.8 billion in the quarter, but this included a $1.5 billion gain from the sale of Colonial First State Global Asset Management(CFSGAM) to Mitsubishi UFJ Trust and Banking Corporation, with a post-tax gain on sale of approximately $1.5 billion.
Net cash profit from continuing operations was around $2.3 billion, up 5% excluding one-offs. This is the figure they want you to focus on!
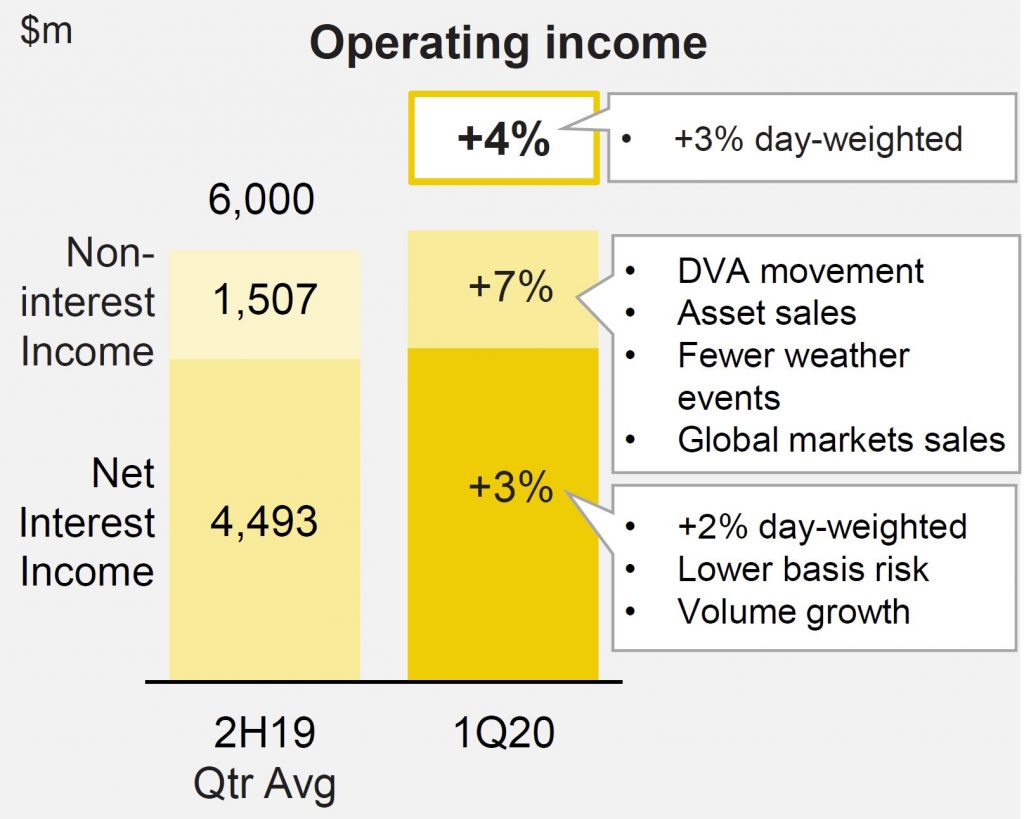
Operating income was up 3% (day-weighted)
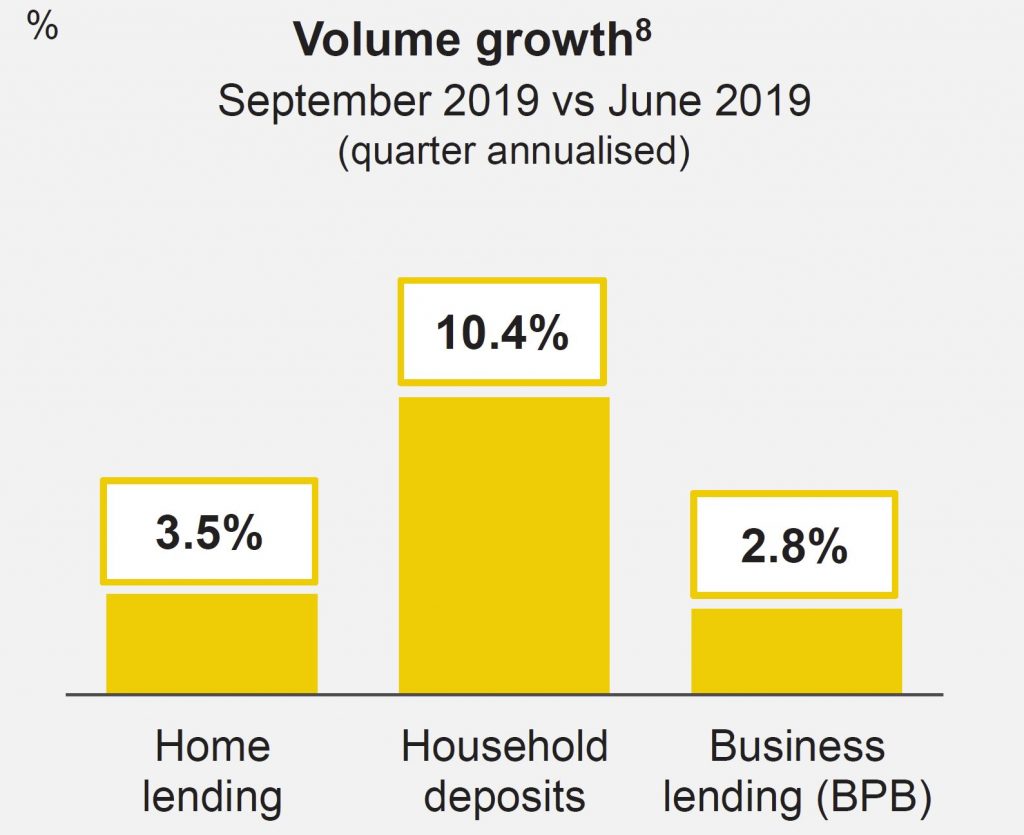
Net interest income increased 3%, benefiting from 1.5 additional days in the quarter. On a day-weighted basis, Net Interest Income was 2% higher, underpinned by volume growth in core markets of home lending, business lending and household deposits.
Excluding a 4 bpt benefit from lower basis risk, the Group’s Net Interest Margin was lower than June 2019 due to headwinds associated with a low interest rate environment, which will continue to impact margins in future periods.
Non-interest income increased 7%, benefiting from timing differences and one-off items including a favourable movement in the derivative valuation adjustment (DVA), asset sales in Structured Asset Finance (SAF), higher insurance income from fewer weather events/claims and higher global markets sales. These were partly offset by lower Funds Management income and the ongoing impact of the Bank’s Better Customer Outcomes program, which continues to deliver customer savings equivalent to annualised income forgone of $415m.
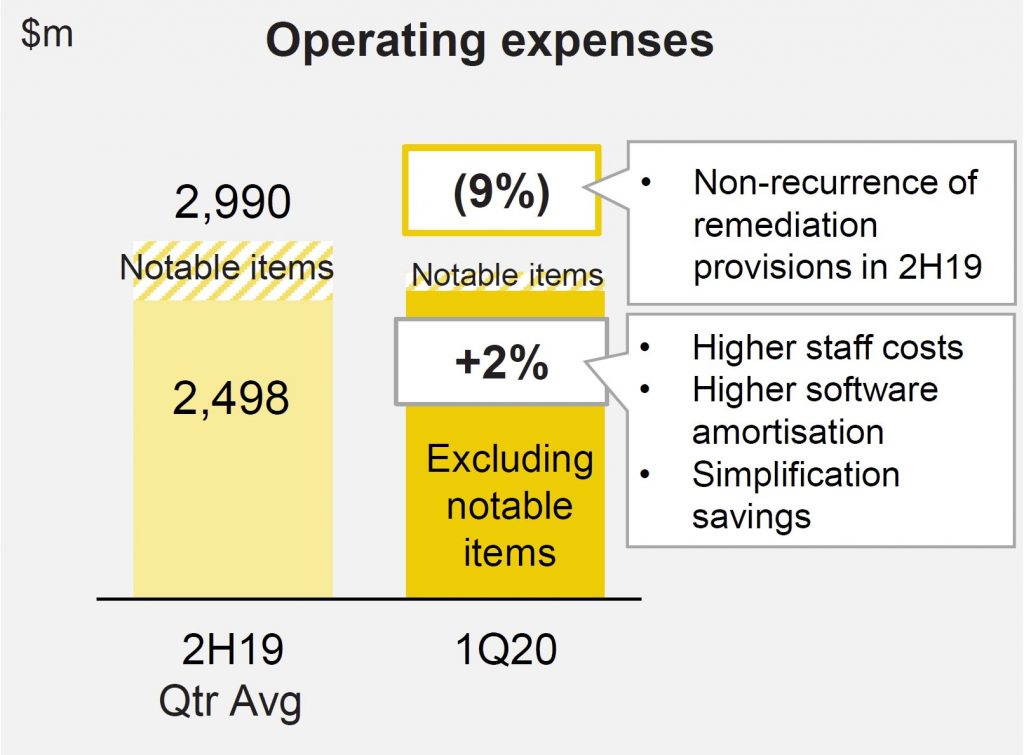
Operating expenses were up 2% (excluding notable items), reflecting higher staff costs and IT amortisation.
Customer remediation continues to drag the results. Of the $2.2bn in total program spend and provisions, $1.2bn relates to customer refunds of which approximately $600m has been paid to banking and wealth management customers to-date (ex aligned advice). Salaried adviser ongoing service remediation is now complete and represented a refund rate of 22% (ex interest). Aligned advice remediation work relating to ongoing service fees charged between FY09 and FY18 is continuing. The aligned advice remediation provision recognised in FY19 of $534m included program costs of $160m, $251m in customer refunds and $123m in interest. This assumed a refund rate of 24% (ex interest) and36% (incl.interest).
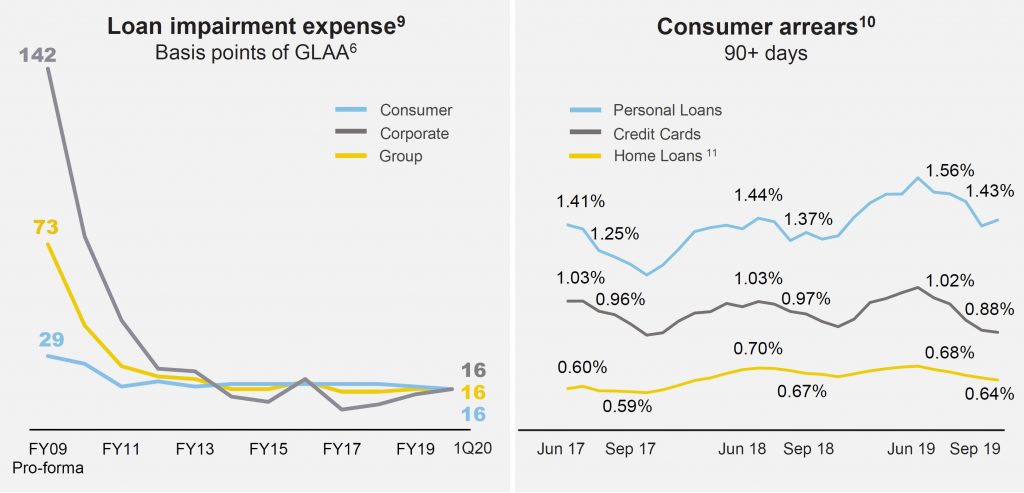
Loan Impairment Expenses were $299m in the quarter equated to 16bpts of Gross Loans and Acceptances, unchanged onFY19.
Consumer arrears improved in the quarter due to seasonality and the benefit of higher tax refunds. Personal Loan arrears rates remained elevated due to lower portfolio growth and continued pockets of stress in Western Sydney and Melbourne.
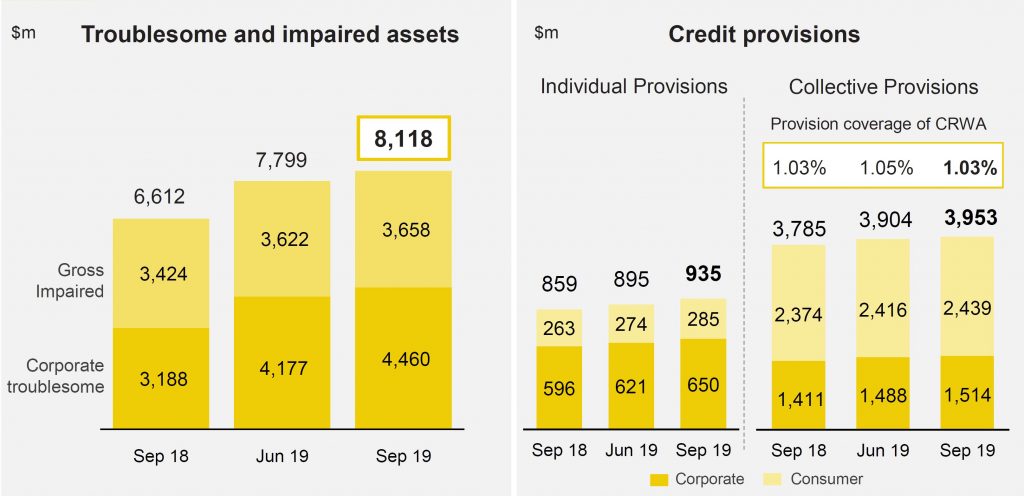
Troublesome and impaired assets increased to approximately $8.1bn. Corporate Troublesome assets continued to reflect weakness in discretionary retail, construction and agriculture,as well as single name exposures.
Total provisions increased by $89m to approximately $4.9bn.
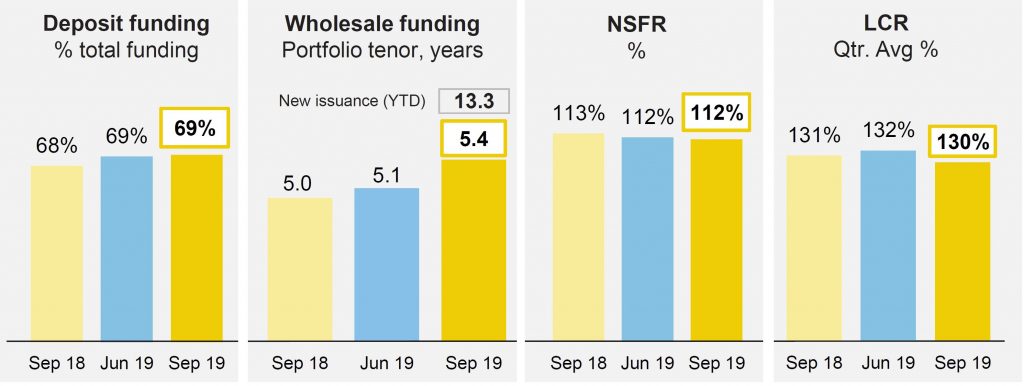
Customer deposit funding was at 69% and the average tenor of the long term wholesale funding portfolio at 5.4 years. The Group issued $5.8bn of long term funding in the quarter, including two long-dated Tier 2 transactions following the release of APRA’s loss-absorbing capacity proposal in July2019, contributing to a weighted average maturity of new issuance in the quarter of 13.3 years.
The Net Stable Funding Ratio (NSFR) was at 112%, the Liquidity Coverage Ratio(LCR) at 130% and the Group’s Leverage Ratio at 5.5% on an APRA basis (6.4%internationally comparable).
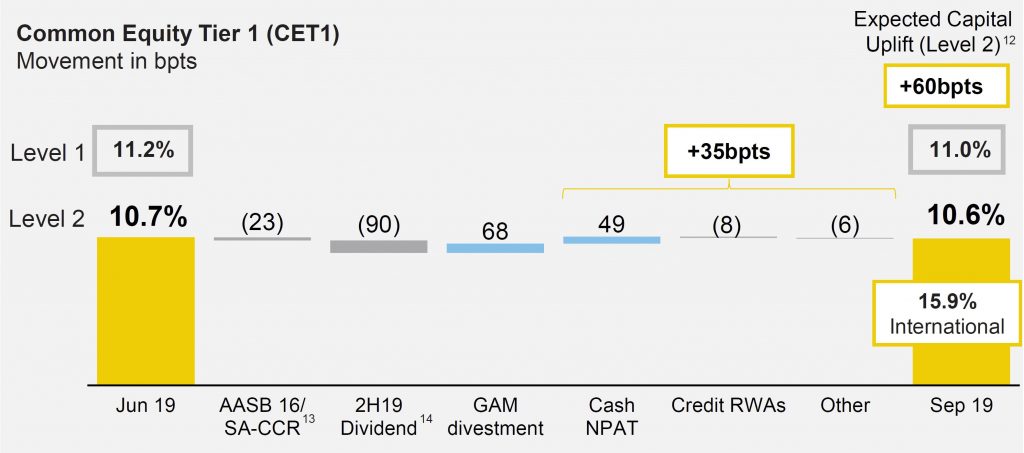
The Common Equity Tier 1 (CET1) APRA ratio was 10.6% as at 30 September 2019. After allowing for the impact of the 2019 final dividend and one-off impacts from regulatory changes and the CFSGAM divestment, CET1 increased 35bpts in the quarter. This was driven by capital generated from earnings, partially offset by higher Credit Risk Weighted Assets driven by revised regulatory treatments and lending volume growth. As at 30 September 2019, the Level1 CET1 was 11.0%, 40bpts above the Group’s Level2 CET1 Ratio.
The Group’s remaining previously announced divestments are expected to collectively provide an uplift to Level2 CET1 of approximately 60bpts. As outlined in the Group’s FY19 results, a strong expected capital position creates flexibility for the Board in its consideration of capital management initiatives.
Nab reported a 13.6% fall in statutory net profit for 2019, at $4,798 million, compared with $5,702 million last year. Along with ANZ and Westpac, it is the same story of a massive hit from customer remediation (past results inflated by milking customers, and many customers still require remediation), margin compression, not helped by lower cash rates, weak loan growth, and higher mortgage delinquency and provisions. And again they expect 2020 to be a weak year economically speaking. So no growth story here.
Revenue was down 4.2%, although they at pains to point out that excluding customer-related remediation, revenue rose 1.1% mainly reflecting growth in business lending partly offset by lower margins. Of course they dismiss many of the writes-downs as a one-off, and there will be some “putting the trash out” as the new CEO takes up the reigns. $2,092 million for customer remediation all up, is a big number, and not yet final. But do not be misled, the underlying business is under extreme pressure, and competition for the meager loan volumes is intense.
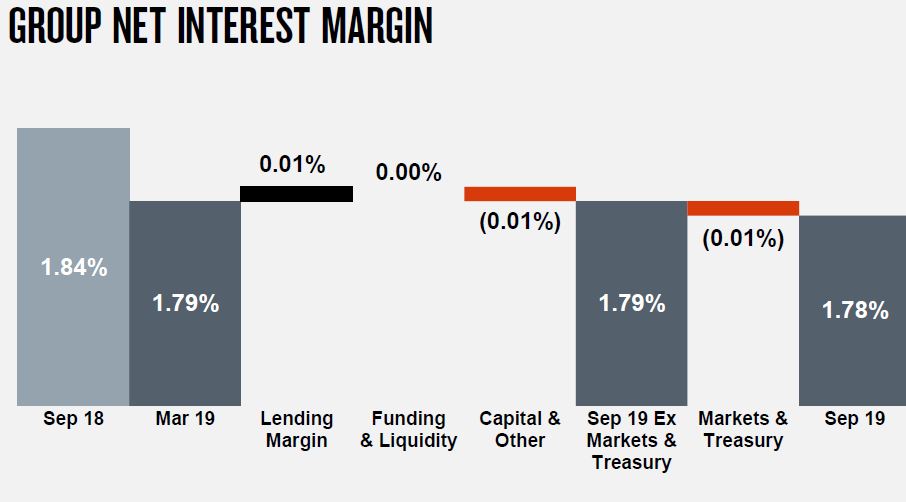
Net Interest Margin (NIM) declined 7 basis points (bps) to 1.78%. Excluding Markets and Treasury and customer-related remediation, NIM declined 4bps with home lending competition an important driver.
Expenses rose 0.2%. Excluding large notable items, expenses were up 0.4% with productivity benefits and lower performance based compensation largely offsetting higher investment and increased spend to strengthen the compliance and control environment.
But the revenue excludes customer-related remediation $1,207m in FY19, $249m in FY18. Expenses excludes: customer-related remediation $364m in FY19, $111m in FY18; capitalised software policy change $494m in FY19; restructuring-related costs $755m in FY18.
In cash earnings terms, they fell by 10.6%, from $5,702 million in 2018 to $5,097 in 2019.
FY19 cash earnings includes charges of $1,100 million after tax for additional customer-related remediation. During FY19 they uplifted customer remediation practices with more than 950 people (including NAB employees and external resources) solely dedicated to remediating customers.
In combination with provisions raised in 2H18 which have not yet been utilised, provisions for customer-related remediation as at 30 September 2019 total $2,092 million. They warn that the final cost of such remediation matters remains uncertain.
Cost savings of $480 million were achieved in FY19 bringing total savings since September 2017 to $800 million.
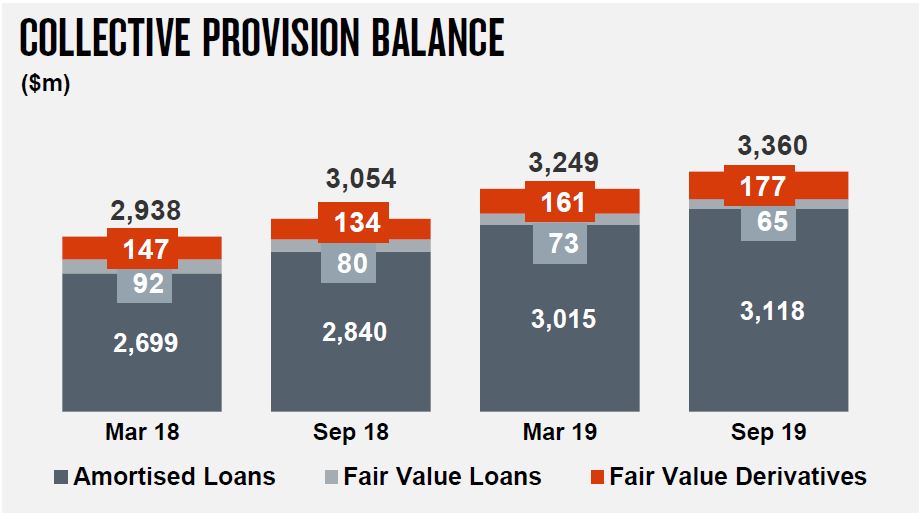
Collective provisions rose to 0.96% of CRWA’s, which equates to $3,360 million.
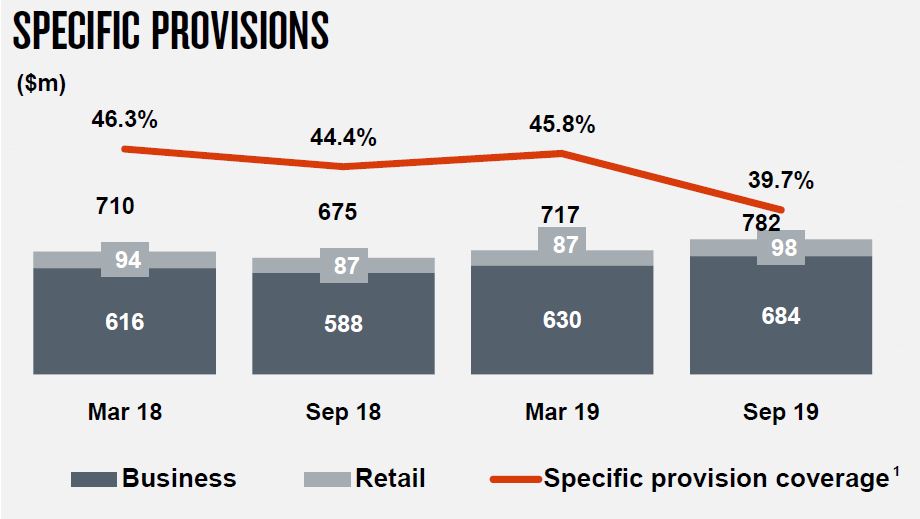
Whereas specific provisions fell to 39.7%, but were also higher.
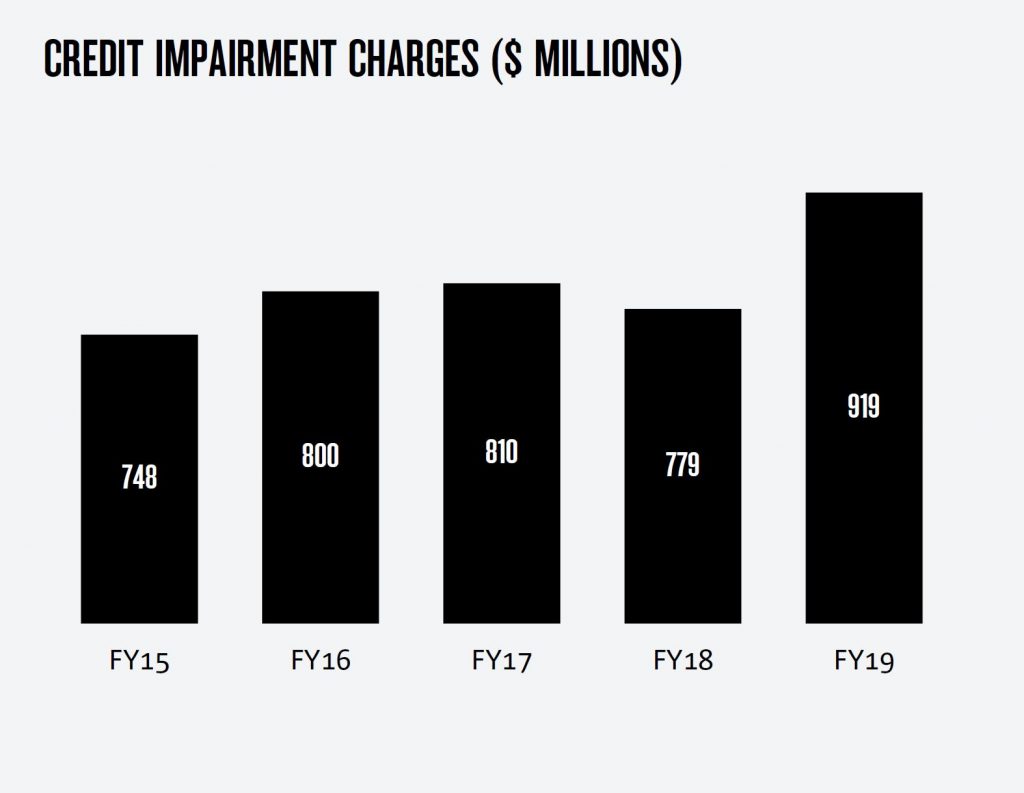
Credit impairment charges increased 18% to $919 million, and as a percentage of gross loans and acceptances rose 2bps to 15bps. FY19 charges include $60 million of additional collective provision forward looking adjustments for targeted sectors experiencing elevated levels of risk.
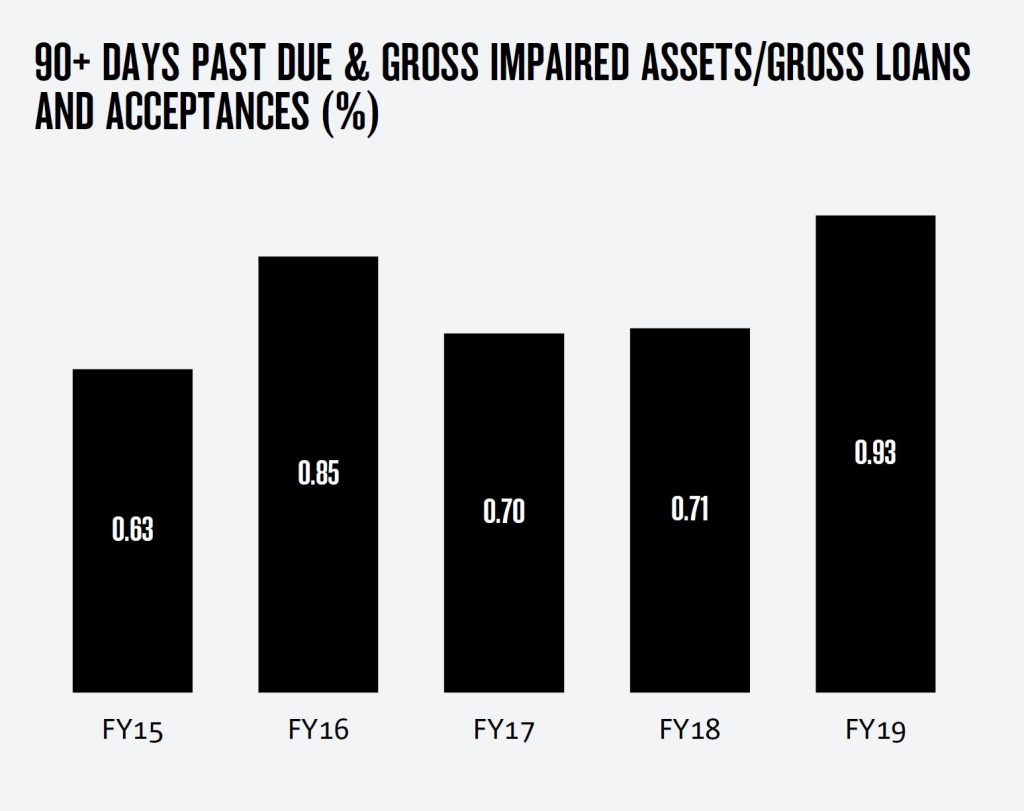
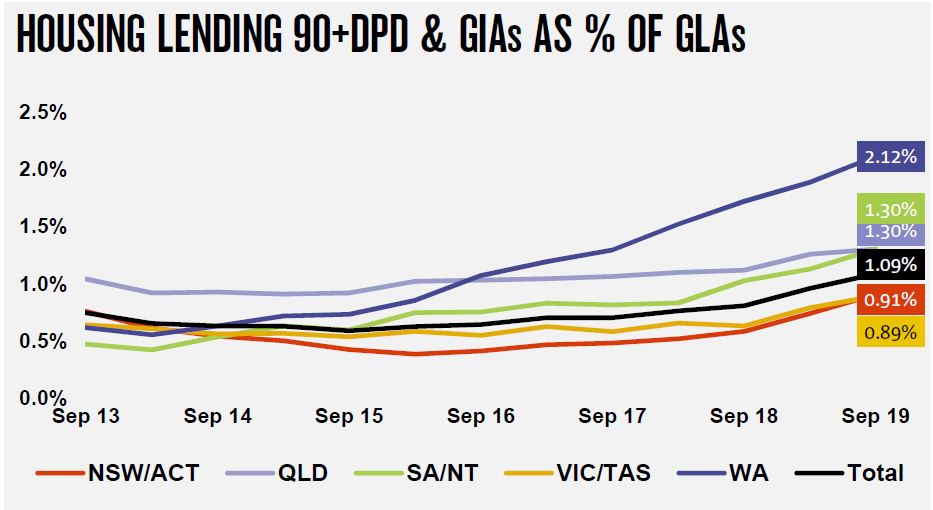
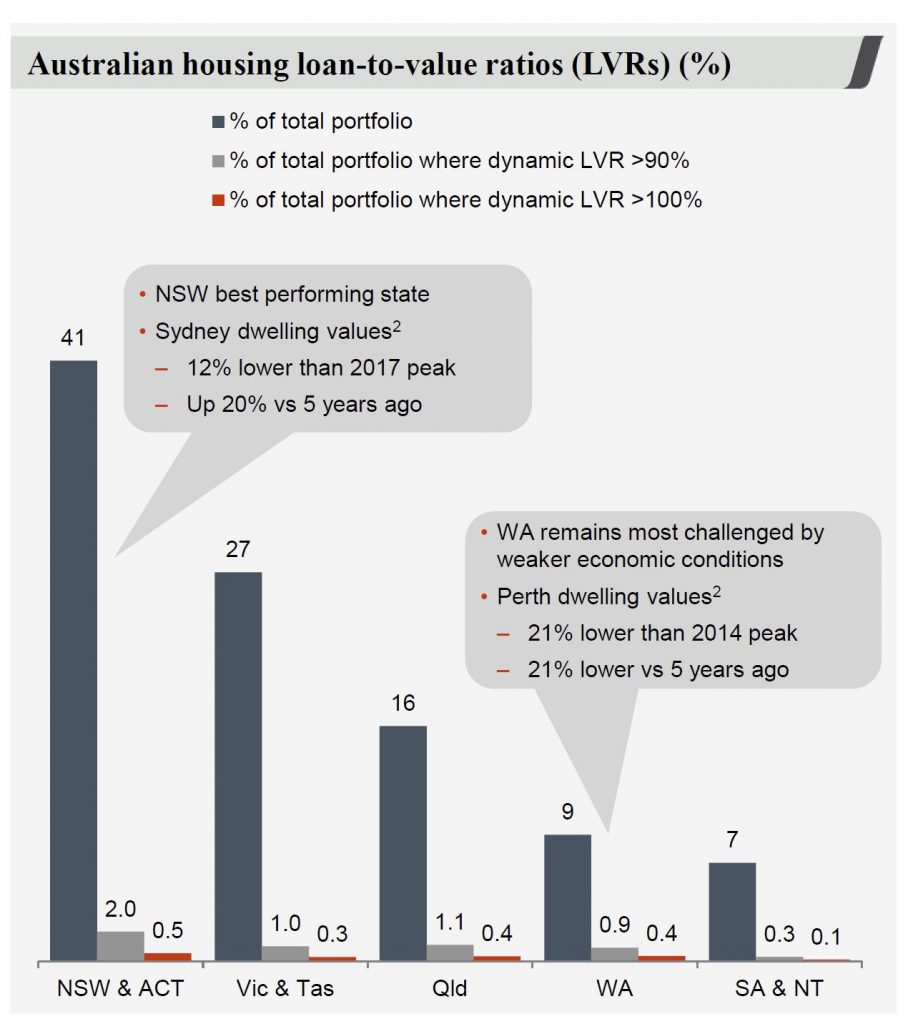
The ratio of 90+ days past due and gross impaired assets to gross loans and acceptances increased 22bps to 0.93%, largely due to rising Australian mortgage delinquencies.
While Australian housing arrears increased further, loss rates for this portfolio is 2bps. Collective provision forward looking adjustments for targeted sectors increased over FY19 and now stand at $641 million. In their scenario testing, they estimate a Peak Net Credit Impairment of $1.8bn in year 2, which equates to 57 basis points, based on an average home price fall of 25.2%
2.4% of mortgages in Australia are above 100% LVR (based on SA3 level CoreLogic data, so not very specific).
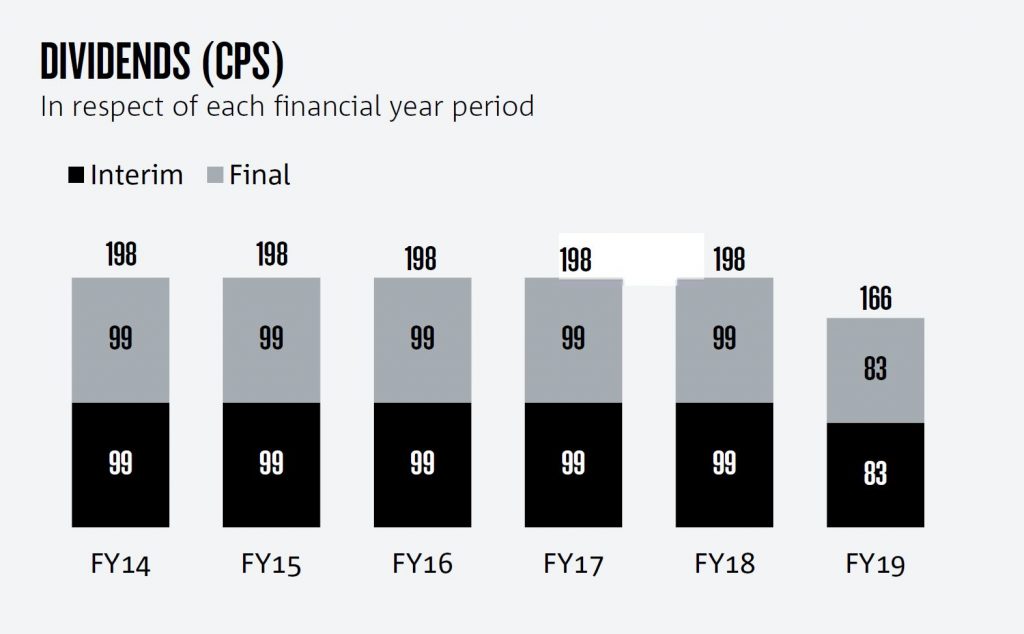
The final fully franked dividend of 83 cents per share (cps) has been held stable with the 2019 interim dividend, bringing the total for FY19 to 166 cps. This represents a 16% reduction compared with FY18.
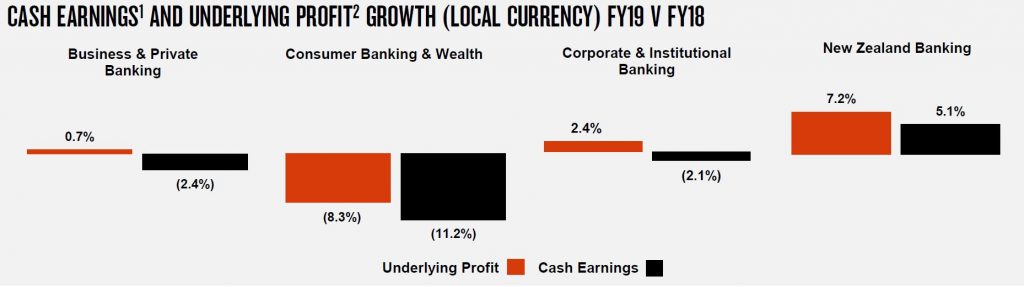
Across the divisions in cash earning terms:
Business & Private Banking $2,840 were down 2.4% on last years, reflecting higher credit impairment, charges and higher investment spend. Revenue increased 1% reflecting good SME business lending growth.
Consumer Banking & Wealth $1,366 were down 11.2% where banking earnings decreased given lower margins with competitive pressures in housing a key driver, combined with increased credit impairment charges.
Wealth earnings also declined reflecting the impact of customer preferences and repricing on margins, and lower average funds under management and administration.
Corporate & Institutional Banking $1,508 down 2.1% reflecting higher credit impairment charges relating to impairment of a small number of larger exposures. Revenue increased 1% despite lower Markets income, with higher lending volumes benefitting from continued focus on growth segments.
New Zealand Banking NZ$1,055m up 5.1% benefitting from growth in lending, partly offset by increased investment spend and higher credit impairment charges.
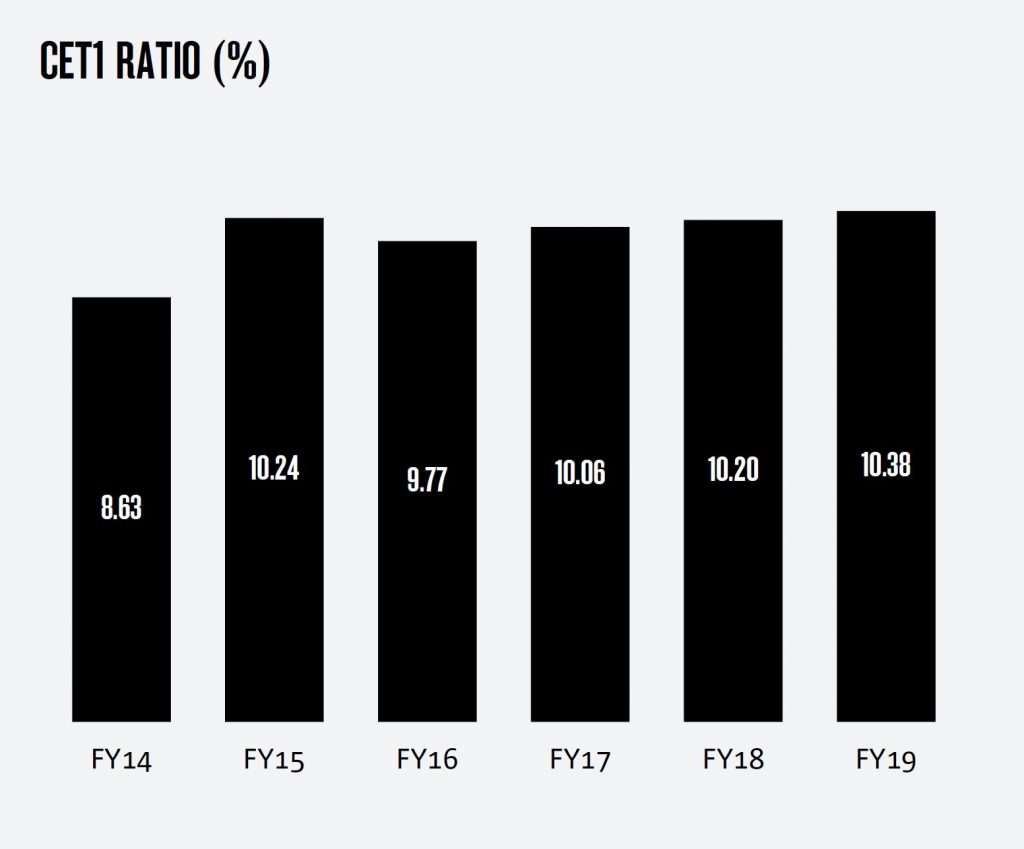
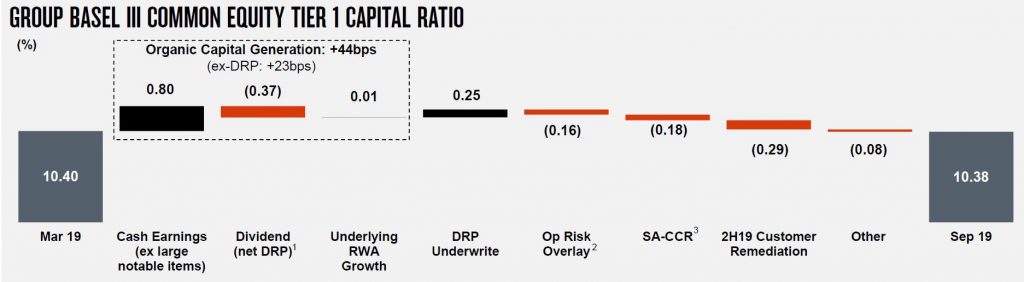
The Group Common Equity Tier 1 (CET1) ratio is 10.38%, up 18bps from September 2018, and includes $1 billion (25bps) of proceeds received in July from the 1H19 underwritten Dividend Reinvestment Plan and 34bps adverse impact from regulatory changes relating to operating risk and derivative counter party credit risk measurement.
Leverage ratio (APRA basis) of 5.5%
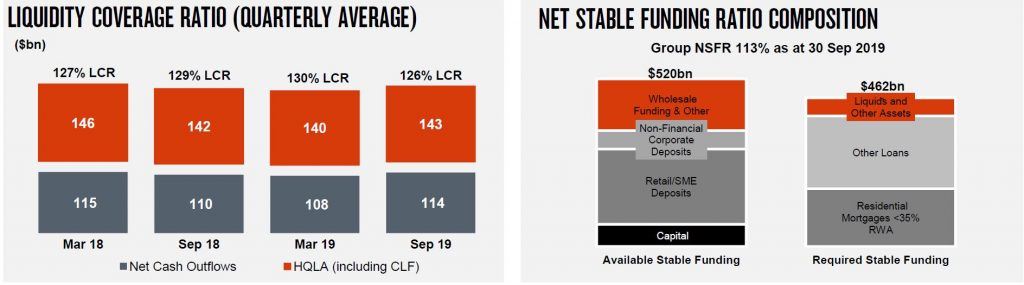
Liquidity coverage ratio (LCR) quarterly average of 126% and Net Stable Funding Ratio (NSFR) of 113%
NAB expects weak credit growth ahead, a GDP result in 202 of around 2% and business confidence also weakened which may dampen business credit growth.
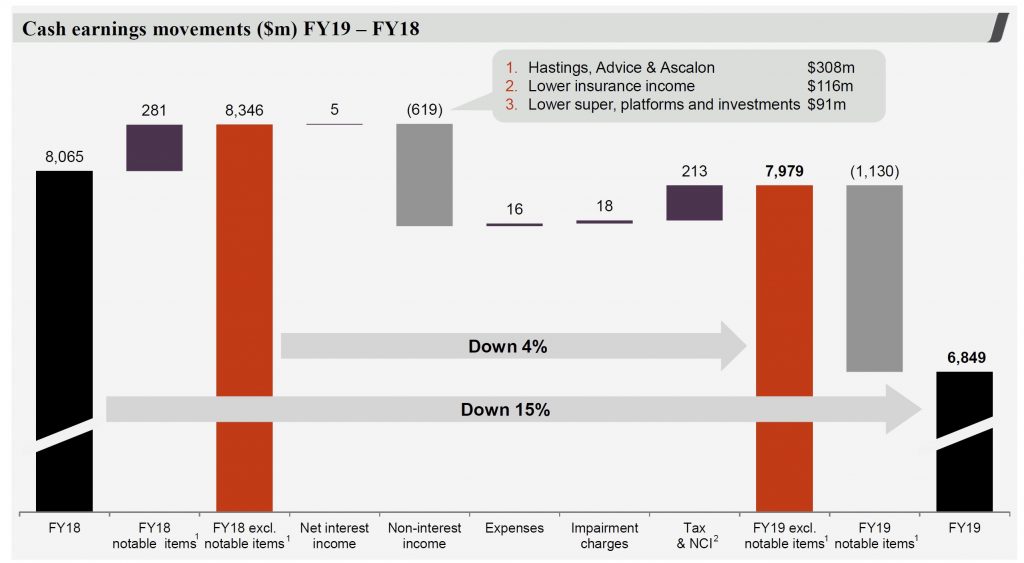
What ever way you look at the 2019 results, out today, Westpac had a bad year in a low growth, low interest rate, high customer remediation environment. Their statutory net profit was $6,784 million, down 16%, while cash earnings were $6,849 million, down 15%.
In FY19 and FY18, the Group raised provisions called “notable items” of $1,130m which relate to Customer remediation Provisions of $958 million (after tax) in FY19, $281 million in FY18.
The majority of the provisions relate to remediation programs for:
Ongoing advice service fees associated with the Group’s salaried financial planners and authorised representatives
Refunds for certain customers that had interest only loans that did not automatically switch, when required, to principal and interest loans
Refunds to certain business customers who were provided with business loans where they should have been provided with loans covered by the National Consumer Credit Protection Act
Other items as part of our get it right, put it right initiative Wealth reset In March 2019, the Group announced its decision to reset its Wealth business. In FY19, provisions for restructuring and transition costs were $241 million (after tax $172 million)
Cash earnings per share was 198.2 cents, down 16%. Westpac’s return on equity (ROE) was 10.75%, down 225 bps. The Final fully franked dividend is 80 cents per share, down 15% from 94 cents per share.
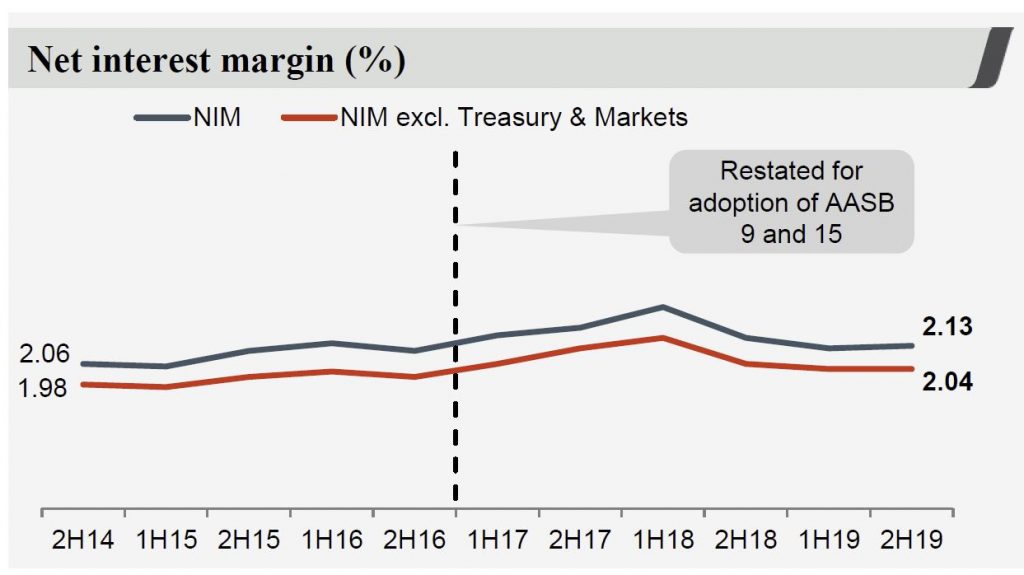
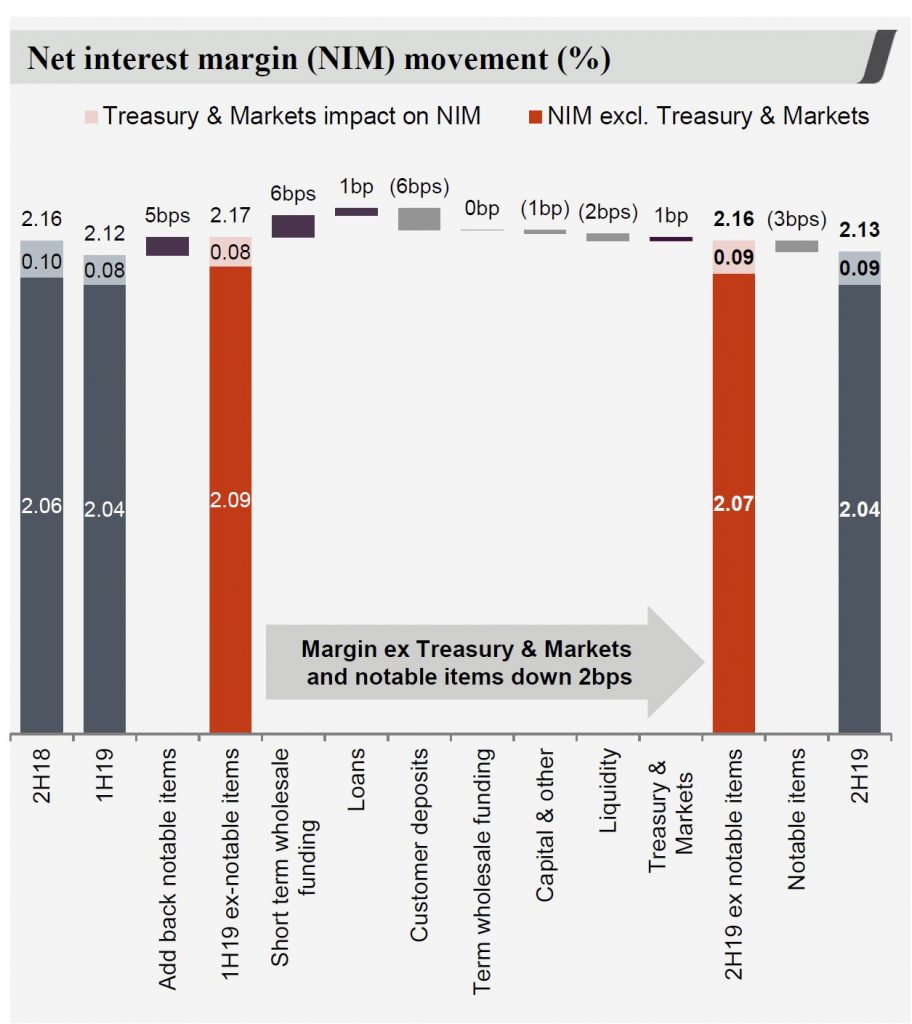
Their net interest margin was 2.12%, down 10 bps
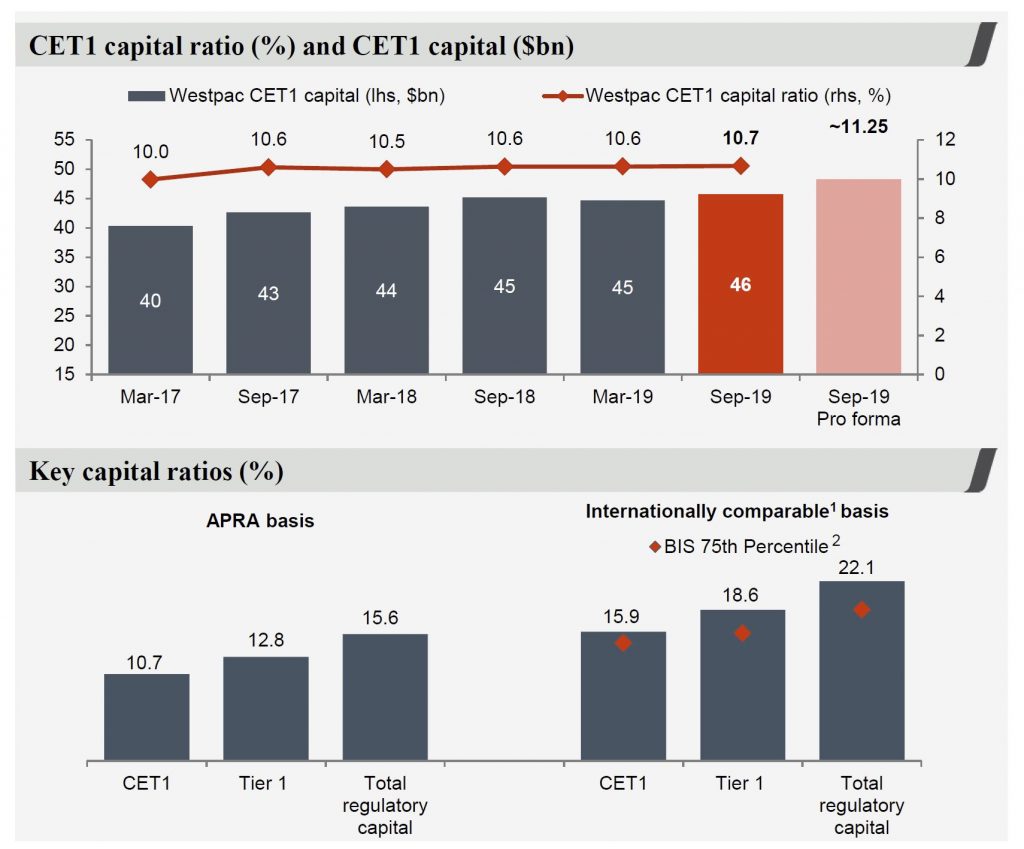
Their common equity Tier 1 (CET1) capital ratio was 10.7%, still above APRA’s unquestionably strong benchmark.
Even if you exclude the “one-offs”, cash earnings were $7,979 million, down 4% and the ROE at 12.52%, is down 94 bps.
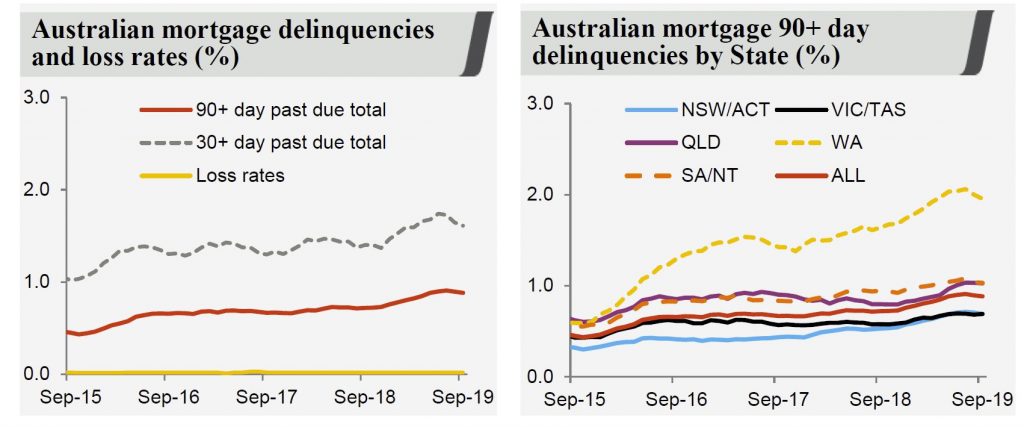
Westpac said credit quality remains sound and impairment charges remain low at 11 basis points of loans. Nevertheless, they have seen a rise in 90 day mortgage delinquencies over the year, in part due to low wage growth and slowing economic activity. A number of factors are evident:
Existing 90+ day borrowers remaining in collections for longer due mainly to weak housing market activity in most of FY19 –
A greater proportion of P&I loans in the portfolio (70% of portfolio at 30 September 2019)
NSW/ACT delinquencies rose 6bps in 2H19 (16bps higher over FY19) to 69bps at 30 September 2019 (NSW/ACT represents 41% of the portfolio)–
Seasoning of the RAMS portfolio, as this portfolio has a higher delinquency profile
70% of Australian home loan customers are ahead on their repayments including offset accounts. Australian properties in possession increased over the year by 162 to 558. Properties in possession continue to be mostly in WA and Qld. Loss rates are 3 basis points. In their “stressed” scenarios losses would rise to ~57 basis points.
They say negative equity remains low based on dynamic calculations using Australian Property Monitors data. Not clear at what level data is applied.
Looking at the segments:
Consumer cash earnings were $3,288, 4% lower due to a decline in non-interest income and increased impairment charges. Mortgage lending increased 1% and deposits rose 2%. Net interest margin was down 3bps due to lower mortgage spreads from increased competition and lower interest only lending.
Business cash earnings were $2,431 and performance was impacted by notable items ($270 million after tax). Excluding these items, cash earnings were $60 million or 2% lower from a reduction in non-interest income and higher regulatory related costs. Deposits rose by 3% over the year. Non-interest income was down 11%, mainly due to provisions as well as lower wealth income from new platform pricing and product mix changes.
Westpac Institutional Bank cash earnings was $1,014. Lower cash earnings were primarily due to a $78 million movement in derivative valuation adjustments, no contribution from Hastings and a $62 million turnaround in impairment charges. (2019 impairment charge of $46 million). In FY18, Hastings contributed $203 million to non-interest income, $158 million to expenses and $29 million to tax.
Westpac New Zealand was the brighter spot, with cash earnings ($NZ) of 1,042 3 (12) Cash earnings growth was supported by a gain on the sale of Paymark and a $10 million impairment benefit. Loans increased 5% with growth evenly spread across mortgage and business lending, while deposits also grew 4%. RBNZ gaave their NZ IRB model the tick today, after 18 months remediation!
The CEO Brian Hartzer said:
We expect system credit growth in the year to September 2020 to lift from 2.7% this year to 3%. That will be largely driven by housing where we expect a lift from 3.1% to 3.5%, although business credit growth is expected to slow somewhat from 3.3% to 3%.
By my calculations, that would not be sufficient to reverse Westpac’s decline.
The latest RBA and APRA stats reveals credit momentum is still slowing, and the full year results from ANZ shows the stresses in the system. And weaker building approvals are not helping either.
Genworth, the Lenders Mortgage Insurer released their third quarter results today. Their statutory net profit after tax (NPAT) in 3Q19 was $25.1 million (3Q18: $19.6 million) and their underlying NPAT2 of $26.5 million (3Q18: $20.4 million).
Genworth said 3Q19 financial performance was “solid” with gross written premium up 24.4% from growth in our traditional lenders mortgage insurance (LMI), driven by increasing volumes in high loan to value lending by our lender customers.
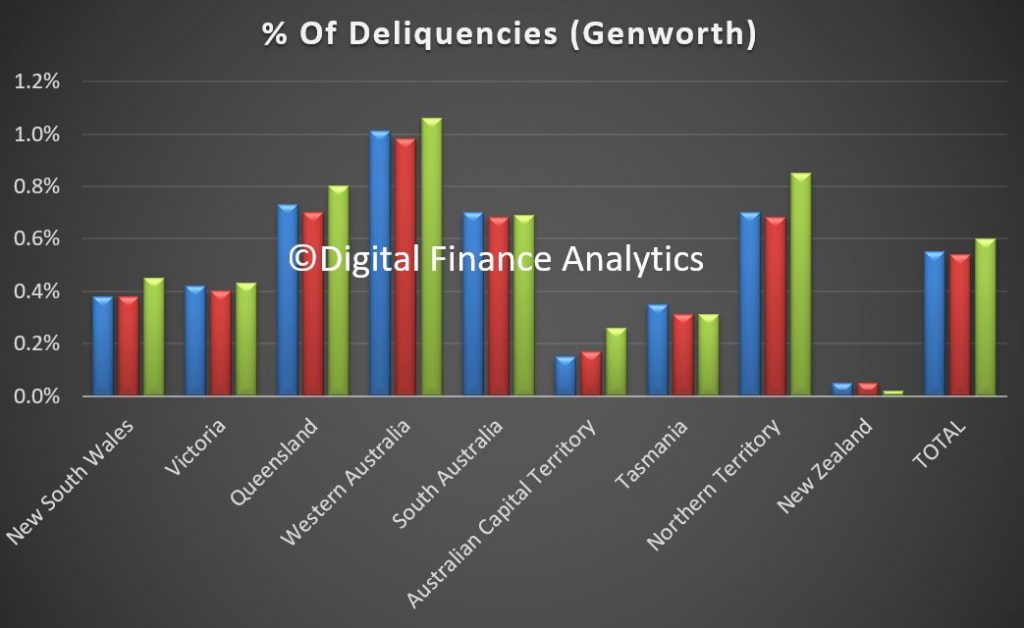
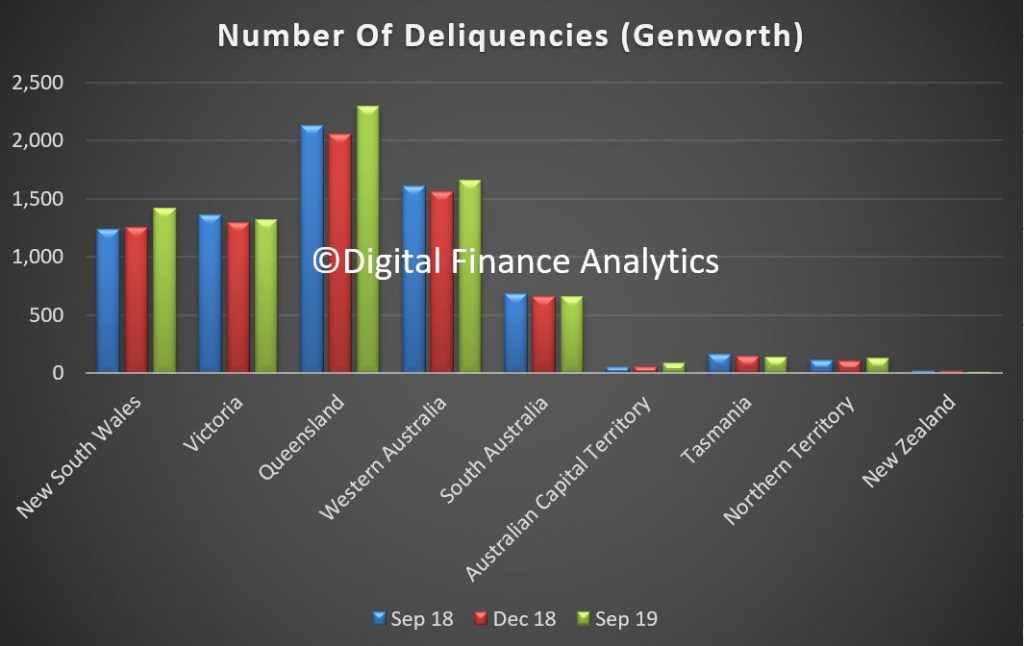
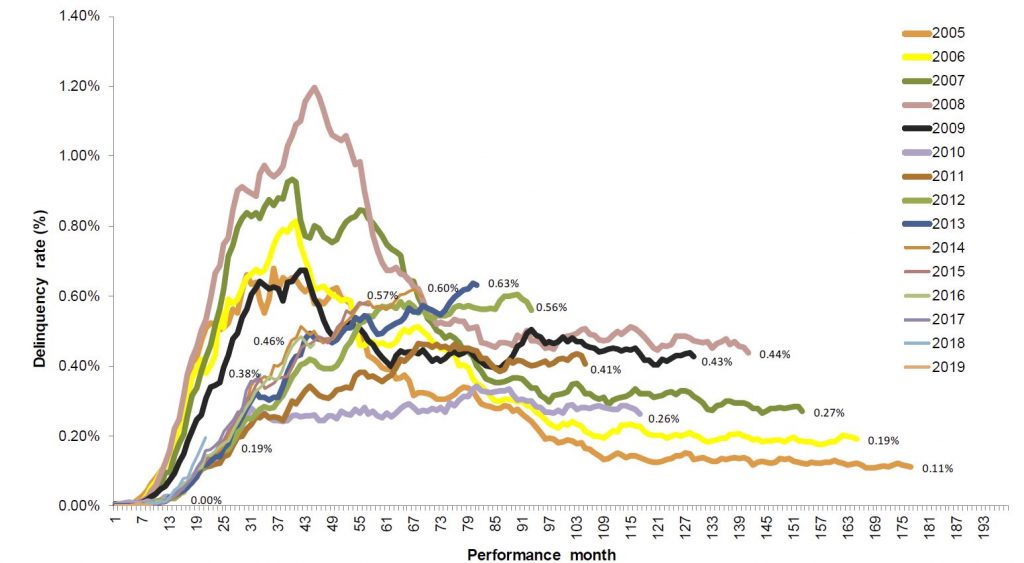
The Delinquency Rate increased from 0.55% in 3Q18 to 0.60% in 3Q19. This was driven primarily by an increase in delinquency rates across most states (particularly in Western Australia, New South Wales and Queensland).
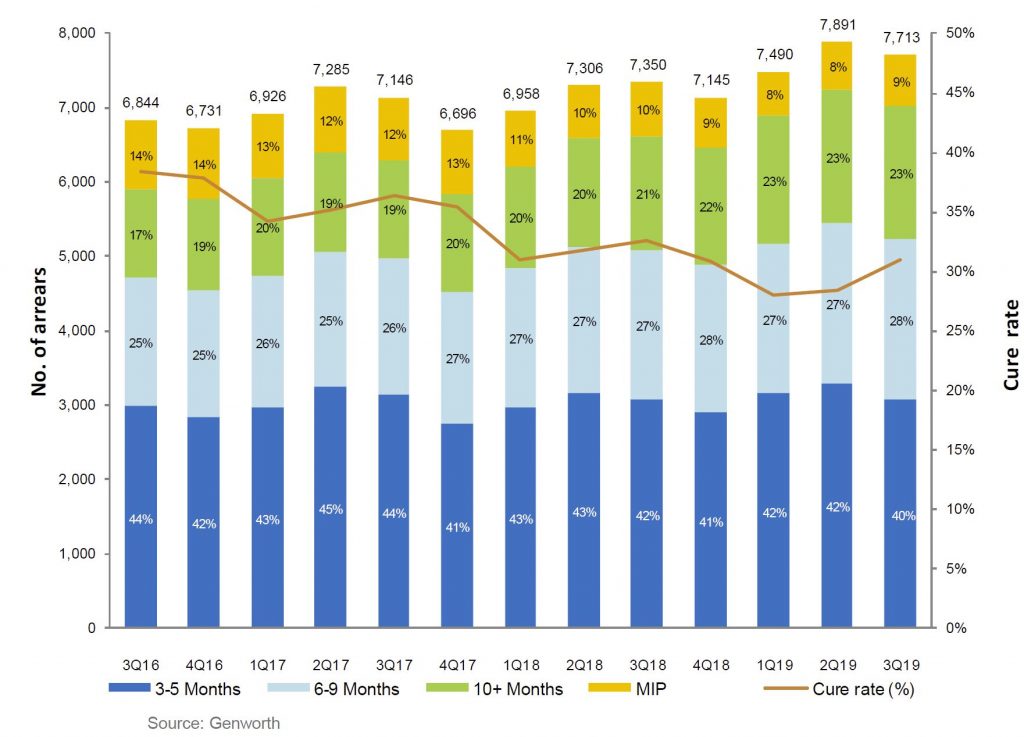
The increase also reflects the continued extended ageing of delinquencies due to slower loss management processing by lenders first called out in FY18. Encouragingly, signs of faster processing by some lenders has emerged this quarter. The Delinquency Rate remained flat between 2Q19 and 3Q19.
New Delinquencies was down slightly (3Q19: 2,622 versus 3Q18: 2,742) and in line with favourable trends usually experienced in the third quarter as new delinquencies reduced from 2,853 in 2Q19. Cures improved from 2,378 in 3Q18 to 2,439 in 3Q19 as lender customers started to emphasise remediation of aging delinquencies. However the cure rate is still lower than back in 2017.
The number of Paid Claims was up (3Q19: 361 versus 3Q18: 320) although the average paid per claim decreased from $115,700 in 3Q18 to $97,900 in 3Q19. This decrease is a result of the stabilisation of mining regions. However, the average paid per claim remains elevated as challenging market conditions remain across areas such as Perth and its specific sub-regions.
The aging also highlights the length of time it takes to get into difficulty, see the peak in loans written back in 2013-14.
Portfolio delinquency performance remained relatively steady quarter on quarter, following seasonal trends. Despite the overall stability, impacts from ageing delinquencies continue, but early signs of faster loss mitigation processing by lenders are emerging.
2006 and prior book years performances were affected by higher proportion of low doc lending which reduced significantly in 2009 following policy changes and decommissioning of the low docs product in the latter part of 2009.
Historical performance of 2008 09 book year was affected by the economic downturn experienced across Australia and heightened stress experienced among self employed borrowers, particularly in Queensland, which has been exacerbated by recent natural disasters.
2010 12 book year delinquencies at lower levels driven by stronger credit policies
Deterioration in 2013 14 book years reflect downturn in mining regions resulting in ongoing economic and housing market challenges.
But the most obvious issue ahead is the rising levels of delinquency in NSW. This will be one to watch in coming quarters, alongside a potential rise in the proportion of high loan to value loans being written now (thanks to the APRA loosening).
Westpac has said its cash earnings for the second half of 2019 will be reduced by $341 million due to customer remediation programs.
The additional provisions put Westpac’s total remediation costs for 2019 at $1.13 billion.
Of
the $341 million impact on cash earnings in the half, approximately 72
per cent relates to customer payments (including interest) while the
rest relates to costs associated with running these remediation
programs.
The larger items over the half related
to provisions associated with financial advice. The majority of new
provisions are related to ongoing advice service fees and changes in how
the time value of money is calculated including extending the forecast
timing over which payments are likely to be made.
Westpac
said the current estimated provision associated with authorised
representatives now represents 32 per cent of the ongoing advice service
fees collected over the period. For salaried planners the estimated
percentage is 26 per cent.
“A key priority in
2019 has been to deal with outstanding remediation issues and refund
customers as quickly as possible,” Westpac CEO Brian Hartzer said.
“The additional provisions announced today are part of that commitment. As part of our ‘get it right put it right’ initiative we are determined to fix these issues and stop these errors occurring. We will continue to review our products and services to ensure they deliver the right outcomes for customers, and if necessary, make further provisions.”
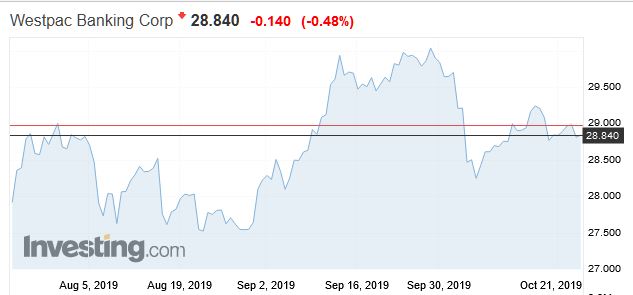
Westpac’s shares were down today, but then most of the major banks were also lower.