Dwelling Approvals Fall in May

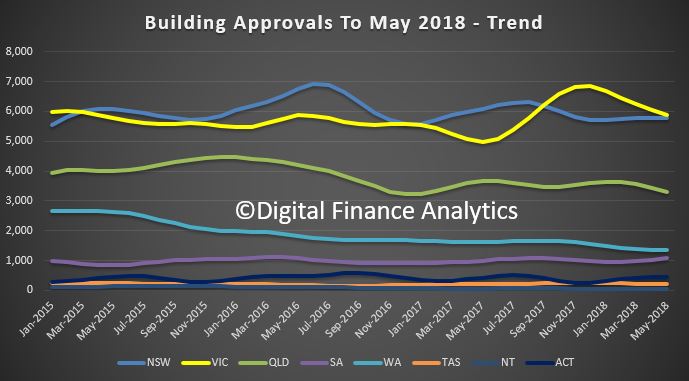
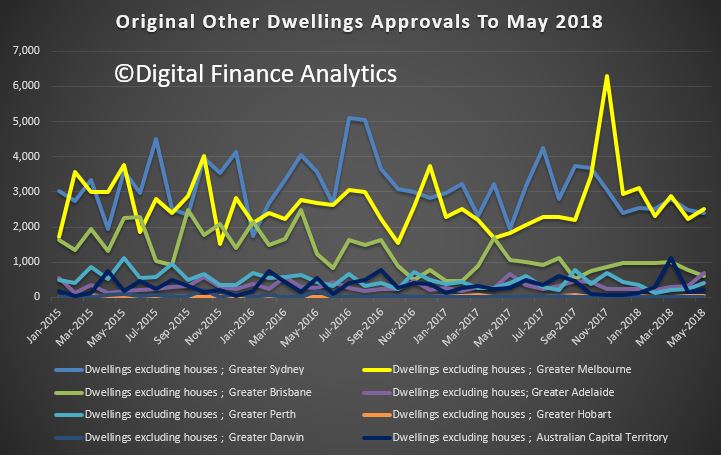
The number of dwellings approved in Australia fell by 1.5 per cent in May 2018 in trend terms, according to data released by the Australian Bureau of Statistics (ABS) today.  At is all about a fall in unit approvals, with a notable decline in Melbourne.  Expect more falls ahead, a further signs of trouble in the housing sector.

“Dwelling approvals have weakened in May, driven by a 2.6 per cent fall in private dwellings excluding houses,” said Justin Lokhorst, Director of Construction Statistics at the ABS.

Among the states and territories, dwelling approvals in May fell in Queensland (4.2 per cent), Victoria (2.7 per cent), Tasmania (2.0 per cent) and Western Australia (0.8 per cent) in trend terms.


Dwelling approvals rose in trend terms in South Australia (4.3 per cent), Northern Territory (2.8 per cent) and Australian Capital Territory (1.5 per cent), and were flat in New South Wales.

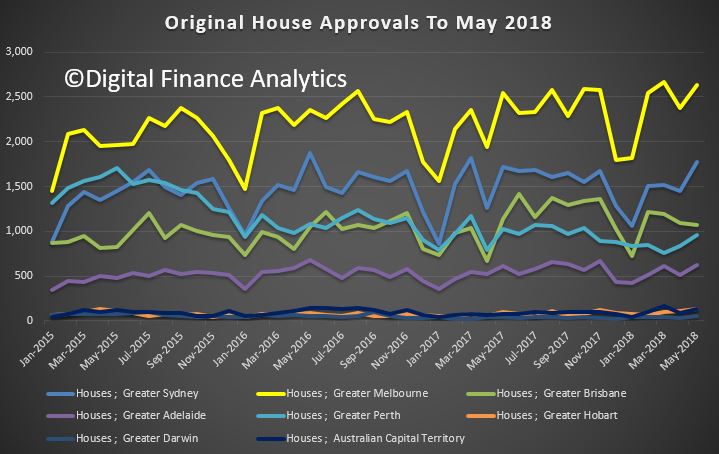
In trend terms, approvals for private sector houses fell 0.5 per cent in May. Private sector house approvals fell in Queensland (1.7 per cent), Western Australia (0.6 per cent), South Australia (0.4 per cent) and New South Wales (0.2 per cent). Private sector house approvals were flat in Victoria.

In seasonally adjusted terms, total dwellings fell by 3.2 per cent in May, driven by a 8.6 per cent decrease in private sector houses. Private sector dwellings excluding houses rose 4.3 per cent in seasonally adjusted terms.

The value of total building approved fell 0.7 per cent in May, in trend terms, and has fallen for seven months. The value of residential building fell 0.8 per cent, while non-residential building fell 0.4 per cent.

The HIA said:

“The market is cooling for a number of reasons including a slowdown in inward migration since July 2017, constraints on investor finance imposed by state and federal governments and falling house prices.

“A slowing in Australia’s population growth since June 2017 coincides with changes to visa requirements announced early last year. Since then Australia has experienced almost a year of slowing population growth.

“Finance has become increasingly difficult to access for home purchasers. Restrictions on lending to investors and rising borrowing costs have seen credit growth squeezed. Falling house prices in metropolitan areas have also contributed to banks tightening their lending conditions which have further constrained the availability of finance.

Denmark introduces state-backed public housing covered bonds, a credit positive

On 1 July, legislation in Denmark took effect that will trigger the inaugural issuance of Danish public housing covered bonds (almene realkreditobligationer) as a new asset class, says Moody’s.

These new covered bonds will be issued out of newly established capital centres with the sole purpose of funding mortgage loans granted to public housing companies (almen boligforening). As is the practice in the Danish covered bond market, assets serving as security for covered bonds must be segregated into independent cover pools, referred to as capital centres in mortgage banks. The Danish government guarantees in full the mortgage loans as well as the public housing covered bonds.

The law is credit positive for potential investors in public housing covered bonds because their credit risk will be lower than in existing mortgage covered bonds. Although investors in both types of covered bonds benefit from recourse to the issuing mortgage bank and a pool of good quality mortgage assets, only public housing covered bonds benefit from a state guarantee in case the issuer fails to fulfil its obligations.

Today, public housing loans benefit from a municipality’s partial guarantee of the loan, but under the new framework such loans will benefit from the federal government’s guarantee covering the full loan amount. In 2017, Danish municipalities guaranteed on average the most risky 62% of mortgage loans. Under the new model, the government will charge a guarantee commission from the mortgage banks. The mortgage banks, owing to the government’s full guarantee, will have lower capital requirements and lower over- collateralisation requirements for the covered bonds that are set in Denmark at 8% of risk-weighted assets.

Denmark’s public housing covered bonds will be issued by mortgage banks via frequently held auctions and tap sales. For the issuance of public housing covered bonds, banks shall obtain bids for purchases from Denmark’s central bank on behalf of the Danish government before the bonds are sold to others, which reduces funding execution risk for the public housing companies and the mortgage banks. According to the Danish central bank, the government will purchase DKK42.5 billion of public-sector covered bonds in 2018, corresponding to the total of new loans and refinancings of existing loans. The government will bid at a rate corresponding to the yield on government bonds.

We expect a quick migration of public housing loans to the newly established capital centres in order to benefit from the government guarantees. This will lead to an increased level of prepayments and refinancings in the existing capital centres. The public housing sector has subsidised loans totalling around DKK180 billion that are largely financed by existing capital centres that issue mortgage covered bonds.

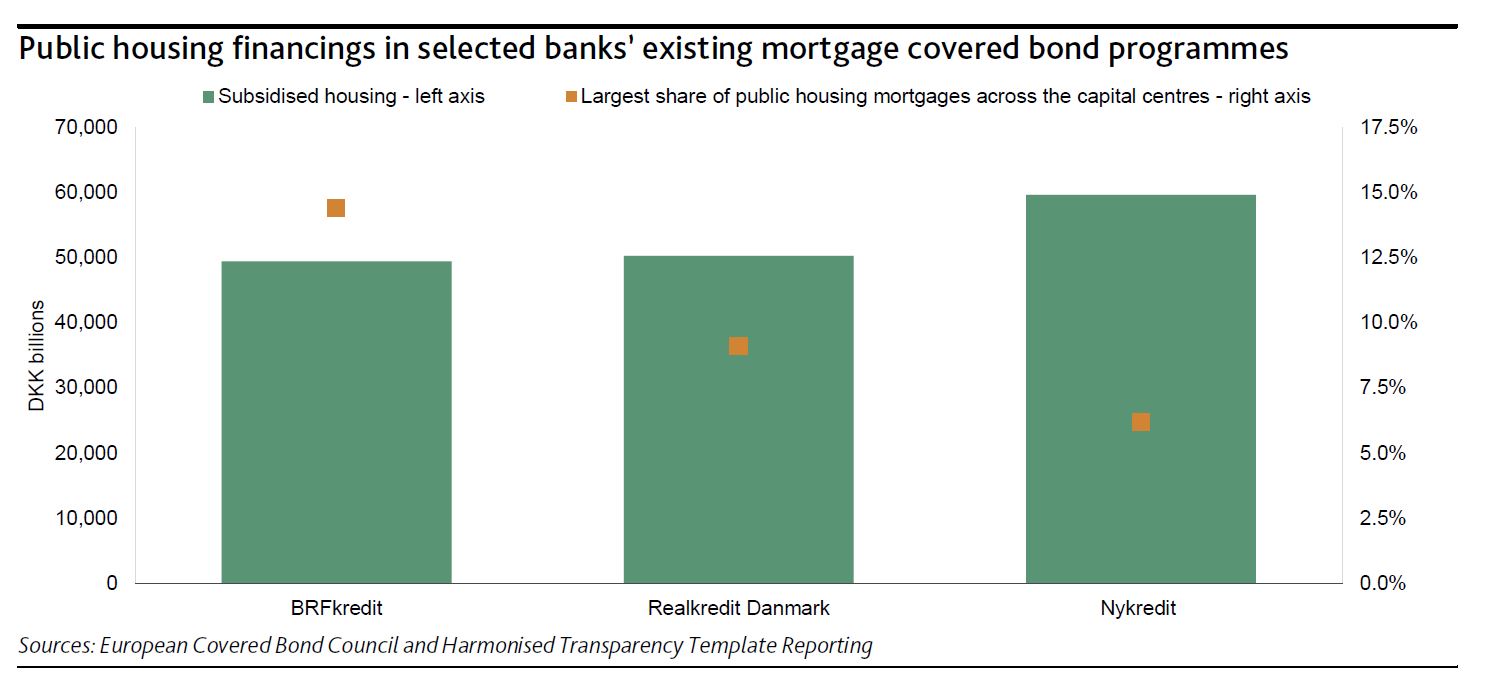
Nykredit Realkredit A/S, Realkredit Danmark A/S (part of Danske Bank) and BRFkredit A/S (part of Jyske Bank) are active lenders in this sector, each currently lending DKK50-DKK60 billion to the public housing sector. Despite the public housing loans being refinanced into the new capital centres, the risk characteristics of the capital centres will not change materially because the share of public housing loans is often small and in active capital centres does not exceed 15% as shown in the exhibit.

Tighter Credit Cramping New Home Sales – HIA

The HIA says their New Home Sales report – a monthly survey of the largest volume home builders in the five largest states – provides an early indication of trends in the residential building industry. The May edition is out, and as expected, tighter credit means fewer sales.  The largest reduction in house sales occurred in New South Wales.

New house sales declined by 4.4 per cent in May and are now 12.8 per cent lower than the most recent cyclical high that occurred in December last year.

“The first half of 2018 has seen a renewed downward trend in new house sales,” said Tim Reardon, HIA’s Principal Economist.

“Access to finance has become the barrier to ongoing growth in home sales.

“The availability of credit has tightened over the past 12 months with banks responding to the decline in house prices and the Banking Royal Commission by limiting lending to new home buyers.

“Australia’s population growth has slowed over the past three quarters in response to tighter visa requirements that have constrained inward migration.

“And for the first time in this cycle we are seeing sales declining in Melbourne.

“The new home market in Melbourne has been exceptionally strong over a number of years and we are now seeing a very modest slow-down in activity.

“While market conditions are slowing in Melbourne, building activity will continue to be solid given the very large volume of work still in the pipeline.

“The impact of the tighter constraints on finance will ease over the year.

“In fact we are expecting detached house starts to rise slightly in 2018 following the 2.8 per cent decline that occurred in 2017.

“Beyond that temporary lift, we expect the downturn in detached house building to properly take root in 2019 – and house sales appear to be providing a very early indication of this occurring,” concluded Mr Reardon.

During May 2018, new house sales declined in all five markets covered by the HIA New Home Sales Report. The largest reduction in house sales occurred in New South Wales (-6.8 per cent) followed by Queensland (-5.0 per cent), Victoria (-4.6 per cent), Western Australia (-2.4 per cent) and South Australia (-0.2 per cent).

New Homes Sales Down In Largest States – HIA

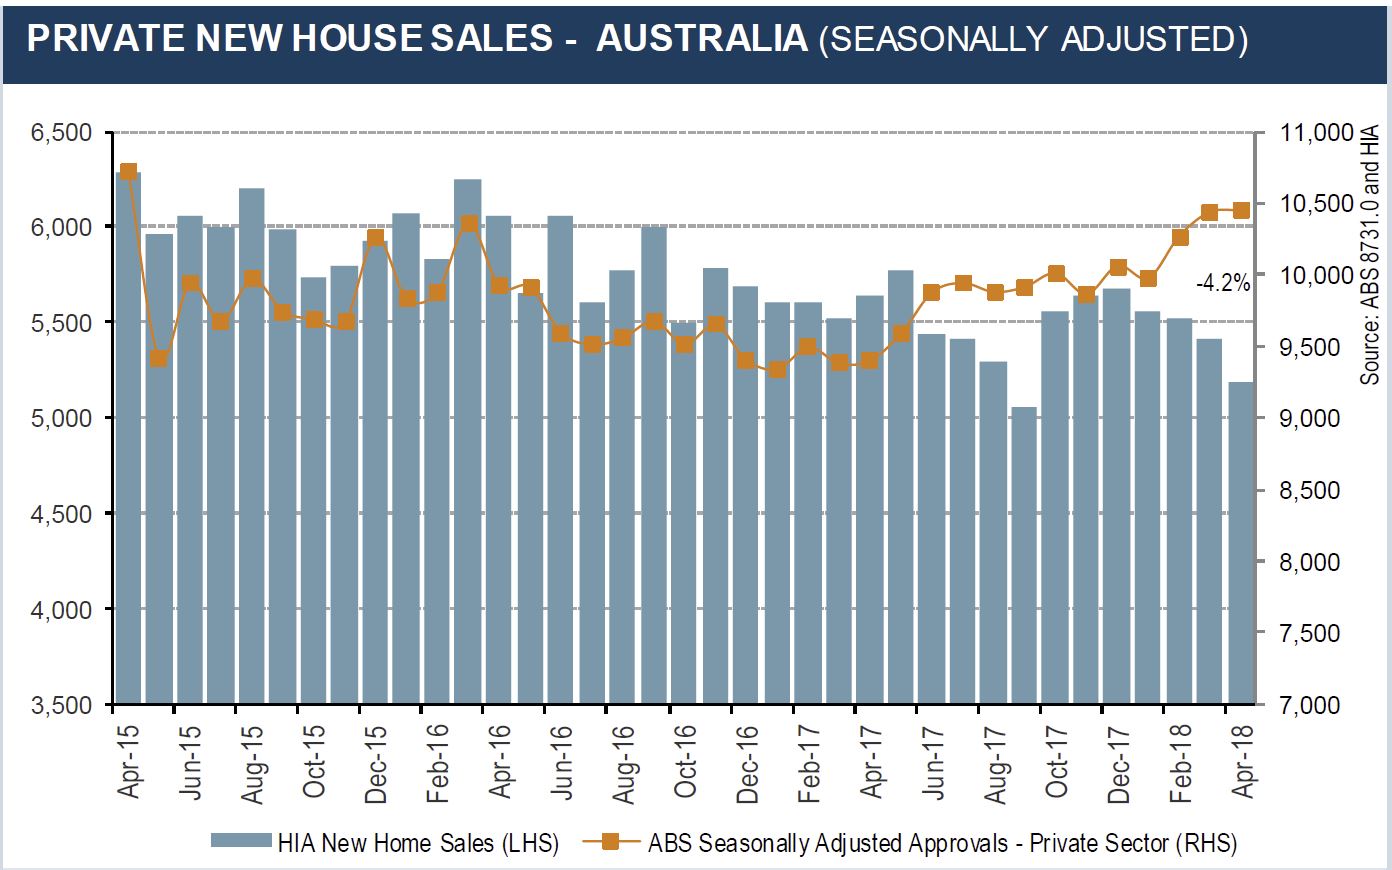
The HIA says new house sales fell in each of Australia’s five largest states during April. Nationally, sales have fallen each month of this year and in April they fell a further 4.2 per cent. New house sales for the year to date are now 3.1 per cent lower, than they were in the same period in 2017.

During April 2018, new house sales declined in all five markets covered by the HIA New Home Sales Report. The largest reduction in house sales occurred in Western Australia (-11.6 per cent) followed by New South Wales (-8.2 per cent), Queensland (-2.9 per cent), South Australia (-1.7 per cent) and Victoria (-0.1 per cent).

New house sales are a leading indicator of new dwelling approvals – and ultimately activity on the ground. New home sales were strong through most of 2017 and the fall back in sales reflects a modest slowdown in demand from both owner occupiers and investors.

There are a number of factors influencing this result. The most recent concern is that access to finance has been constrained as banks exhibit greater caution as house prices fall in key markets. Banks responding to falling house prices by increasing their requirements for collateral is an obvious reaction to the change in house price conditions.

The decline in house prices in Sydney and Melbourne also impacts on the market as more new home purchases are delayed and alternative investments become increasingly attractive.

The second concern is that the Royal Commission into Misconduct in the Banking, Superannuation and Financial Services Industry may lead the banks to be increasingly cautious in lending for residential homes.

Australian banks have significant exposure through loans for the purchase of residential homes and the Royal Commission has highlighted concerns in other aspects of the banking industry. Lending for the purchase of home-ownership is an aspect of the banking industry that is closely monitored by a number of government agencies including the RBA, APRA and departments of treasury. This can be demonstrated through the number of interventions in the residential lending market in recent years.

Indications are that the growth in FHB participation has slowed after strong growth since July 2017. The re-emergence of FHBs is due to enhanced state government supports, the deceleration of dwelling price growth in key markets like Sydney and Melbourne working to make the home purchase more accessible to FHBs. Since January’s 2018 the FHB share has retreated marginally to 17.4 per cent in March. Even so, the number of FHB loans totalled 26,460 during the first three months of 2018, an increase of 28.0 per cent on the same time last year.

This upturn in first home buyer participation has been more than offset by a fall in the value of investor lending. The value of housing loans to investors peaked in August 2017 at $152.7 billion in the preceding 12 months. Since then investor loans have been falling quite steadily to $144.2 billion over the year to March 2018. This represents a reduction of 5.6 per cent on last August’s peak.

These risks need to be balanced against the strong population growth rate, solid employment growth and improving economic activity which is maintaining demand for new homes at elevated levels.


Building Approvals Fell In April 2018

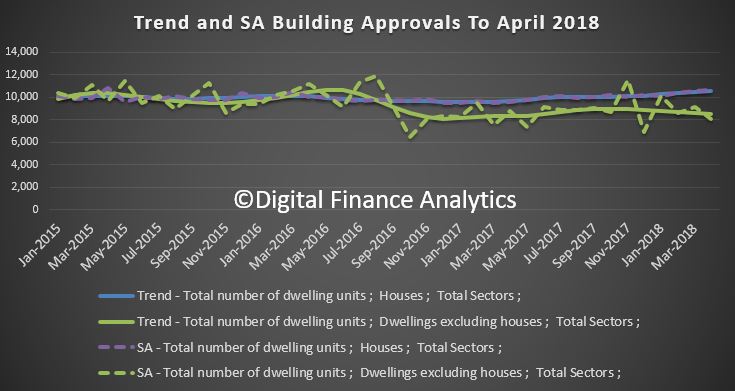
The ABS reports that the number of dwellings approved in Australia fell by 0.1 per cent in April 2018 in trend terms.  We see a fall  in units, somewhat offset by a rise in houses approved. The seasonally adjusted numbers show a more significant drop.

“The total dwellings series has been relatively stable for the past eight months, with around 19,000 dwellings approved per month,” said Justin Lokhorst, Director of Construction Statistics at the ABS.The strength in approvals for houses is being offset by weakness in semi-detached and attached dwelling approvals.”

Among the states and territories, dwelling approvals fell in April in Tasmania (3.7 per cent), Victoria (2.3 per cent) and Western Australia (2.2 per cent) in trend terms.

Dwelling approvals rose in trend terms in the Australian Capital Territory (14.8 per cent), the Northern Territory (6.7 per cent), South Australia (1.7 per cent), New South Wales (0.9 per cent) and Queensland (0.7 per cent).

In trend terms, approvals for private sector houses rose 0.9 per cent in April. Private sector house approvals rose in Queensland (1.6 per cent), Victoria (1.5 per cent) and New South Wales (0.6 per cent), but fell in Western Australia (0.9 per cent) and South Australia (0.4 per cent).

In seasonally adjusted terms, total dwellings fell by 5.0 per cent in April, driven by a 11.5 per cent decrease in private sector dwellings excluding houses. Private sector houses rose 0.1 per cent in seasonally adjusted terms.

The value of total building approved fell 0.7 per cent in April, in trend terms, and has fallen for six months. The value of residential building fell 0.5 per cent while non-residential building fell 1.0 per cent.

The HIA managed to put a positive spin on the results saying “Detached House Approvals Strongest in 15 Years”.

The performance of the detached house building market is remarkable. The volume of house approvals during the three months to April was 9.9 per cent higher than a year ago – a time when it was already elevated,” said Shane Garrett, HIA’s Senior Economist.

Strong demand for new houses is being sustained by healthy rates of population growth – itself a product of robust labour markets in Australia’s largest cities. While it’s a virtuous circle for detached house building at the moment, there are risks on the horizon.

More Weird Initiatives To Drag Buyers Into The Property Market

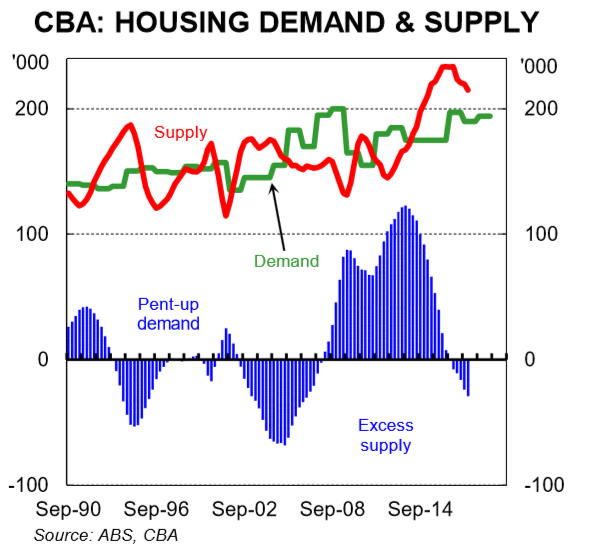
As the property market rotates, and demand slackens, property developers with a stock of newly built, or under construction dwellings – mostly high-rise apartments are trying tactics from deep discounting, cash bribes, or 100% mortgages to persuade people to buy. Remember there are around 200,000 units coming on stream over the next year or two and demand is falling.

Building approvals are also slowing. There is an air of desperation.

So we were interested to see (thanks to a tip off from our community) a WA initiative which was recently announced by Apartments WA – “Backed by the foundations of the BGC Group – Western Australia’s largest residential home builder and largest private company, we make your buying journey a seamless process from finding you the right apartment, assisting with obtaining finance, right through to settlement and key handover”.

They have “invented” the “Preposit”.  In essence a buyer gets to live in a property, whilst saving for a deposit, and when that deposit is accumulated, they can complete a purchase. Its a way to get currently vacant apartments occupied by people who ultimately may buy.   They call it ” the Afterpay© of the real estate industry”.   The weekly payments, would cover the equivalent of rent and saving for a deposit.

Finance is provided by Perth based Harrisdale Pty Ltd trading as The Loan Company. They hold a financial service licence.

There are few details on the Preposit site, and we have no idea of the financial arrangements below the surface. So we suspect any prospective  buyer should ask some hard questions about the overall risks and real effective costs. Remember that they are not an Authorised Depository Institution, so any money “saved” with them for a deposit could be at risk.

I put in a call to the company, who said they would call back to discuss “Preposit”, but they never did!

This is what the sponsored content on rewa says:

A new way of buying has hit the property market, allowing prospective buyers to live in their home, whilst saving for their deposit.

In a unique first for WA, “Preposit” is the Afterpay© of the real estate industry and means you can ‘move in today and pay for it tomorrow’.

The Apartments WA exclusive product allows you to move into an apartment immediately, then begin to make weekly payments that are stored away for you until you’ve saved your deposit.

Apartments WA Sales Manager Chad Toquero said Preposit addresses one of the biggest stumbling blocks in home ownership – the deposit.

“Preposit appeals to all buyers who can afford the loan repayments but are finding it difficult to save for a deposit – there is nothing else like this in the market and Preposit appeals to those looking to buy and those who are currently renting but want to own their own home in the future.”

Apartments WA have also partnered with Loan Co to offer their clients access to a wide range of lenders. As each person’s financial circumstance, and thus borrowing capacity is different, Loan Co will work with each individual to pre-qualify them for a loan upfront. Preposit just allows the buyer to live in the property, while saving for their deposit.

This new way of purchasing is flexible, negotiable and customised to suit the needs of every individual.

Mr Toquero believes Preposit has the potential to make home-ownership become a reality for more people.

“We want Preposit to make home ownership easier for those who want to take advantage of the property market now and their only hurdle is saving for a deposit,” he said.

“The only catch is you have to be able to afford your mortgage repayments and pre-qualify for a loan.

“As long as you can afford the repayments but don’t quite have the deposit right now, we can get you into one of our apartments.”

Here is their FAQ.

What is Preposit ?​
Preposit is a unique initiative created by Apartments WA to help people save for their deposit, whilst being able to live in the apartment at the same time.

So how does it work?
We help you find your dream apartment and then introduce you to our finance experts to work out how much you can afford to borrow. The difference between the purchase price and what you can borrow is the deposit you’ll need to save. Once you receive finance pre-approval to purchase the apartment, we give you the keys to move in and you start saving for your deposit in weekly payments. We then store away these payments away until your deposit amount is achieved, which we give back to you as your deposit toward purchasing the apartment.

Is there a minimum amount required to qualify for Preposit?
No. Everyone’s individual situation is different, and we’ll work through finding the best solution for you.

What properties is Preposit applied to?
We have a range of apartments in selected areas across Perth currently available.

Is this a Government Scheme or Shared Equity?
No. Apartments WA understands that saving for a deposit is one of the biggest hurdles when looking to buy a property. And we want to help.

Sounds too good. What’s the catch?
There’s no catch. You agree to purchase the property upfront, and then get to move in whilst you save for your deposit. Once you’ve reach your deposit amount, you settle on the apartment and then its yours.

How do i know if i eligible?
Complete our enquiry form and we’ll give you a call.

March Building Approvals

The ABS released their building approvals data to end March 2018.

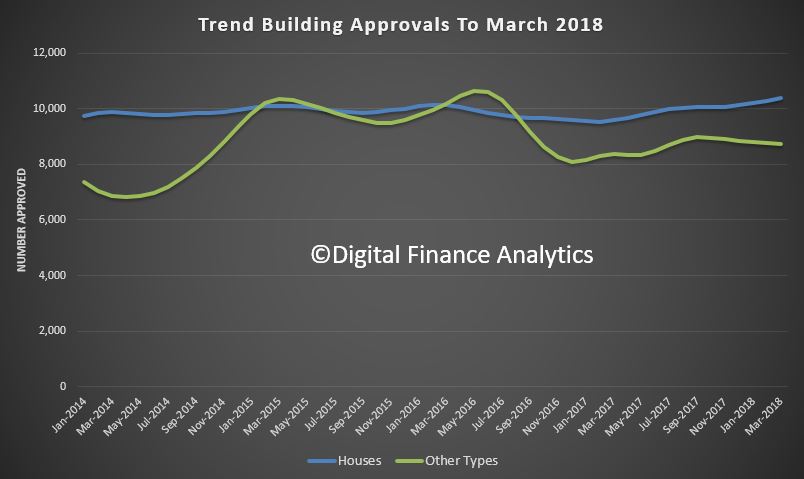
The number of dwellings approved in Australia rose in March 2018 in trend terms, with a 0.2 per cent rise.

This is being driven by approvals for private sector houses, which have now risen for 13 consecutive months. They are now at their highest level since 2003, in trend terms.

Approvals for private sector houses rose 0.8 per cent in March. Private sector house approvals rose in Victoria (1.8 per cent) and Queensland (1.5 per cent), but fell in Western Australia (2.1 per cent) and New South Wales (0.2 per cent). Private house approvals were flat in South Australia.

But units continue to fall, so overall the biggest trend increase in dwelling approvals in March was in the Australian Capital Territory (28.0 per cent), followed by the Northern Territory (5.3 per cent) and Queensland (2.3 per cent).

There were falls in trend terms in Western Australia (6.7 per cent), Tasmania (4.8 per cent), Victoria (0.5 per cent), New South Wales (0.2 per cent) and South Australia (0.1 per cent).

In seasonally adjusted terms, total dwellings rose by 2.6 per cent in March, driven by a 6.1 per cent increase in private sector dwellings excluding houses. Private sector houses rose 1.1 per cent in seasonally adjusted terms.

The value of total building approved fell 0.6 per cent in March, in trend terms, and has fallen for six months. The value of residential building rose 0.4 per cent while non-residential building fell 2.5 per cent.

New House Sales Fall for Third Consecutive Month

The HIA New Home Sales report – a monthly survey of the largest volume home builders in the five largest states – provides an early indication of trends in the residential building industry.

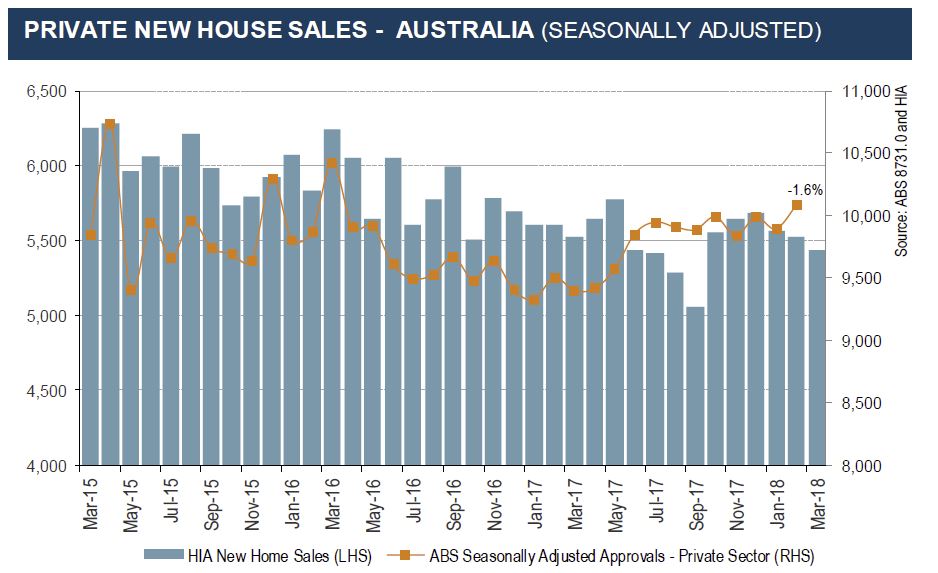
During March 2018, new house sales declined in three of the five markets covered by the report. The largest reduction in house sales occurred in South Australia (-11.4 per cent), followed by NSW (-10.2 per cent) and Victoria (-7.2 per cent). Two states bucked the overall trend, with the largest increase in new house sales in Western Australia (+26.2 per cent) and more measured growth occurring in Queensland (+2.7 per cent).

“Detached house sales fell again in March – meaning that declines have occurred in each of the first three months of 2018,” commented HIA Senior Economist Shane Garrett.

“New detached house sales were down by 2.0 per cent during March following a 0.7 per cent fall in February,” added Mr Garrett.

“The reduction in new house sales in Sydney and Melbourne is likely to be the result of tighter lending policies for investors being imposed by APRA.
“There has been a welcome increase in first home buyers participation which has partially offset the fall in investor involvement in the market.

“Economic recovery is underway in Queensland and WA – and these two states were the only ones to see new house sales rise during March. Detached house building has always been of considerable importance in these two markets.

“HIA’s new house sales index is a leading indicator of activity on the ground. Based on today’s results, new house building activity is likely to move lower on a national basis over the next few months,” concluded Shane Garrett.


Investor retreat is behind apartment downturn – HIA

More data showing the impact of the fleeing of property investors on the property market.  We suspect the decline will continue as credit rules are tightened.

The HIA begs for no further constraints on this sector of the market, but with one third of loans for investment purposes, it is still too high. Remember the Bank of England got twitchy at 16%.

“Investors have been the target of a number of regulatory interventions and we are now seeing this impact on residential building activity,” said HIA Senior Economist, Geordan Murray.

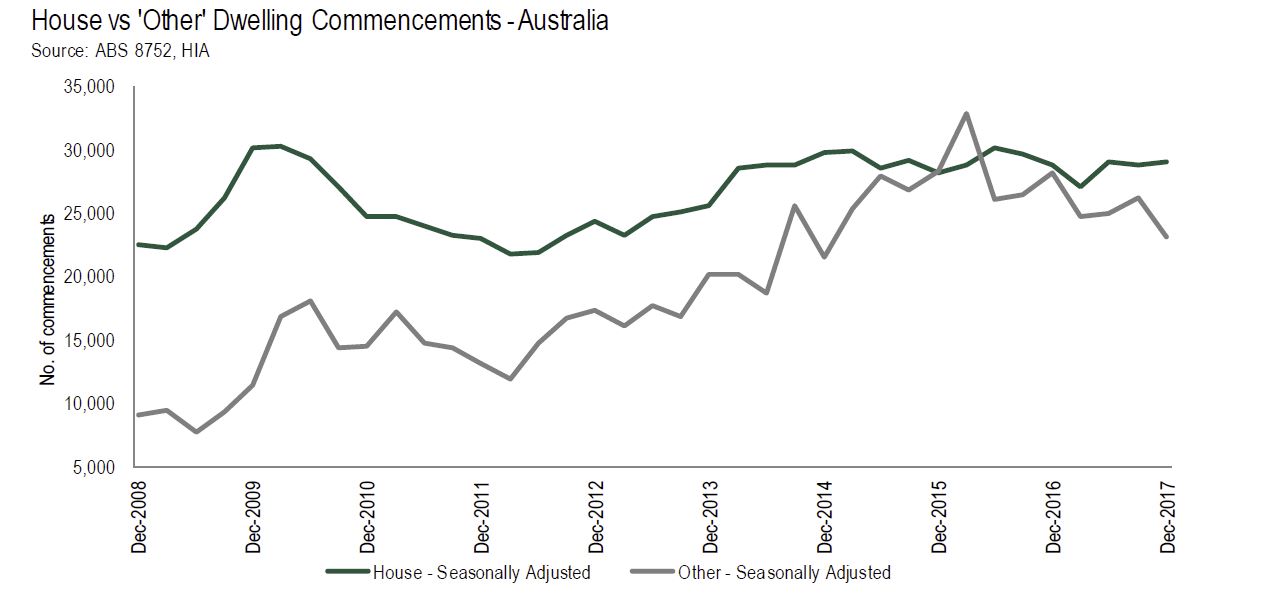
The ABS today released building activity data for the final quarter of 2017. Detached house commencements increased by 0.7 per cent over the December 2017 quarter, while starts for other dwelling types (predominantly apartments) declined by 11.2 per cent.

“The decline in multi-unit dwelling starts has dragged down the total number of new home starts during the final quarter of 2017. The total number of dwellings starts fell by 5.0 per cent in the December 2017 quarter and was down by 8.3 per cent on the level recorded a year earlier,” added Mr Murray.

“In contrast to the decline in multi-unit starts, the resilience of the detached house market continued to shine through. The number of detached house starts during the December quarter of 2017 increased by 0.7 per cent over the quarter and was up by a similar amount compared with the level of a year ago.

“Despite the soft starts result in the quarter, the pipeline of multi-unit activity remains quite large. There were still over 150,000 multi-unit dwellings under construction at the end of the 2017, which is only slightly below the 155,000 level at the peak of the cycle. There are a further 33,800 dwellings in projects that have been approved and are yet to start work, this is a record high.

“The combination of falling commencements and the build-up of dwellings in projects awaiting commencement is somewhat concerning. It is likely to indicate a slowdown in pre-sales activity. New projects will not commence construction until they achieve a satisfactory level of pre-sales.

“Pre-sales to investors, both domestic and from overseas, have been important for many multi-unit developments. With additional taxes on foreign investors and regulators clamping down on investor lending, investors have retreated from the market.

“If we see investors return to the market and the approved projects continue to progress through to work on the ground then residential building work could potentially make a stronger contribution to economic growth this year than we are expecting.

“Now is not the time to impose additional taxes or constraints on investors,” concluded Geordan Murray.

England expects 40% of new housing developments will be affordable, why can’t Australia?

From The Conversation.

Australia has record levels of supply of new properties but despite various government interventions, housing still remains unaffordable for many.

Our study found the government could use more direct methods to deliver homes for people on low and moderate incomes, while leveraging the market. These methods, widespread across the United Kingdom and in major cities of the United States, are known as “inclusionary planning”.

This includes requiring developers to make a financial contribution towards affordable housing, or to dedicate completed dwellings, as part of the development approval process.

We studied the outcomes of inclusionary planning programs in parts of the United States and the United Kingdom, and more recent approaches in South Australia and New South Wales.

What techniques can ensure affordable housing in the mix

“Inclusionary zoning”, a common type of inclusionary planning, was first developed in the United States to counteract land use rules which excluded the lower end of the property market. For example, where rules would only permit large homes on single allotments.

Some states in the US have also adopted “anti-snob” laws. Under these laws, developers whose schemes include affordable housing can bypass local zoning controls, if an area has insufficient affordable housing for those on low and moderate incomes.

More recently, inclusionary planning programs are being used in many US cities in a bid to ensure that transport and infrastructure investment does not price out or displace lower income renters.

There are now more than 500 inclusionary planning schemes operating in municipalities across the US. Some require developers to include affordable housing as part of development in a particular zone (usually a fixed percentage of units or floor space).

For example inclusionary planning programs in the city of San Francisco, California (population of around 830,000) generate around 150–250 affordable units per year (around 12% of the city’s total supply).

Other schemes allow variations to planning rules in return for affordable housing. These variations might permit additional density in certain areas or waive certain requirements that would normally apply or expedite the development assessment process.

Other schemes require financial contributions from developers to offset the impact of a project on affordable housing demand or supply.

These programs provide a way for governments to ensure affordable housing for lower income residents even in rapidly gentrifying neighbourhoods.

How this plays out in England and Scotland

In England and Scotland, the supply of affordable housing is negotiated through the planning process. The general expectation is that 20 to 40% of new housing developments will be affordable. But proportions of affordable housing are allowed to vary on a case by case basis in light of the housing market and the costs of undertaking the development.

The main methods for this in England are section 106 agreements. These agreements, which come under the Town and Country Planning Act 1990, specify the amount and type of affordable housing to be provided as part of a development.

Section 106 agreements have steadily gained traction since the 1990s. Between 2005–16, 83,790 affordable dwellings were secured through these agreements in England. This included 9,640 new dwellings in 2015–16.

Section 106 agreements have resulted in different types of affordable housing, including social housing, discounted home ownership, share equity schemes and affordable rental housing (offered at 20% less rent than for comparable properties in the same local housing market).

Our study found that when inclusionary planning model requirements are predictable and applied in a consistent way, developers accept them because they can factor costs into the price paid for land.

We also found most models work in conjunction with other government funding or subsidies, extending the value of this funding by reducing the cost of land for social or affordable housing.

What usually happens in Australia

Only the South Australia and New South Wales governments have similar types of planning schemes in Australia, although there are signs that other states may follow.

The SA government’s inclusionary planning target, announced in 2005, aims for 15% of significant new housing developments to be affordable.

By 2016 more than 2,000 affordable homes had been built and a further 3,476 homes committed. This amounts to about 17% of new housing supply in South Australia.

In NSW, inclusionary planning schemes only deliver affordable rental housing.

In the mid 1990s an inclusionary zoning scheme pilot was introduced to Pyrmont and Ultimo. This scheme was then extended to Green Square.

These schemes require that developers dedicate 0.8 to 3% of the floor area of developments for affordable housing, or that a monetary contribution be made in lieu of direct affordable housing provision.

However, to date, the NSW state government and many in the development sector have favoured voluntary mechanisms (such as density bonuses for providing affordable housing) over mandatory ones to supply affordable rental housing.

For our study, we estimated the volume of affordable housing delivered through voluntary planning agreements and state policy giving a density bonus for affordable housing inclusion by examining individual development approval records.

We found that voluntary measures have so far delivered about 1,300 dwellings or between 0.5 to 1% of Sydney’s housing supply between 2009 and 2017.

How viable is inclusionary planning?

We found that voluntary planning incentives can encourage affordable housing, but as part of incremental residential development, within the existing planning framework.

However, affordable housing should be mandated when land is rezoned for residential development, when planning rules are varied for particular projects, or following major infrastructure investment.

Inclusionary planning can’t replace government funding in providing housing for those on the lowest incomes. However, inclusionary planning schemes can reduce land costs and ensure that affordable homes are well located near jobs and services.

Authors: Nicole Gurran, Professor of Urban and Regional Planning, University of Sydney; Catherine Gilbert, Research Assistant and PhD Candidate, Urban Housing Lab, University of Sydney