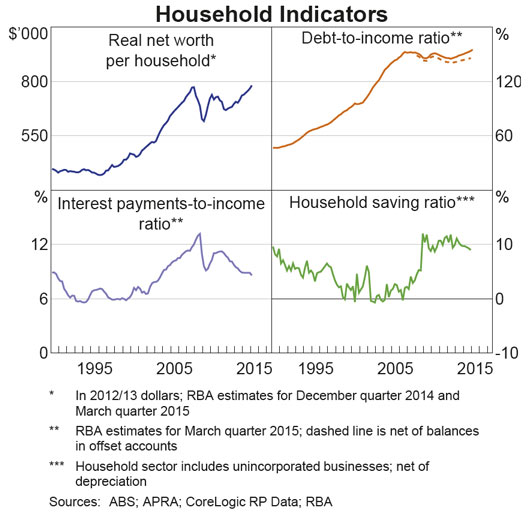
One of the arguments often used to disprove any issues in the housing market is the fact that some households are paying well ahead of required repayments. For example in the recent RBA Bank Stability Report, they say “Outside of investor housing, household sector finances are currently less cause for concern. Household credit growth has remained moderate, because new lending for purposes other than investor housing has been more subdued and because existing borrowers are taking advantage of low interest rates to pay down debt more quickly than contractually required. The aggregate mortgage buffer – as measured by balances in offset and redraw facilities – has risen to almost 16 per cent of outstanding loan balances (more than two years’ worth of scheduled repayments at current interest rates). “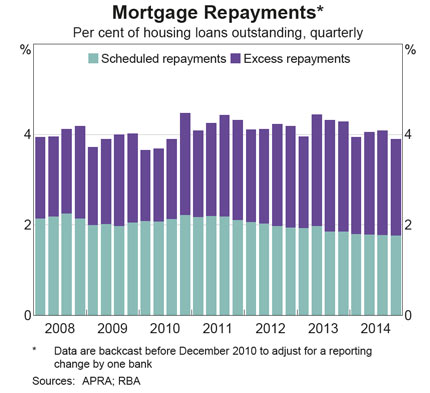 “More broadly, households continue to save a greater share of their income than in the decade or so prior to the financial crisis. Households’ ability to meet interest payments on their loans is being aided by the low level of interest rates. However, while the debt-to-income ratio has been relatively stable over the past decade or so, especially once balances in offset accounts are netted off, it is high relative to its longer-run history.”
 In contrast, last year, Fitch Ratings played down the extent to which Australian home owners are rushing to pay back their banks, saying the average increase in voluntary home loan repayments has been modest and not changed in recent years. They found the average borrower is paying about 1.5 to 2 per cent more of their mortgage. The Fitch report, did confirm borrowers were ahead, but found the size of voluntary repayments was ”surprisingly low”. It also said high saving was not the main reason loans were being paid down quickly. Instead, it said the early repayment of debt had more to do with refinancing by borrowers and redraw products, which allow people to borrow more than they needed and treat their mortgage as a low-cost line of credit.
Or again, last year, the Australian reported that some 85 per cent of NAB’s home loan accounts are now ahead on mortgage repayments — by an average of 13 months versus an average of 12 months in 2012 — as customers buoyed by low interest rates pay down debt faster. Of the home loan accounts that are ahead on mortgage repayments, 70 per cent are owner-occupiers, 16 per cent are investors and 14 per cent are first-homebuyers. The majority are aged between 40 and 49 (31 per cent), with the bulk of the remainder evenly split between the 30-39 and 50-59 age groups (25 per cent each).
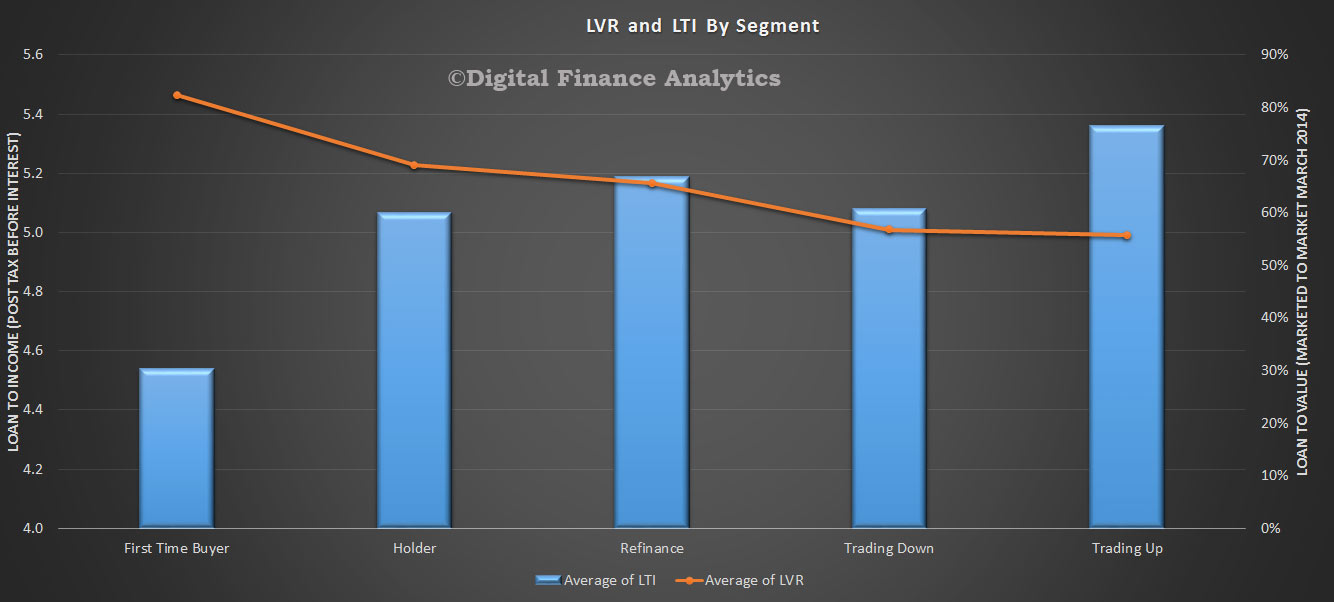
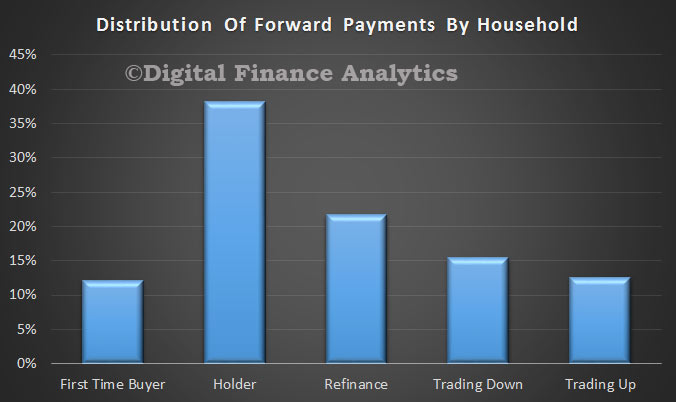
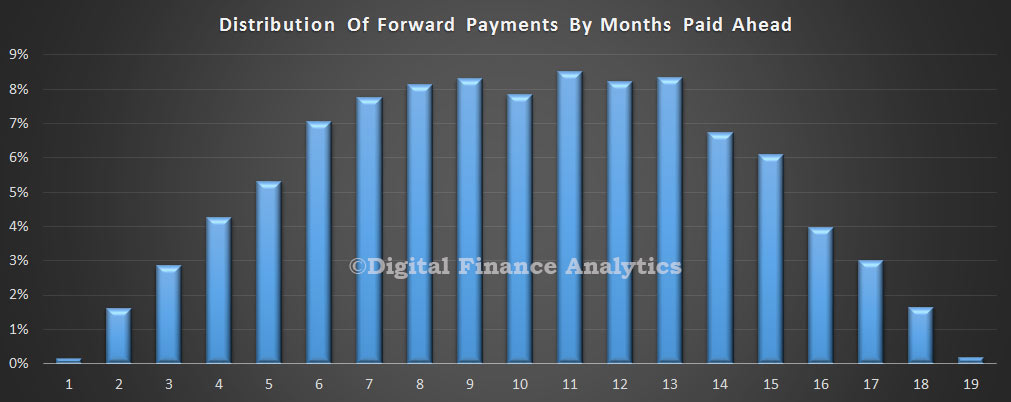
So does the aggregate data as cited by the RBA really shows the true state of play? Not all loans have redraw and offset facilities. When interest rates fall, are repayments automatically adjusted? So which households are paying ahead? How far ahead are they? To answer these questions we used data from our market model and today outline some of the key findings. The net result shows that whilst some households are ahead, and some well ahead, it is concentrated in specific parts of the mortgage book. It should be said, it is a predominately owner occupied mortgage phenomenon. Within in the DFA segments, the bulk of households who are ahead are classified as holders. These are households with no plans to switch properties or refinance. Many have left monthly repayments at levels aligned with higher rates, and have allowed repayments to run on at higher than needed to meet current repayments. A significant proportion of these households have redraw facilities, meaning they could lift their borrowing if the wanted to.
 Looking at the age of the primary household member, we see there are periods when households are more able to repay ahead. Late twenties, when children have yet to arrive, or later thirties when both parents are more able to work and so lift income. We see a fall off in later life.
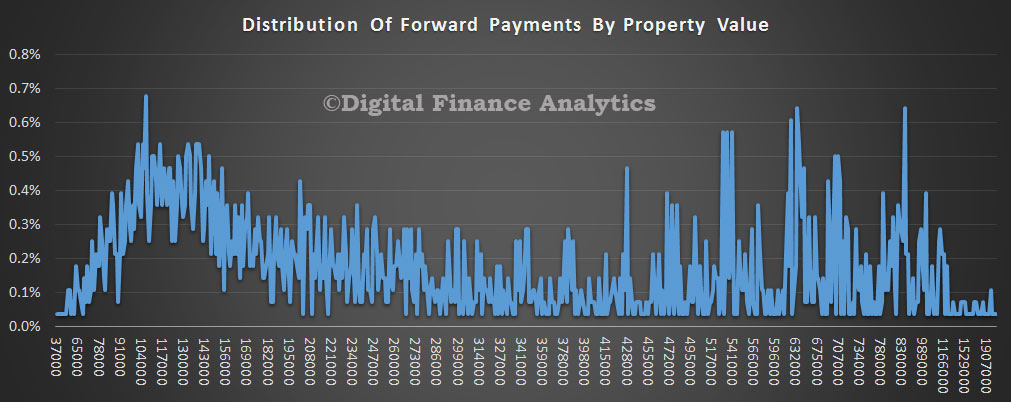
 The value of the property itself is not a very good predictor of whether a household will be paying ahead, though we see a greater distribution at lower property values.
 Households with smaller outstanding balances are significantly more likely to be paying ahead, compared with larger loan balances.
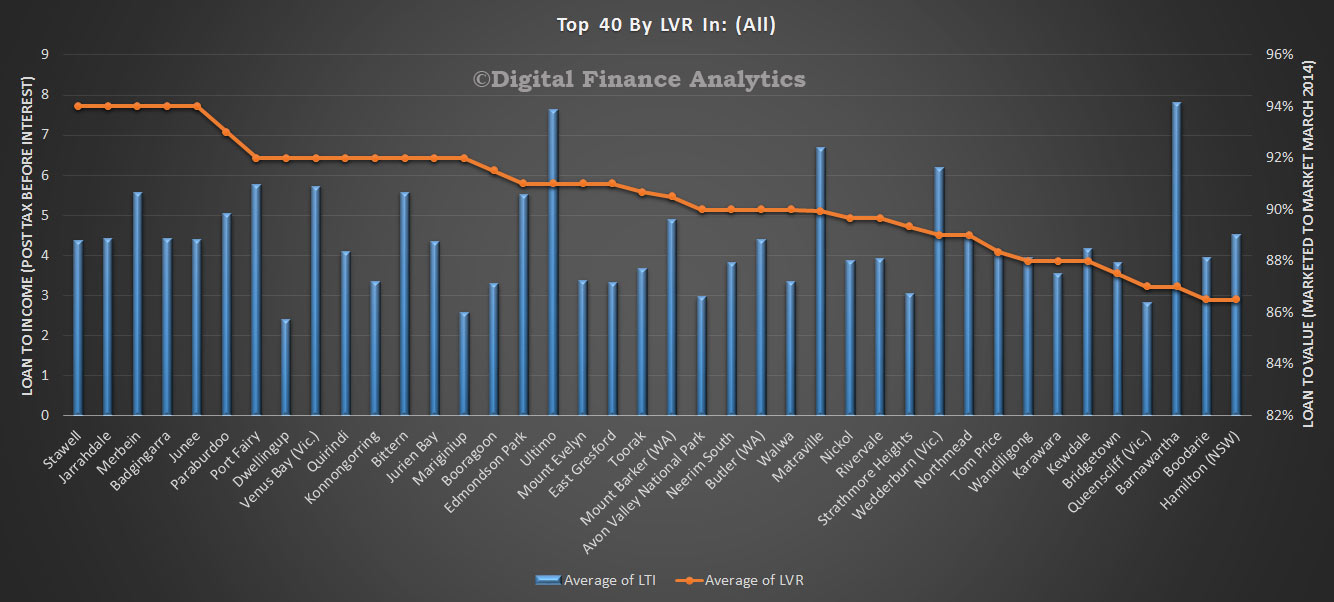
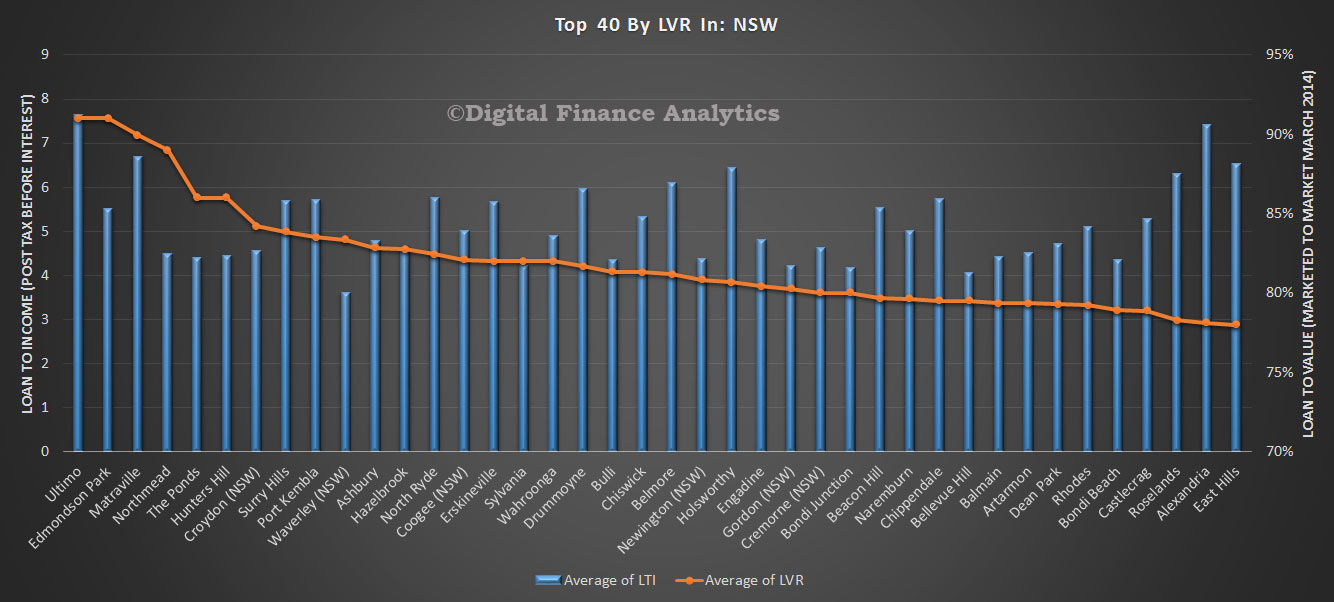
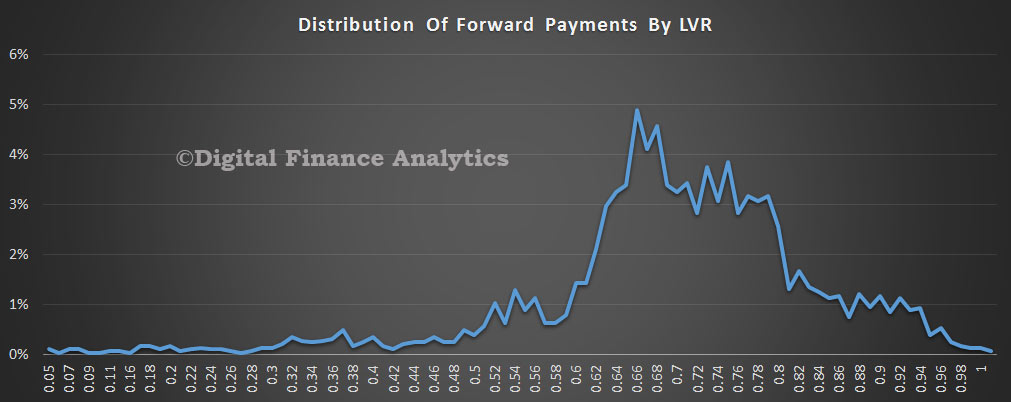
 Households with a high LVR (Loan to Value Ratio) are much less likely to forward pay.
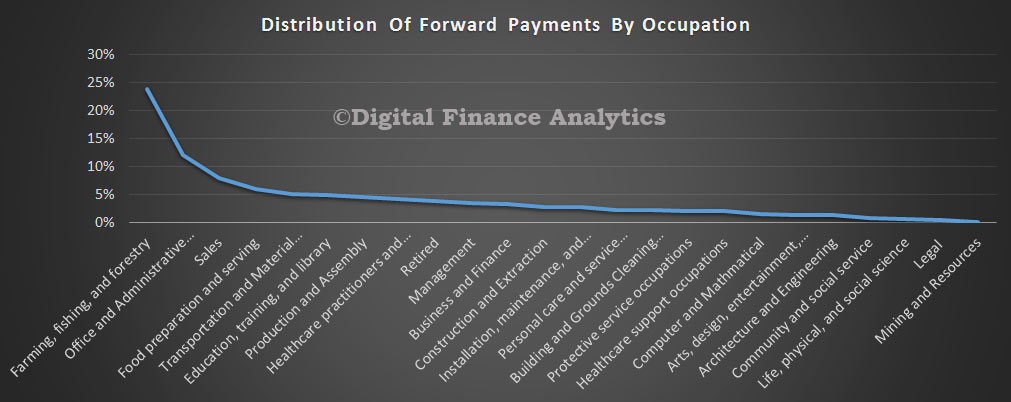
Some occupations are more likely to be ahead, including those working in the agribusiness sector, office and administration and sales.Those in mining, and legal professions and social sciences are least likely to be ahead.
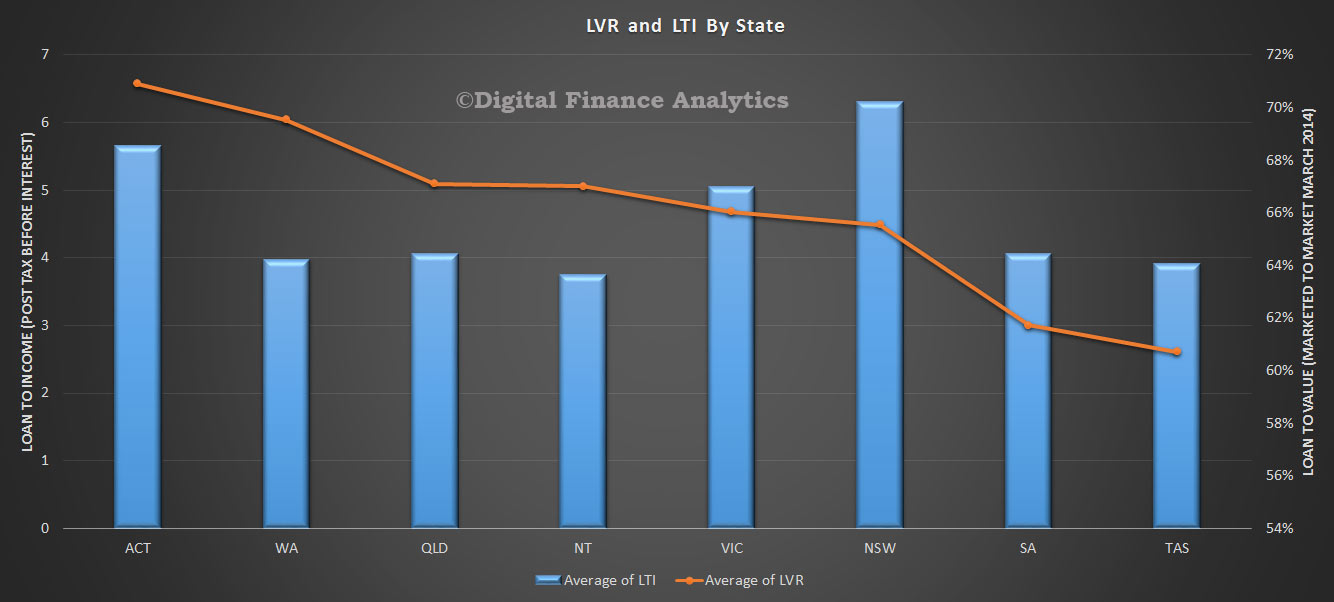
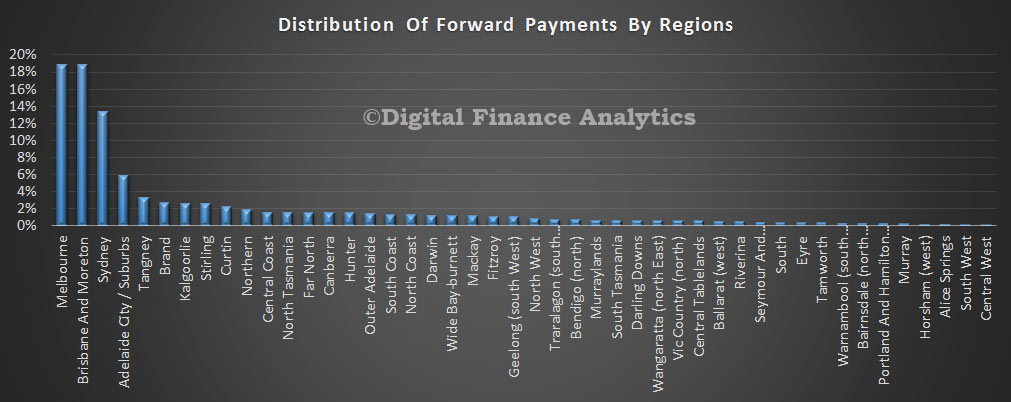
 The geographic footprint is interesting, with households in the Melbourne region the most likely to be paying ahead, then Brisbane, whilst a lower relative proportion in located in the Sydney region. Households in WA are less likely to be paying ahead, whilst relatively, those in Canberra are more likely to be paying above the minimum.
 The top 10 pay ahead post codes in NSW are Dubbo, Naremburn, Greystanes, Baulkham Hills, Earlwood, Leumeah, Woollahra, Cronulla, Narrabeen, and Castle Hill. In VIC, Cranbourne, Tarneit, Derrimut, Wheelers Hill, Northcote, Malvern, Langwarrin, Kennington, Bundoora and Greensborough. In QLD Mount Pleasant, Harristown, Caboolture, Benowa, Basin Pocket, Millbank, Buderim, Geebung, Coral Sea, and Brighton. In WA Tapping, Canning Vale, Success, Currambine, Wonthella, South Perth, Morley, Huntingdale, Midland and Lamington.
At current interest rate levels, the average coverage is about eleven months, though some have even more in the bank.
 So, the conclusion is that the households who are paying ahead have smaller mortgages, lower LVRs live in more established suburbs and are under less financial pressure. However, do not be deceived, there are significant numbers of household with high LVRs and LTI’s and no hope of paying forward. We showed that in our previous post. You cannot make a compelling case for saying the housing sector is fine on the back of paying ahead data. It is too myopic.

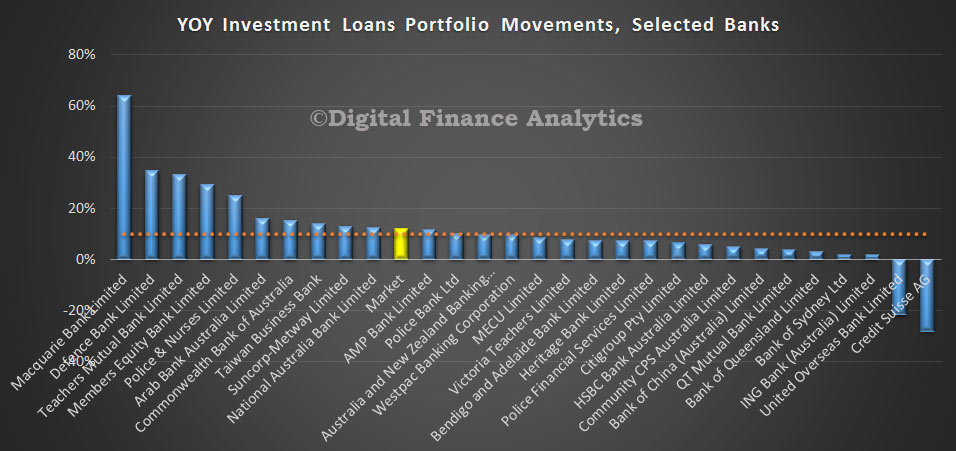
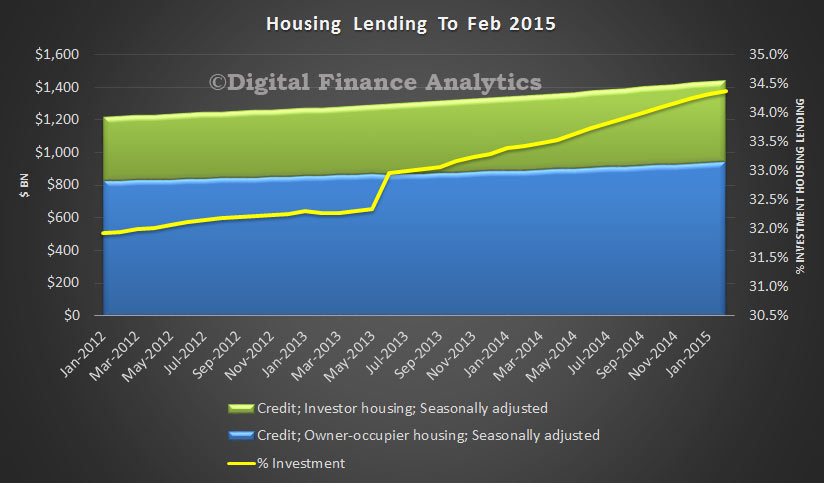 Whilst business lending rose in the month by 0.64% and makes an annual growth rate of 5.6%, the ratio of housing investment loans to business lending continued to widen, it is now 62.7%. Personal credit fell slightly, down by 0.3% making a 12 month rate of 0.5%.
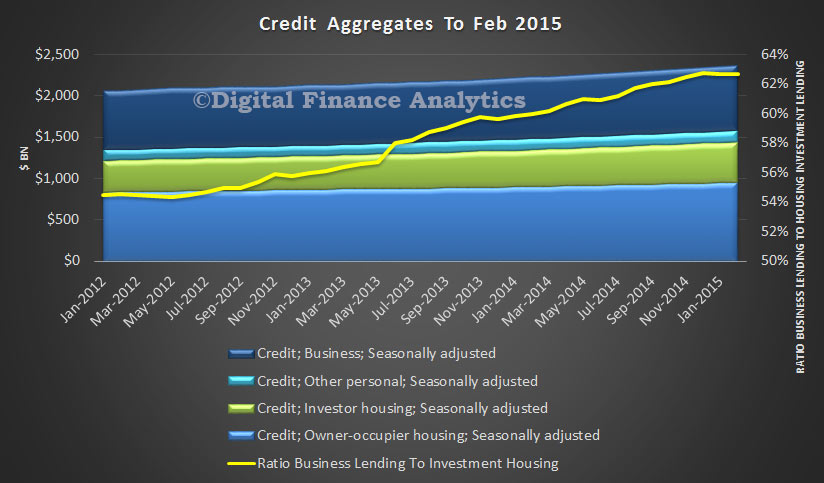 The volume of investment loans driven by high demand from a range of household sectors continues to crowd out productive business lending, and fuels rising household debt, higher house prices and larger bank balance sheets. Lowering interest rates further will not help the position, but given lower than planned growth, we expect further cuts. This element which is missing in action is a proper approach to macroprudential controls. New Zealand have signalled a potential path.