Total Housing Lending Now Worth $1.4 Trillion

The RBA financial aggregates, released today, highlight the continued growth in housing lending. The overall summary is shown below:

RBA-Aggregates-Sept-2014

Looking in detail at the housing numbers, owner occupied lending reached $923.1 billion (up 0.46% from the previous month, or $4.2 billion), whereas investment lending reached $475.1 billion (up 0.85% or $4.0 billion). Investment loans now comprise 33.98% of total housing lending, another record. This underscores RBA’s concerns as we highlighted before.

HousingLendingSep2014Total housing lending is now $1.398 trillion, of which, according to APRA $1.288 trillion is from the ADI’s, the balance of $110 billion is from the non-bank sector, and recorded no change (though there are some data issues here).

Monthly Banking Statistics For September Shows Investment Loans Still Running

APRA just released their data for September 2014. This provides a breakdown of balances outstanding by financial institution across the main lines of business. This only includes players within their bailiwick.

Looking at home loans first, total balances rose from $1.28 to $1.288 trillion, with investment loans rising by 0.85% to $446.3 billion, and owner occupied loans by 0.44% to $841.1 billion. So investment lending forged ahead, again.

Looking at the relative shares, we see CBA with 27.2% of the owner occupied market, and Westpac with 31.9% of the investment home loan market. Together the two Sydney-based players dominate.

HomeLoanSharesSept2014We see that Bank of Queensland and Westpac have relatively the largest share of investment loans in their loan portfolios.

HomeLoanBalancesSept2014Looking at the month on month movements, we see the most significant movements in investment loans at Westpac and CBA. We also see Macquarie active on the investment loan front, wth a growth of 3.8% month on month, they grew their investment book the fastest. Macquarie also grew their owner occupied loan portfolio the fastest, at 2.7%.

HomeLoanMovementsSept2014Turning to deposits, total balances were up 1.03% month on month, to a total of $1.77 trillion. Looking at the individual players, CBA and WBC have dominant positions.

DepositSharesSept2014In relative terms, HSBC (3.2%) and CBA (2.3%) grew balances the fastest, Bank of Queensland and Rabobank both lost balances.

DepositMoveentsSept2014Switching to Credit Cards, balances fell slightly in the month, at $40.2 billion. There is little change in the individual portfolios amongst the big four and Citigroup.

CreditCardBalancesSept2014


CreditCardSharesSept2014

ANZ Lifts Profit 10%

In a contrast to Nab yesterday, ANZ’s full year results today are striking. In the year to September 30, ANZ delivered a cash profit of $7.12 billion which is a 10 per cent increase on last year’s result. This is in line with forecasts. Full-year net profit increased 15 per cent to $7.27bn, while operating income rose 8 per cent to $20.054bn. The net interest margin fell slightly, to 2.13 per cent, from 2.22 per cent, reflecting strong competition for loans.

Cash profit from Asia increased 25 per cent and revenue by 10 per cent in the full-year. The bank’s international business in Asia Pacific, Europe and America now accounts for 24 per cent of group revenues. Cash profits in those areas increased 20 per cent to $1.2bn. In contrast, the Australian region’s cash profit was up one per cent at $4.4bn.ANZ-Results2014

Nab’s Long Winding Road Home

Nab released full year results to September 2014 today. From the ASX announcement we see:

Cash earnings declined to $5.18 billion, which is 9.8% below the September 2013 full year due to earnings adjustments announced on 9 October 2014 relating to UK conduct provisions, capitalised software impairment, deferred tax asset provisions and R&D tax policy change totalling $1.5 billion after tax for the 30 September 2014 full year.

Excluding the impact of changes in foreign exchange rates, actual revenue declined 1.1%. After exchange rate adjustments, revenue increased by approximately 1.9% with higher lending balances, partly offset by a lower net interest margin (NIM) and weaker Markets and Treasury income.

Expenses rose 0.7 % excluding the impact of changes in foreign exchange rates and one-off adjustments. Adding in the impact of higher UK conduct provisions, capitalised software impairment and R&D tax policy change expenses rose 21%. Excluding these items and prior period UK conduct charges relating to PPI and IRHP, expenses rose 4.5% over the year.

Improved asset quality and deliberate portfolio choices made over recent years have resulted in a total charge to provide for bad and doubtful debts (B&DDs) for the year of $877 million, down 54.7% on 30 September 2013 due primarily to lower charges in Australian Banking and NAB UK CRE (Corporate Real Estate). The charge includes a $50 million release from the Group economic cycle adjustment and $99 million release from the NAB UK CRE overlay

The Group maintains a well diversified funding profile and has raised approximately $28.2 billion of term wholesale funding (including $7 billion secured funding) in the 2014 financial year. The weighted average term to maturity of the funds raised by the Group over the 2014 financial year was 5.1 years. The stable funding index was 90.4% at 30 September 2014, a 1.2 percentage point increase on 30 September 2013.

The Group’s Basel III Common Equity Tier 1 (CET1) ratio was 8.63 % as at 30 September 2014, an increase of 20 basis points from 30 September 2013 and broadly stable compared to 31 March 2014. As announced in the March 2014 half year results, the Group will target a CET1 ratio of 8.75% – 9.25% from 1 January 2016, based on current regulatory requirements.

The final dividend has been maintained at 99 cents, fully franked, and a dividend reinvestment plan (DRP) discount of 1.5% will be offered with no participation limit. NAB has entered into an agreement to have the DRP on the final dividend partially underwritten to an amount of $800 million over and above the expected participation in the DRP. Assuming a DRP participation rate of 35%, these initiatives will provide an expected increase in share capital of approximately $1.6 billion, which is equivalent to a 44 basis point increase in NAB’s CET1 ratio.

DFA believes the challenge for the bank is to get their Australian franchise to fire consistently, leveraging their footprint in home lending, business banking and wealth management. This will be a long and hard journey because it will be a question of excellence in execution, effective customer segmentation, and the removal of toxic customer servicing experiences, enabled by continued technology investment. We would also expect to see a continued withdrawal from the overseas ventures, which consistently underperformed.  Overall, we believe NAB will become ever more reliant on the local Australian and New Zealand businesses, and that the long winding road of offshore investments will lead to further divestments. The truth is that the big four have a natural advantage in their home markets (high margins, benign competition and gentle regulation) and Australian banks find it very hard to perform consistently in the high-competition markets of the UK and USA. But Nab will have to work hard to break the cultural, process and systems barriers which beset the bank.

Finally, a release in provisions made a significant positive contribution this time around, but will not always be available.

nabtrendpriceChart source ASX.

ASIC’s Annual Report Tabled

ASIC’s annual report for the 2013–14 financial year was tabled on Wednesday 29 October 2014 in the Australian Parliament. Its 185 pages highlights the broad range of issues ASIC covers, and connects back to their earlier strategy release. DFA found some interesting nuggets of information in the 6 year trends table.

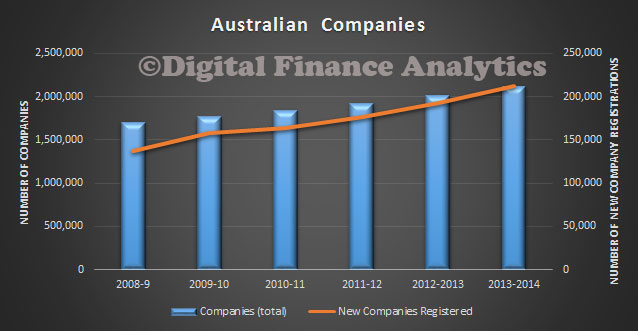
There has been a steady rise in the number of companies in Australia, with over 2.1 million operating. Last year more than 212,000 new companies were registered, whilst about 85,000 closed.

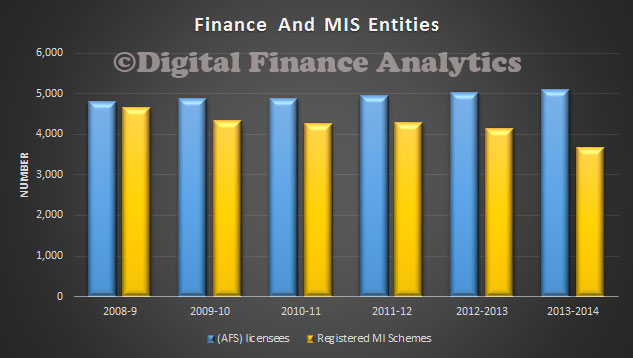
ASIC-2014-1There was a steady rise in the number of Australian Financial Services Licenses issued, including a number of limited licenses to Accountants enabling them to offer financial advice. On the other hand, the number of registered Managed Investment Schemes (MIS) fell, explained partly by the collapse of agribusiness schemes such as Timbercorp and Great Southern.

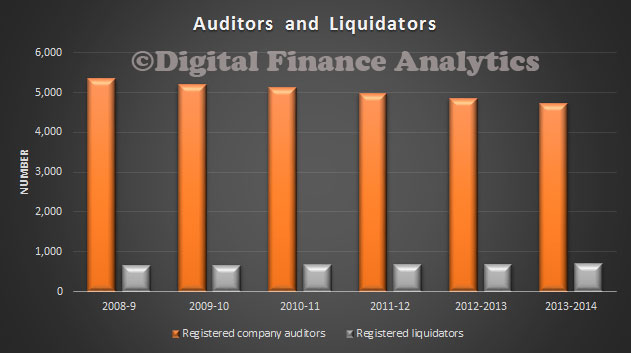
ASIC-2014-2Finally, we note that the number of registered Auditors fell a little, now below 5,000 (despite the rise in companies), as there has been considerable consolidation in the audit sector; whilst the number of entities registered as Liquidators rose slightly.

ASIC-2014-3

Managing Global Finance As A System

Andrew Haldane, Chief Economist of the Bank of England, gave the annual Maxwell Fry lecture on Global Finance at Birmingham University.  There are some powerful observations here, relevant to the Australian context, as well as the potential to amplify risks associated with a more interconnected world. He also takes macroprudential discussions further.

Andrew’s main theme was the growing size and complexity of global capital flows between countries.  He noted that ‘cross-border stocks of capital are almost certainly larger than at any time in human history’. And the apparent independence of domestic investment from domestic saving suggests that ‘measured levels of global capital market integration … remain at higher levels than at any point in history’. He discussed how this can be ‘double-edged’ from a financial stability perspective: it both shares risk (which can be stabilising) but also spreads and amplifies risk (which can be destabilising) – potentially generating ‘more frequent and/or larger dislocations’.

He argued that many lessons have been learned from the financial crisis, not least the need to ‘safeguard against systemic risk’. Yet when it comes to the fortunes of the international monetary system ‘it is far from clear that these lessons have been learned, much less that the international rules of the road have been reformed’. ‘Arguably, the rules of the road for this system have failed to keep pace with the growing scale and complexity of global financial flows’.

One of the consequences of the growth in cross border capital flows is ‘the steady rise in the degree of co-movement in asset prices over time’. Cross-border spillovers are becoming more important and global common factors more potent. A particular example is the behaviour of yield curves across countries. ‘To a first approximation, global yield curves appear these days to be dancing to a common tune’.

Andrew identified four areas where the global financial system could be strengthened:

a) Improve global financial surveillance, by tilting IMF surveillance away from monitoring individual country risk and towards multilateral surveillance and having more real-time tracking of the global flow of funds.

b) Improve country debt structures, for example by encouraging countries to issue GDP linked bonds, or Contingent Convertible (CoCo) bonds.

c) Enhance macro-prudential and capital flow management policies. For example, he suggests that ‘total credit follows a global cycle that has strengthened over time’ in which case ‘there may in future be a case for national macro-prudential policies leaning explicitly against these global factors’ taking international macro-prudential policy co-ordination ‘to the next level’. This next phase of macro-prudential policy may see measures ‘targeted at particular markets, as well as particular countries’.

d) Improve international liquidity assistance, for example by increasing the resources available to the IMF.

FED Ends Bond By-Back Programme

Just released. Sufficient signs of recovery mean the FED will end QE this month. Interest rates will remain low for now.  One of the biggest economic experiments in history moves to a new phase.

Information received since the Federal Open Market Committee met in September suggests that economic activity is expanding at a moderate pace. Labor market conditions improved somewhat further, with solid job gains and a lower unemployment rate. On balance, a range of labor market indicators suggests that underutilization of labor resources is gradually diminishing. Household spending is rising moderately and business fixed investment is advancing, while the recovery in the housing sector remains slow. Inflation has continued to run below the Committee’s longer-run objective. Market-based measures of inflation compensation have declined somewhat; survey-based measures of longer-term inflation expectations have remained stable.

Consistent with its statutory mandate, the Committee seeks to foster maximum employment and price stability. The Committee expects that, with appropriate policy accommodation, economic activity will expand at a moderate pace, with labor market indicators and inflation moving toward levels the Committee judges consistent with its dual mandate. The Committee sees the risks to the outlook for economic activity and the labor market as nearly balanced. Although inflation in the near term will likely be held down by lower energy prices and other factors, the Committee judges that the likelihood of inflation running persistently below 2 percent has diminished somewhat since early this year.

The Committee judges that there has been a substantial improvement in the outlook for the labor market since the inception of its current asset purchase program. Moreover, the Committee continues to see sufficient underlying strength in the broader economy to support ongoing progress toward maximum employment in a context of price stability. Accordingly, the Committee decided to conclude its asset purchase program this month. The Committee is maintaining its existing policy of reinvesting principal payments from its holdings of agency debt and agency mortgage-backed securities in agency mortgage-backed securities and of rolling over maturing Treasury securities at auction. This policy, by keeping the Committee’s holdings of longer-term securities at sizable levels, should help maintain accommodative financial conditions.

To support continued progress toward maximum employment and price stability, the Committee today reaffirmed its view that the current 0 to 1/4 percent target range for the federal funds rate remains appropriate. In determining how long to maintain this target range, the Committee will assess progress–both realized and expected–toward its objectives of maximum employment and 2 percent inflation. This assessment will take into account a wide range of information, including measures of labor market conditions, indicators of inflation pressures and inflation expectations, and readings on financial developments. The Committee anticipates, based on its current assessment, that it likely will be appropriate to maintain the 0 to 1/4 percent target range for the federal funds rate for a considerable time following the end of its asset purchase program this month, especially if projected inflation continues to run below the Committee’s 2 percent longer-run goal, and provided that longer-term inflation expectations remain well anchored. However, if incoming information indicates faster progress toward the Committee’s employment and inflation objectives than the Committee now expects, then increases in the target range for the federal funds rate are likely to occur sooner than currently anticipated. Conversely, if progress proves slower than expected, then increases in the target range are likely to occur later than currently anticipated.

When the Committee decides to begin to remove policy accommodation, it will take a balanced approach consistent with its longer-run goals of maximum employment and inflation of 2 percent. The Committee currently anticipates that, even after employment and inflation are near mandate-consistent levels, economic conditions may, for some time, warrant keeping the target federal funds rate below levels the Committee views as normal in the longer run.

Voting for the FOMC monetary policy action were: Janet L. Yellen, Chair; William C. Dudley, Vice Chairman; Lael Brainard; Stanley Fischer; Richard W. Fisher; Loretta J. Mester; Charles I. Plosser; Jerome H. Powell; and Daniel K. Tarullo. Voting against the action was Narayana Kocherlakota, who believed that, in light of continued sluggishness in the inflation outlook and the recent slide in market-based measures of longer-term inflation expectations, the Committee should commit to keeping the current target range for the federal funds rate at least until the one-to-two-year ahead inflation outlook has returned to 2 percent and should continue the asset purchase program at its current level.

UK Bank Write-Downs Normalising

The Bank of England just released their latest datapacks. One interesting view is the loss trends reported by Banks and Building Societies.

BOELossesOct2014The chart (shown by value) highlights the significant issues in credit cards amongst the UK banks in 2010/2011, and by contrast shows the value of write-offs from dwellings has been lower and more stable.

Losses are more normalised now, showing the UK economy is beginning to heal. But a case study in what happens in a significant financial crisis to household write-offs, and the relative risks of secured and unsecured lending.

House Prices Match Income Growth – RBA

Luci Ellis, Head of Financial Stability Department spoke to the Australian Housing and Urban Research Institute (AHURI) Panel Roundtable. You can hear her remarks, and a transcript is promised later. My notes follow.

  • Cross country comparisons on housing markets are important, but sometimes comparisons need to be used with care, e.g. specific issues like overbuilding in USA and Ireland had significant impacts. There are differences which need to be understood. Canada is a better comparator for Australia, with a similar geographic footprint but they do have some differences such as fixed rate mortgages, and the government takes tail risk as mortgage insurer.
  • There is much more data post GFC on housing related issues, BIS, IMF, etc. proved richer data. The latest data has changed the perspectives, but many conversations have not caught up yet. For example, housing prices corrected for inflation, shows Australia is not one of the “boomier” countries and prices have not materially grown faster than household incomes. There is evidence of risk in the system as shown by the house prices fall (in Sydney and nationally) if you look back over the past 15 years. Overall housing prices have tracked income.
  • Financial liberation has been one of the drivers to lift house prices relative to income, alongside credit constraints and high inflation. Inflation is lower now, though credit constraints still exist, for example, ratio of serviceability, is an important indicator. As inflation falls, loan to income ratios can be higher.
  • This change in the loan size does has important macroeconomic implications. But mortgage repayments are lower now, thanks to low interest rates. Household savings ratio turned up 2005, before the crisis.
  • Housing crashes do not improve affordability. Need to focus on where real unaffordability lives, e.g. renters who cannot afford to buy.
  • There are risks attached to overbuilding as seen overseas. Supply in Australia is increasing and it is needed, and intended as part of handover from mining investment boom. Building approvals are around 200,000 a year – bit higher than in the past thanks to more high density properties and strong population growth. But we need to understand the composition of the population growth. For example look at migration by visa type – student numbers picked up in the last two years. Students want to live in apartments in inner areas near universities. That’s where lots of the new building is in for example Sydney. There is a premium to be closer in, and it has increased in recent times.
  • There are implications for policy makers from local planning issues. Dublin example, building needs to be in the right areas. We do not build new towns in Australia, maybe we should have a long term plan for new Cities.
  • There is little speculative building in Australia (compared with other countries). Instead demand is from small investors, and future demand is more linked to expected house price growth.
  • Getting the right balance between supply of property and finance is important.

Some observations. First, average income and house prices mask the differences, many household segments in our analysis are worst today. Second, household savings ratios are being buttressed by inflated housing, and appear to be falling and they so vary by segment. Third, we see incomes in real terms falling, so what does that say for future house prices growth? We feel that RBA’s story is therefore over optimistic, despite some interesting points. What if interest rates do rise?

Moodys Warns About The Rise In Interest Only Loans

Moodys today published commentary on the risks attached to the rising number of interest only loans.

An increase in the number of Australian “owner-occupier” home buyers who are taking out interest-only (IO) mortgages is credit negative for future Australian Residential Mortgage Backed Securities (RMBS) because such loans have a higher risk of delinquency and default, particularly if interest rates rise from their current record low levels.

Over the past year, a notable rise has occurred in the amount of IO loans in Australia and owner-occupiers – people who buy a home to live in, as opposed to investors who buy to rent out — are accounting for a growing share of these loans.

IO loans are common among real estate investors in Australia because interest costs on investment loans can be claimed as a tax deduction. However, owner-occupiers cannot claim such deductions. There are concerns that many of the owner-occupiers taking out these loans — which are generally larger than the traditional Principal and Interest (PI) loans — would consequently find it difficult to service them if interest rates start to rise.

Greater Delinquency Risk as Owner-Occupier Interest Only Loans Grow

IO loans accounted for 43.2% of all new mortgages in June 2014, up from 38.6% in June 2013, according to the latest Australian Prudential Regulation Authority figures. Over the same period, the proportion of loans for investment properties also rose — to 37.9%, from 35.2% — but not by as much as the rise in IO loans.

The growing gap between the percentage of IO loans and investment loans shows that more owner-occupier borrowers are taking out IO loans.

IO loans, whether they are for owner-occupiers or real estate investors, generally carry a greater risk of delinquencies and default than traditional PI loans.

In particular, IO loans are more sensitive to interest rate rises than PI loans because of their larger amounts and slower amortization rates. IO loans are most sensitive to higher interest rates when they revert to PI loans — which typically occurs after 5-10 years — and monthly repayment amounts rise significantly.

If the proportion of owner-occupier IO loans continues to rise, we would expect that they would also make up a greater proportion of the loans in future RMBS transactions, which would be credit negative, given their higher propensity for delinquency and default.

Owner-occupier IO loans account for 16.5% of the current RMBS portfolio, but these do not present the same risk as new owner-occupier IO loans because they were underwritten when interest rates were higher and would be more resilient when rates rise again.

In the current record low interest rate environment in Australia, delinquency rates for IO loans have in fact been lower than for PI loans. This situation reflects the fact that monthly repayments for IO loans are lower than PI loans. However, our expectation is that interest rates in Australia will rise in 2015, putting more pressure on IO borrowers and resulting in greater levels of delinquencies and defaults.

Real estate investors in Australia can claim a tax deduction for the interest costs of their loans, which will help offset the impact of higher rates. However, owner-occupiers are not eligible for such deductions. For this reason, all else being equal, an increase in interest rates will be more severe for owner-occupier IO borrowers than investment borrowers.

Owner-Occupiers Turn to IO Loans as Property Prices Increase

At a time when property prices and therefore the size of mortgages in Australia is rising rapidly, the increase in the number of owner occupiers taking out IO loans may reflect their decision to take out larger loans amounts, given the rise in property prices.

In Australia, national house prices have increased by 9.3% over the year ended September 2014, while in Sydney, the city with the highest growth, prices have risen by 14.3%.

Against this backdrop, home buyers may view IO loans as an option if they seek to borrow larger amounts without having to service as large a monthly repayment amount as they would have to with a similarly sized PI loan.

In our existing RMBS portfolio, the average loan size of owner-occupier IO loans is AUD289,800, compared with AUD187,500 for PI loans.

In addition, the current loan-to-value ratio of owner-occupier IO loans is 2.1% higher than PI loans. IO loans are also paid off at a slower rate, as reflected by the fact that they are 5.1% in advance of their scheduled payment balance, compared with 6.5% for PI loans. Hence, owner occupier IO loans are larger, more leveraged and slower to amortize than PI loans.

Accordingly, once interest rates rise from their current record low levels, any issues owner-occupier IO loan borrowers have with servicing their mortgages will be exacerbated, leading to higher delinquencies and defaults.

However, it is also important to note that some owner-occupier borrowers may be choosing IO loans simply to maintain a level of flexibility in managing their repayment obligations, rather than because of serviceability reasons. Given that interest rates are at record lows, these borrowers may feel comfortable in paying only the interest on their mortgages and using any remaining available funds for other purposes.

But, because these borrowers are making few, if any, principal repayments, their loan amounts will remain high relative to PI loans, leaving them more susceptible to payment shocks when interest rates rise.