
The 13th Annual Housing Affordability Survey – 2017 has been released by Demographia and it underscores the problem we have with affordable housing. All five of Australia’s major centres are rate “un-affordable on their scale.
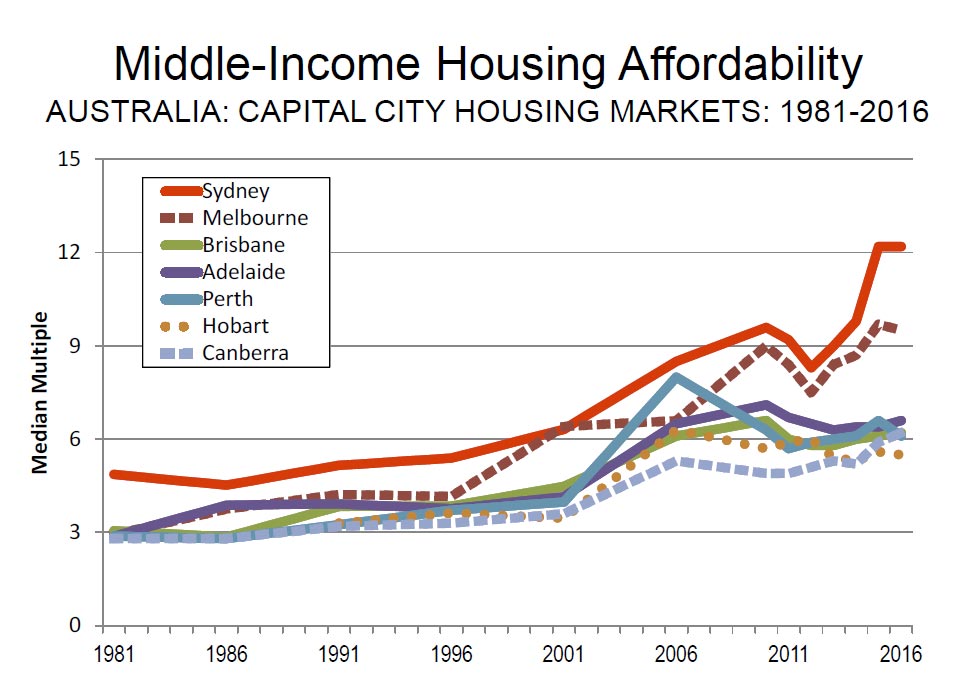
The overall major housing market Median Multiple is 6.6. In 2004 (the first Survey), Sydney’s Median Multiple was 7.6, and has risen 60 percent since then.
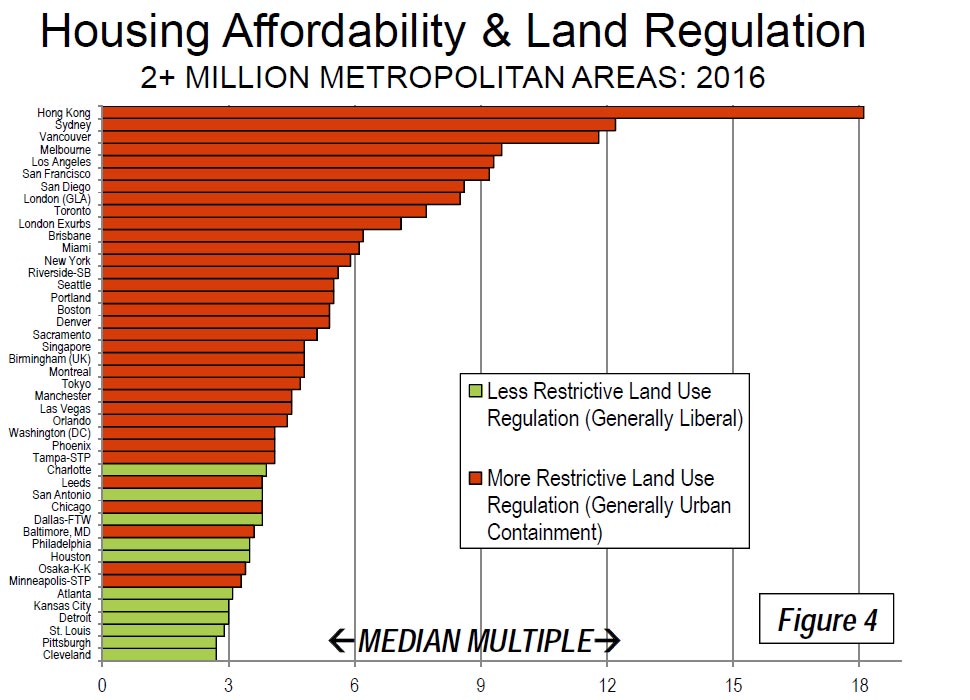
Only Hong Kong, Sydney, Vancouver, Auckland and San Jose are less affordable than Melbourne. Adelaide has a severely unaffordable 6.6 Median Multiple and is the 16th least affordable of the 92 major markets. Brisbane has a Median Multiple is 6.2 and is ranked 18th least affordable, while Perth, with a Median Multiple of 6.1 is the 20th least affordable major housing market.
Outside of the major markets, 28 in Australia are rated severely unaffordable. The least affordable of these are Wingcaribbee, NSW (9.8), Tweed Head, NSW (9.7), Gold Coast, QLD (9.0) and Sunshine Coast, QLD (9.0).
Sydney in second place, after Hong Kong, with Melbourne also in the top 10.
Demographia’s ‘median multiple’ approach establishes a benchmark for housing affordability by linking median house prices to median household incomes. The ‘median multiple’ is not a perfect measure because it does not account for house sizes or build quality. But it is the only index that allows a quick comparison of different housing markets, and it is the best approximation of housing affordability measures we have to date.
The Median Multiple is widely used for evaluating urban markets, and has been recommended by the World Bank and the United Nations and is used by the Joint Center for Housing Studies, Harvard University. The Median Multiple and other price-to-income multiples (housing affordability multiples) are used to compare housing affordability between markets by the Organization for Economic Cooperation and Development, the International Monetary Fund, The Economist, and other organizations.
Historically, liberally regulated markets have exhibited median house prices that are three times or less that of median household incomes, for a Median Multiple of 3.0 or less.
The Survey covers 406 metropolitan housing markets (metropolitan areas) in nine countries (Australia, Canada, China, Ireland, Japan, New Zealand, Singapore, the United Kingdom and the United States) for the third quarter of 2016. A total of 92 major metropolitan markets (housing markets) — with more than 1,000,000 population — are included, including five megacities (Tokyo-Yokohama, New York, Osaka-Kobe-Kyoto, Los Angeles, and London).
There are 26 severely unaffordable major housing markets in 2016. Again, Hong Kong is the least affordable, with a Median Multiple of 18.1, down from 19.0 last year. Sydney is again second, at 12.2 (the same Median Multiple as last year). Vancouver is third least affordable, at 11.8, where house prices rose the equivalent of a full year’s household income in only a year. Auckland is fourth least affordable, at 10.0 and San Jose has a Median Multiple of 9.6. The least affordable 10 also includes Melbourne (9.5), Honolulu (9.4), Los Angeles (9.3), where house prices rose the equivalent of 14 months in household income in only 12 months. San Francisco has a Median Multiple of 9.2 and Bournemouth & Dorsett is 8.9.
One thought on “Housing Affordability Still Under Pressure – Demographia”