Analysis from the Federal Reserve Bank of St Louis shows that in the US, whilst overall household credit is lower now, this is being driven by reduced credit creation, and not increased credit destruction. We see a very different profile of debt compared with Australia, where household debt has never been higher. However, our analysis shows that core debt is also being held for longer, so the same effect is in play here, although new debt is also accelerating, driven by housing.
Household debt in the United States has been on a roller coaster since early 2004. As the first figure shows, between the first quarter of 2004 and the fourth quarter of 2008, total household debt increased by about 46 percent—an annual rate of about 8.3 percent. A process of household deleveraging started in 2009 and stabilized at a level 13 percent below the previous peak in the first quarter of 2013. During those four years, the household debt level decreased at a yearly rate of 3 percent. Since then, it has moved only modestly back toward its previous levels.
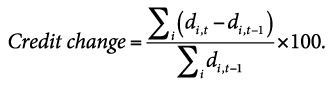
This essay provides a simple decomposition of the changes in debt levels to shed light on the sources of those changes. The analysis is similar to the decomposition of labor market flows performed by Haltiwanger (2012) and the decomposition of changes in business credit performed by Herrera, Kolar, and Minetti (2011). We use the term “credit change” to refer to the change in household debt: the difference between household debt (D) in the current period, t, and debt in the previous period, t –1, divided by debt in the previous period, t –1:
The total household debt is the sum of debt for each household i, so this can also be written as
Equivalently, one can add the changes in debt for each household i:
The key advantage of using household-level data is that one can separate positive changes (credit creation) from negative changes (credit destruction) and compute the change in debt as
Credit change = Credit creation – Credit destruction,
where
and
These concepts are interesting because they can be linked to different household financial decisions. Credit creation can be linked to additional credit card debt or a new mortgage and credit destruction can be linked to repaying debt or simply defaulting.
As this decomposition makes clear, a stable level of debt (a net change of 0) could be the result of a large credit creation offset by an equally large credit destruction. Or it could indicate no creation and no destruction at all. To differentiate between these cases, it is useful to consider “credit activity” (also called reallocation), which is defined as
Credit activity = Credit creation + Credit destruction.
This is a useful measure because it captures credit activity ignored by the change in total debt.
The second figure shows credit creation, destruction, change, and overall activity. Recall that credit change is the difference between credit creation and destruction, while credit activity is the sum of credit creation and destruction. The credit change shown in the second figure traces the increase in debt before the 2008 crisis, the deleveraging that followed, and the relative stability of debt over the past 3 years. Analysis of debt creation and destruction shows that the expansion of debt was due to above-average creation of debt before the crisis—not insufficient credit destruction; credit destruction was actually slightly above average. Thus, credit activity was extensive during that period, with large amounts of both destruction and creation.
The deleveraging involved a decrease in creation (or origination) of debt: Creation started at nearly 10 percent in the expansion period but dropped below 5 percent after the financial crisis. Credit destruction was not the main contributor to the deleveraging: Destruction did not grow during the deleveraging period; it was actually slightly lower than during the expansion period. Thus, the deleveraging period of 2009-11 saw a very low level of credit activity, mainly due to the small amount of new credit issuance.
Finally, the stability of debt from 2011 to 2013 masked the increasing credit activity since both destruction and creation increased but offset each other. In sharp contrast, during the past year, the stability of debt has been due to very low levels of creation and destruction. In fact, credit activity is currently as low as it was in the middle of the financial crisis: about 9 percent of total household debt.
Overall, this analysis of household debt suggests that reduced credit creation, and not increased credit destruction, has been the key driver of the recent evolution of U.S. household debt. A topic for future investigation is that U.S. households are currently engaging in record low levels of financial intermediation, which is not obvious by simply observing the level of household debt.