
Last month the results from the latest Dodd-Frank Act Stress Tests were released. Unlike the APRA tests the outcomes of which (other than high-level general comments), are totally secret; the results for individual banks are disclosed, allowing comparisons to be made. In addition, there is real focus on capital ratios, which in Australia according to the Murray report should be lifted here, because currently our banks are supported by an implicit government guarantee. Looking at the US regime provides insights into how banking supervision works.
By way of background, in the wake of the recent financial crisis, under the DoddFrank Act, the US Federal Reserve is required to conduct an annual stress test of banks with total consolidated assets of $50 billion or more as well as designated nonbank financial companies. The tests are designed to see if these banks have appropriate capital adequacy processes and capital to absorb losses during stressful conditions, whilst meeting obligations to creditors and counterparties and continuing to serve as credit intermediaries.
There are two elements to the tests, first examining a banks capital adequacy, capital adequacy process, and planned capital distributions, such as dividend payments and common stock repurchases – Comprehensive Capital Analysis and Review (CCAR), and second a forward-looking quantitative evaluation of the impact of stressful economic and financial market conditions – Dodd-Frank Act Stress Test (DFAST). The scenarios are not disclosed prior to testing, so to an extent, the banks are not able to dress up their results.
This is the fifth round of stress tests led by the Federal Reserve since 2009 and the third round required by the Dodd-Frank Act. The 31 firms tested represent more than 80 percent of domestic banking assets. The Federal Reserve uses its own independent projections of losses and incomes for each firm.
Moreover, the banks have to pass the tests in order to pay out rewards to its investors, so it is much more than a mathematical academic exercise. The Fed is more and more focussing on the culture of the organisations and some banks failed the qualitative assessment. As the testing has evolved, this activity has become more are more part of normal supervisory activities, rather than a once a year proof.
Overall, the Fed’s judgment is that American banks carry enough cash and have strong enough internal risk management systems to weather a severe economic downturn. 28 of 31 financial institutions tested had adequately balanced capital and risk in hypothetical downturn, allowing them to return cash to shareholders as planned.
We look at the work in more detail.
The Scenario Modelling, (DFAST).
The Federal Reserve’s projections of revenue, expenses, and various types of losses and provisions that flow into pre-tax net income are based on data provided by the 31 banks participating in the test and on models developed or selected by Federal Reserve staff and reviewed by an independent group of Federal Reserve economists and analysts. The models are intended to capture how the balance sheet, RWAs, and net income of each BHC are affected by the macroeconomic and financial conditions described in the supervisory scenarios, given the characteristics of the banks loans and securities portfolios; trading, private equity, and counterparty exposures from derivatives; business activities; and other relevant factors.
The adverse and severely adverse supervisory scenarios used this year feature U.S. and global recessions. In particular, the severely adverse scenario is characterized by a substantial global weakening in economic activity, including a severe recession in the United States, large reductions in asset prices, significant widening of corporate bond spreads, and a sharp increase in equity market volatility. The adverse scenario is characterized by a global weakening in economic activity and an increase in U.S. inflationary pressures that, overall, result in a rapid increase in both short- and long-term U.S. Treasury rates.
The Severely Adverse Scenario
The severely adverse scenario for the United States is characterized by a deep and prolonged recession in which the unemployment rate increases by 4 percentage points from its level in the third quarter of 2014, peaking at 10 percent in the middle of 2016. By the end of 2015, the level of real GDP is approximately 4.5 percent lower than its level in the third quarter of 2014; it begins to recover thereafter. Despite this decline in real activity, higher oil prices cause the annualized rate of change in the Consumer Price Index (CPI) to reach 4.3 percent in the near term, before subsequently falling back. In response to this economic contraction—and despite the higher near-term path of CPI inflation, short-term interest rates remain near zero through 2017; long-term Treasury yields drop to 1 percent in the fourth quarter of 2014 and then edge up slowly over the remainder of the scenario period. Consistent with these developments, asset prices contract sharply in the scenario. Driven by an assumed decline in U.S. corporate credit quality, spreads on investment-grade corporate bonds jump from about 170 basis points to 500 basis points at their peak.
Equity prices fall approximately 60 percent from the third quarter of 2014 through the fourth quarter of 2015, and equity market volatility increases sharply. House prices decline approximately 25 percent during the scenario period relative to their level in the third quarter of 2014.
The international component of the severely adverse scenario features severe recessions in the euro area, the United Kingdom, and Japan, and below-trend growth in developing Asia. For economies that are heavily dependent on imported oil—including developing Asia, Japan, and the euro area—this economic weakness is exacerbated by the rise in oil prices featured in this scenario. Reflecting flight-to-safety capital flows associated with the scenario’s global recession, the U.S. dollar is assumed to appreciate strongly against the euro and the currencies of developing Asia and to appreciate more modestly against the pound sterling. The dollar is assumed to depreciate modestly against the yen, also reflecting flight-tosafety capital flows.
In this severely adverse scenario, Over the nine quarters of the planning horizon, losses at the 31 BHCs under the severely adverse scenario are projected to be $490 billion.
 This includes losses across loan portfolios, losses from credit impairment on securities held in the BHCs’ investment portfolios, trading and counterparty credit losses from a global market shock, and other losses.
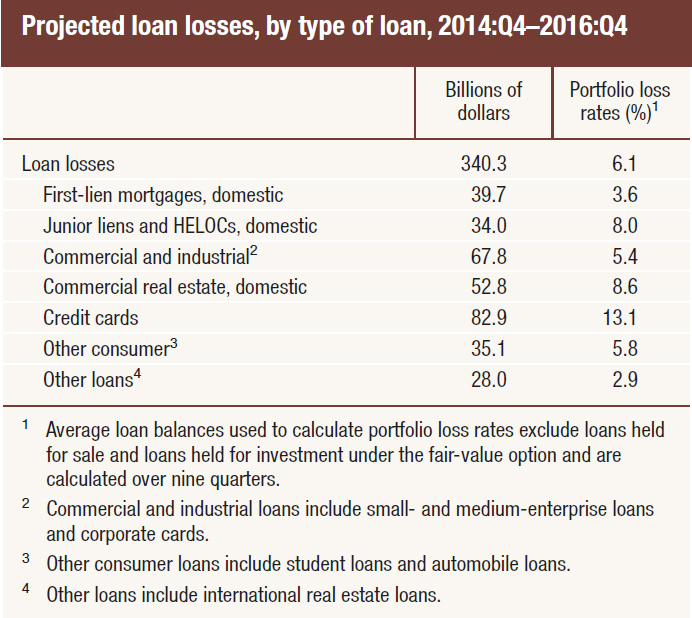
 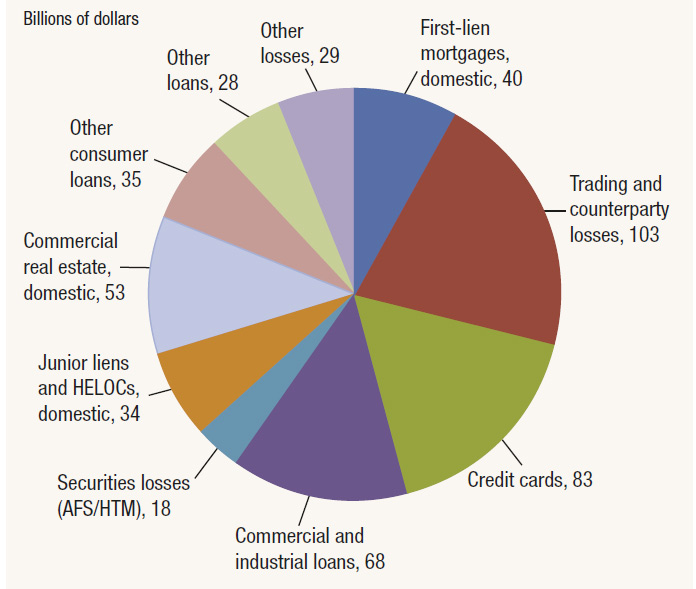 Projected net revenue before provisions for loan and lease losses (pre-provision net revenue, or PPNR) is $310 billion, and net income before taxes is projected to be –$222 billion. There are significant differences across banks in the projected loan loss rates for similar types of loans. For example, while the median projected loss rate on domestic first-lien residential mortgages is 3.5 percent, the rates among banks with first-lien mortgage portfolios vary from a low of 0.9 percent to a high of 12.5 percent. Similarly, for commercial and industrial loans, the range of projected loss rates is from 3.0 percent to 14.0 percent, with a median of 4.8 percent. Differences in projected loss rates across BHCs primarily reflect differences in loan and borrower characteristics.
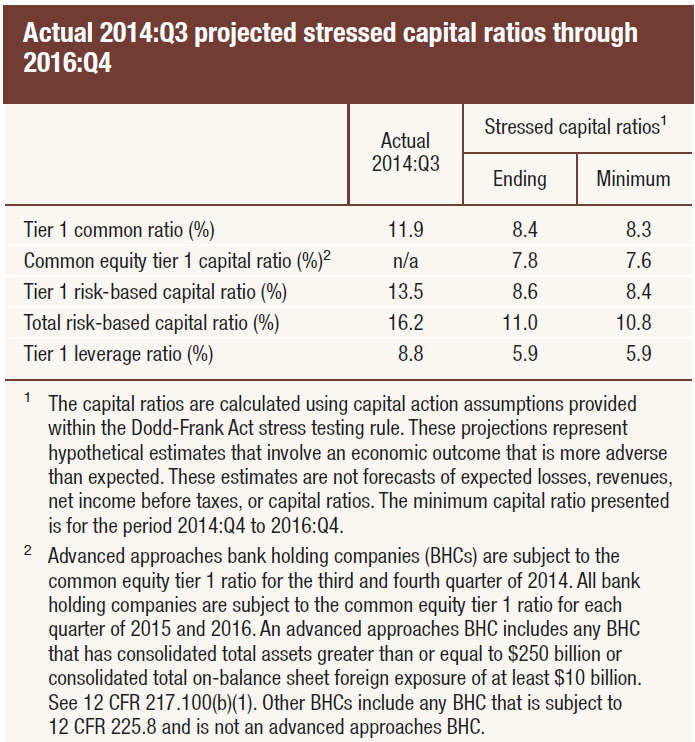
The aggregate tier 1 common capital ratio would fall from an actual 11.9 percent in the third quarter of 2014 to a post-stress level of 8.4 percent in the fourth quarter of 2016.
 The Adverse Scenario
In the adverse scenario, the United States experiences a mild recession that begins in the fourth quarter of 2014 and lasts through the second quarter of 2015. During this period, the level of real GDP falls approximately 0.5 percent relative to its level in the third quarter of 2014, and the unemployment rate increases to just over 7 percent. At the same time, the U.S. economy experiences a considerable rise in core inflation that results in a headline CPI inflation rate of 4 percent by the third quarter of 2015; headline inflation remains elevated thereafter. Short-term interest rates rise quickly as a result, reaching a little over 2.5 percent by the end of 2015 and 5.3 percent by the end of 2017. Longer-term Treasury yields increase by less. The recovery that begins in the second half of 2015 is quite sluggish, and the unemployment rate continues to increase, reaching 8 percent in the fourth quarter of 2016, and flattens thereafter. Equity prices fall both during and after the recession and by the end of the scenario are about 25 percent lower than in the third quarter of 2014. House prices and commercial real estate prices decline by approximately 13 and 16 percent, respectively, relative to their level in the third quarter of 2014.
In the adverse scenario, projected losses, PPNR, and net income before taxes are $314 billion, $501 billion, and $178 billion, respectively. The accrual loan portfolio is the largest source of losses in the adverse scenario, accounting for $235 billion of projected losses for the 31 BHCs. The lower peak unemployment rate and more moderate residential and commercial real estate price declines in the adverse scenario result in lower projected accrual loan losses on consumer and real estate-related loans. The ninequarter loan loss rate of 4.1 percent is below the peak industry-level rate reached during the recent financial crisis but still higher than the rate during any other period since the Great Depression of the 1930s. As in the severely adverse scenario results, there is considerable diversity across firms in projected loan loss rates, both in the aggregate and by loan type. The aggregate tier 1 common capital ratio under the adverse scenario would fall 110 basis points to its minimum over the planning horizon of 10.8 percent before rising to 11.7 percent in the fourth quarter of 2016.
Standing back, a few observations are worth thinking about, courtesy of the The Harvard Law School Forum on Corporate Governance and Financial Regulation.
1. More post-stress capital exists today than did pre-stress capital during the financial crisis: The 31 banks’ post-stress Tier 1 Common ratio (T1C) average 8.2% under the severely adverse scenario, which is higher than the same banks’ pre-stress T1C average of 5.5% at the beginning of 2009. Average pre-stress T1C is also up again this year from last year (11.9% versus 11.5%) as is post-stress T1C (8.2% versus 7.6%).
2. Industry capital ratios improve faster overall than at the largest banks: The six largest banks accounted for about half of the total increase in industry Tier 1 common equity. However, these institutions make up 70% of industry-wide RWA, demonstrating that the other 25 banks are disproportionately accounting for the increase in industry-wide capital.
3. Leverage ratio appears binding for many of the largest banks: The leverage ratio is the binding constraint for many large banks as they remain close to the 4% minimum. The leverage ratio is particularly punitive for banks with significant capital markets activities. However, as the proposed G-SIB capital surcharge comes into play, these banks will further increase their common equity, lessening the impact of the leverage ratio in the future.
4. Fed models seem to be maturing and becoming more predictable: For the first time, the Fed disclosed the degree to which its stress models have changed, indicating that there were only incremental changes to most models. This model stability (and the fact that the Fed’s economic scenarios have been held fairly constant over time) should allow banks to better anticipate the Fed’s projected capital losses in the future. Banks can integrate this information into their future capital distribution plans in order to maximize their distributions to shareholder without having to raise regulatory flags by taking the mulligan.
5. Loan loss rates improve due to fewer legacy problem portfolios and improved underwriting standards: Total loan loss rates continued their march downward, reaching 6.1% under the severely adverse scenario (down from 6.9% in 2014 and 7.5% in 2013). This decline is driven by improvements in first lien loans, junior liens, and credit cards, as legacy problem portfolios are being removed from balance sheets and improved underwriting standards are taking hold (as alluded to above, Fed models and scenarios in these areas have remained stable). First lien and junior lien loss rate declines are particularly impactful, with decreases of 2.1 and 1.6 percentage points respectively. Commercial and industrial loan loss rates remained stable from last year, but were generally higher for banks with significant leveraged lending businesses (which the Fed has been expressing concern about in recent years).
6. Banks overall are positioned well under the adverse scenario’s rising interest rate environment: Firms have generally prepared for the prospect of rising rates, as reflected in the adverse scenario results that show 27 of the 31 firms posting a pre-tax profit over the nine quarters. The average T1C falls only 110 bps from start to minimum, and 80 bps of that erosion is recouped by the end of the nine quarters through an increase in PPNR for these banks, largely due to asset-sensitive balance sheets more than offsetting unrealized AFS losses over time.
7. Minimum capital ratios look worse than reality: A few banks that heavily trade in the capital markets have post-stress minimum capital ratios close to the 8% requirement. However, we do not believe these banks will be as constrained in their capital distributions as it may appear. The trough in their ratios comes very early in the nine-quarter stress horizon, due to the market shock component which disproportionately impacts these firms, but rises in subsequent quarters.
8. DFAST (and CCAR) will likely be tougher in the future: The Fed indicated late last year that it may add all or a portion of the proposed G-SIB capital surcharge to post-stress capital ratios. Although we would not expect a proposed rule in this regard until at earliest the second half of this year, it is possible that such a rule could be finalized in time for DFAST 2016 given that stress testing deadlines will occur three months later. Timing aside, in our view the G-SIB capital surcharge will ultimately factor into stress testing. At a minimum for 2016, Fed expectations will be higher as a result of the extra three months for banks to prepare.
The Comprehensive Capital Analysis and Review (CCAR)
In November 2011, the Federal Reserve issued the capital plan rule and began requiring Bank Holding Companies (BHCs) with consolidated assets of $50 billion or more to submit annual capital plans to the Federal Reserve for review. For the CCAR 2015 exercise, the Federal Reserve issued instructions on October 17, 2014, and received capital plans from 31 BHCs on January 5, 2015. The capital plan rule specifies four mandatory elements of a capital plan:
- an assessment of the expected uses and sources of capital over the planning horizon that reflects the BHC’s size, complexity, risk profile, and scope of operations, assuming both expected and stressful conditions, including estimates of projected revenues, losses,reserves, and pro forma capital levels and capital ratios (including the minimum regulatory capital ratios and the tier 1 common ratio) over the planning horizon under baseline conditions, supervisory stress scenarios,and at least one stress scenario developed by the BHC appropriate to its business model and portfolios;. a discussion of how the company will maintain all minimum regulatory capital ratios and a pro forma tier 1 common ratio above 5 percent under expected conditions and the stressed scenarios; a discussion of the results of the stress tests required by law or regulation, and an explanation of how the capital plan takes these results into account; and a description of all planned capital actions over the planning horizon;
- a detailed description of the BHC’s process for assessing capital adequacy;
- the BHC’s capital policy; and
- a discussion of any baseline changes to the BHC’s business plan that are likely to have a material impact on the BHC’s capital adequacyor liquidity.
When the Federal Reserve objects to a BHC’s capital plan, the BHC may not make any capital distribution unless the Federal Reserve indicates in writing that it does not object to the distribution.
CCAR differs from DFAST by incorporating the 31 participating bank holding companies’ (“BHC” or “bank”) proposed capital actions and the Fed’s qualitative assessment of BHCs’ capital planning processes. When the CCAR was subsequently released, some banks came close to failing the tests. The Fed objected to two foreign BHCs’ capital plans and one US BHC received a “conditional non-objection,” all due to qualitative issues. Bank of America received the only sanction among U.S. firms and the bank is to resubmit its capital plan due to weaknesses in its modeling practices and internal controls. Bank of America’s conditional failure means it will have to shelve plans to increase dividends and issue stock buybacks until the Fed reviews its updated submission in six months. Santander and Deutsche Bank will also have to put investor payouts on hold. It was widely expected that the two banks would trip up on the stress tests, which have proven difficult for foreign-based banks. Santander failed its first test last year, while this was Deutsche Bank’s first attempt.
Looking at the CCAR, here are some further key points:
1. Capital planning process enhancements pay off: The fact that only two plans were rejected indicates that BHCs’ investments in quality processes have been worthwhile, most recently at Citi. Banks now have more room to make the CCAR exercise more sustainable by reducing costs and integrating with financial planning for better strategic decision making.
2. No amount of capital can make up for deficient processes: In objecting to the capital plans, the Fed cited foundational risk management issues such as risk identification and modeling quality. The press leak of this year’s rejections could have been an intentional effort to avoid an overreaction to last week’s positive quantitative-only DFAST results (avoiding confusion from prior years).
3. Return of the “conditional non-objection”: The Fed reintroduced the conditional non-objection in CCAR 2015 for one US BHC, Bank of America, after a one-year hiatus. Under this qualified pass, the Fed is requiring the bank to fix issues related to its loss and revenue modeling and internal controls, and to resubmit its capital plan by the end of the third quarter of 2015. Although matters requiring immediate attention (“MRIAs”) generally must be remediated within one CCAR cycle, conditional passes seem to operate as super-MRIAs by giving the Fed teeth to require remediation within six months (which may be particularly important this year, given the three month extended CCAR cycle for 2016). However, BHCs receiving this pass have ultimately been able to follow through on their proposed capital distributions, so the return of the conditional pass may be more of a broad message from the Fed: even though all US BHCs passed this year, their CCAR processes must continue to improve.
4. Large banks see little downside to taking the mulligan, so are being more aggressive with planned capital actions: Three of the largest US BHCs exercised the option to adjust their planned capital distributions downward, after receiving last week’s DFAST results indicating their initial plans distributed too much capital. The use of this “mulligan” continues to be limited to the largest institutions with the most sophisticated capital planning processes, and is increasingly being taken as they attempt to pay out more to shareholders. However, the Fed may look unfavorably on this development if viewed as a sign of weak capital planning capabilities (and may rethink stress testing guidelines in the future).
5. Fed and BHC loan loss modeling differences are converging, but the gap remains wide: Continuing the previous two years’ trend, the gap between Fed and BHC loan loss rate projections has again shrank this year—by about 30% across loan-types driven mostly by residential loan loss projections. This convergence will likely help management better align its proposed capital actions with the Fed’s views and more precisely assess the risk of taking the mulligan. However, the gap remains wide, at over 140 basis points across loan categories, including about 440 basis points for CRE loans. While the Fed’s projected loan loss rates have been declining rapidly under the severely adverse scenario (reaching a 6.1% average this year, down from 6.9% in 2014 and 7.5% in 2013), BHCs’ projections have been declining more slowly.
6. Fed asset growth projections continue to exert downward pressure on stressed Tier 1 common ratios: CCAR 2014 marked the first time that the Fed projected banks’ growth in risk-weighted assets, which significantly reduced stressed Tier 1 common ratios. This year Fed projections again exceed BHC projections, this time by about 10% under Basel I (versus about 12% last year) under the severely adverse scenario. As a result, banks’ stressed Tier 1 common ratios are about 90 basis points lower on average than they would have been under the Fed’s 2013 approach.
7. Caution signs line the road ahead for new CCAR entrants: As part of last year’s CCAR, the Fed noted that the 12 then-new CCAR entrants would not be held to the same high standards applicable to the largest BHCs. This year, in contrast, the Fed made clear that this grading curve does not apply to new entrants that are supervised by the Fed’s Large Institution Supervision Coordinating Committee (“LISCC”). Therefore, large intermediate holding companies and certain nonbanks deemed systemically important should take notice that the Fed’s heightened standard for LISCC firms will likely apply to them when they enter CCAR down the road.
8. Proving comprehensive risk identification will be one of the biggest challenges for CCAR 2016: A new expectation for 2015 required banks to prove (rather than simply describe) the comprehensiveness of their risk identification process and its linkage to capital planning and scenario generation. Given the experienced challenges in doing so this year, expect this area to be an important Fed focus for CCAR 2016.
9. Binding constraints on capital will evolve: The Tier 1 leverage ratio continues to be a binding constraint, especially among the BHCs with the largest capital markets businesses. However, as the proposed G-SIB capital surcharge is implemented, these banks will further increase their common equity which will lessen the impact of the leverage ratio. The binding constraint will remain a moving target as banks seek to optimize their capital holdings given the phase-in of the G-SIB capital surcharge (along with expected short-term funding capital penalties and long-term debt requirements) and the upcoming implementation of the supplementary leverage ratio (“SLR”).
10. CCAR is bigger than stress testing: The Fed explicitly stated this year that outstanding supervisory issues, beyond capital planning, may result in a qualitative objection to a BHC’s capital plan. This statement clarifies that matters outside of capital planning, such as regulatory reporting (beyond the FR Y-14 and FR Y-9C series), enterprise risk management, and governance may lead to the Fed halting additional capital distributions to shareholders.
A Quick Look At Individual Banks
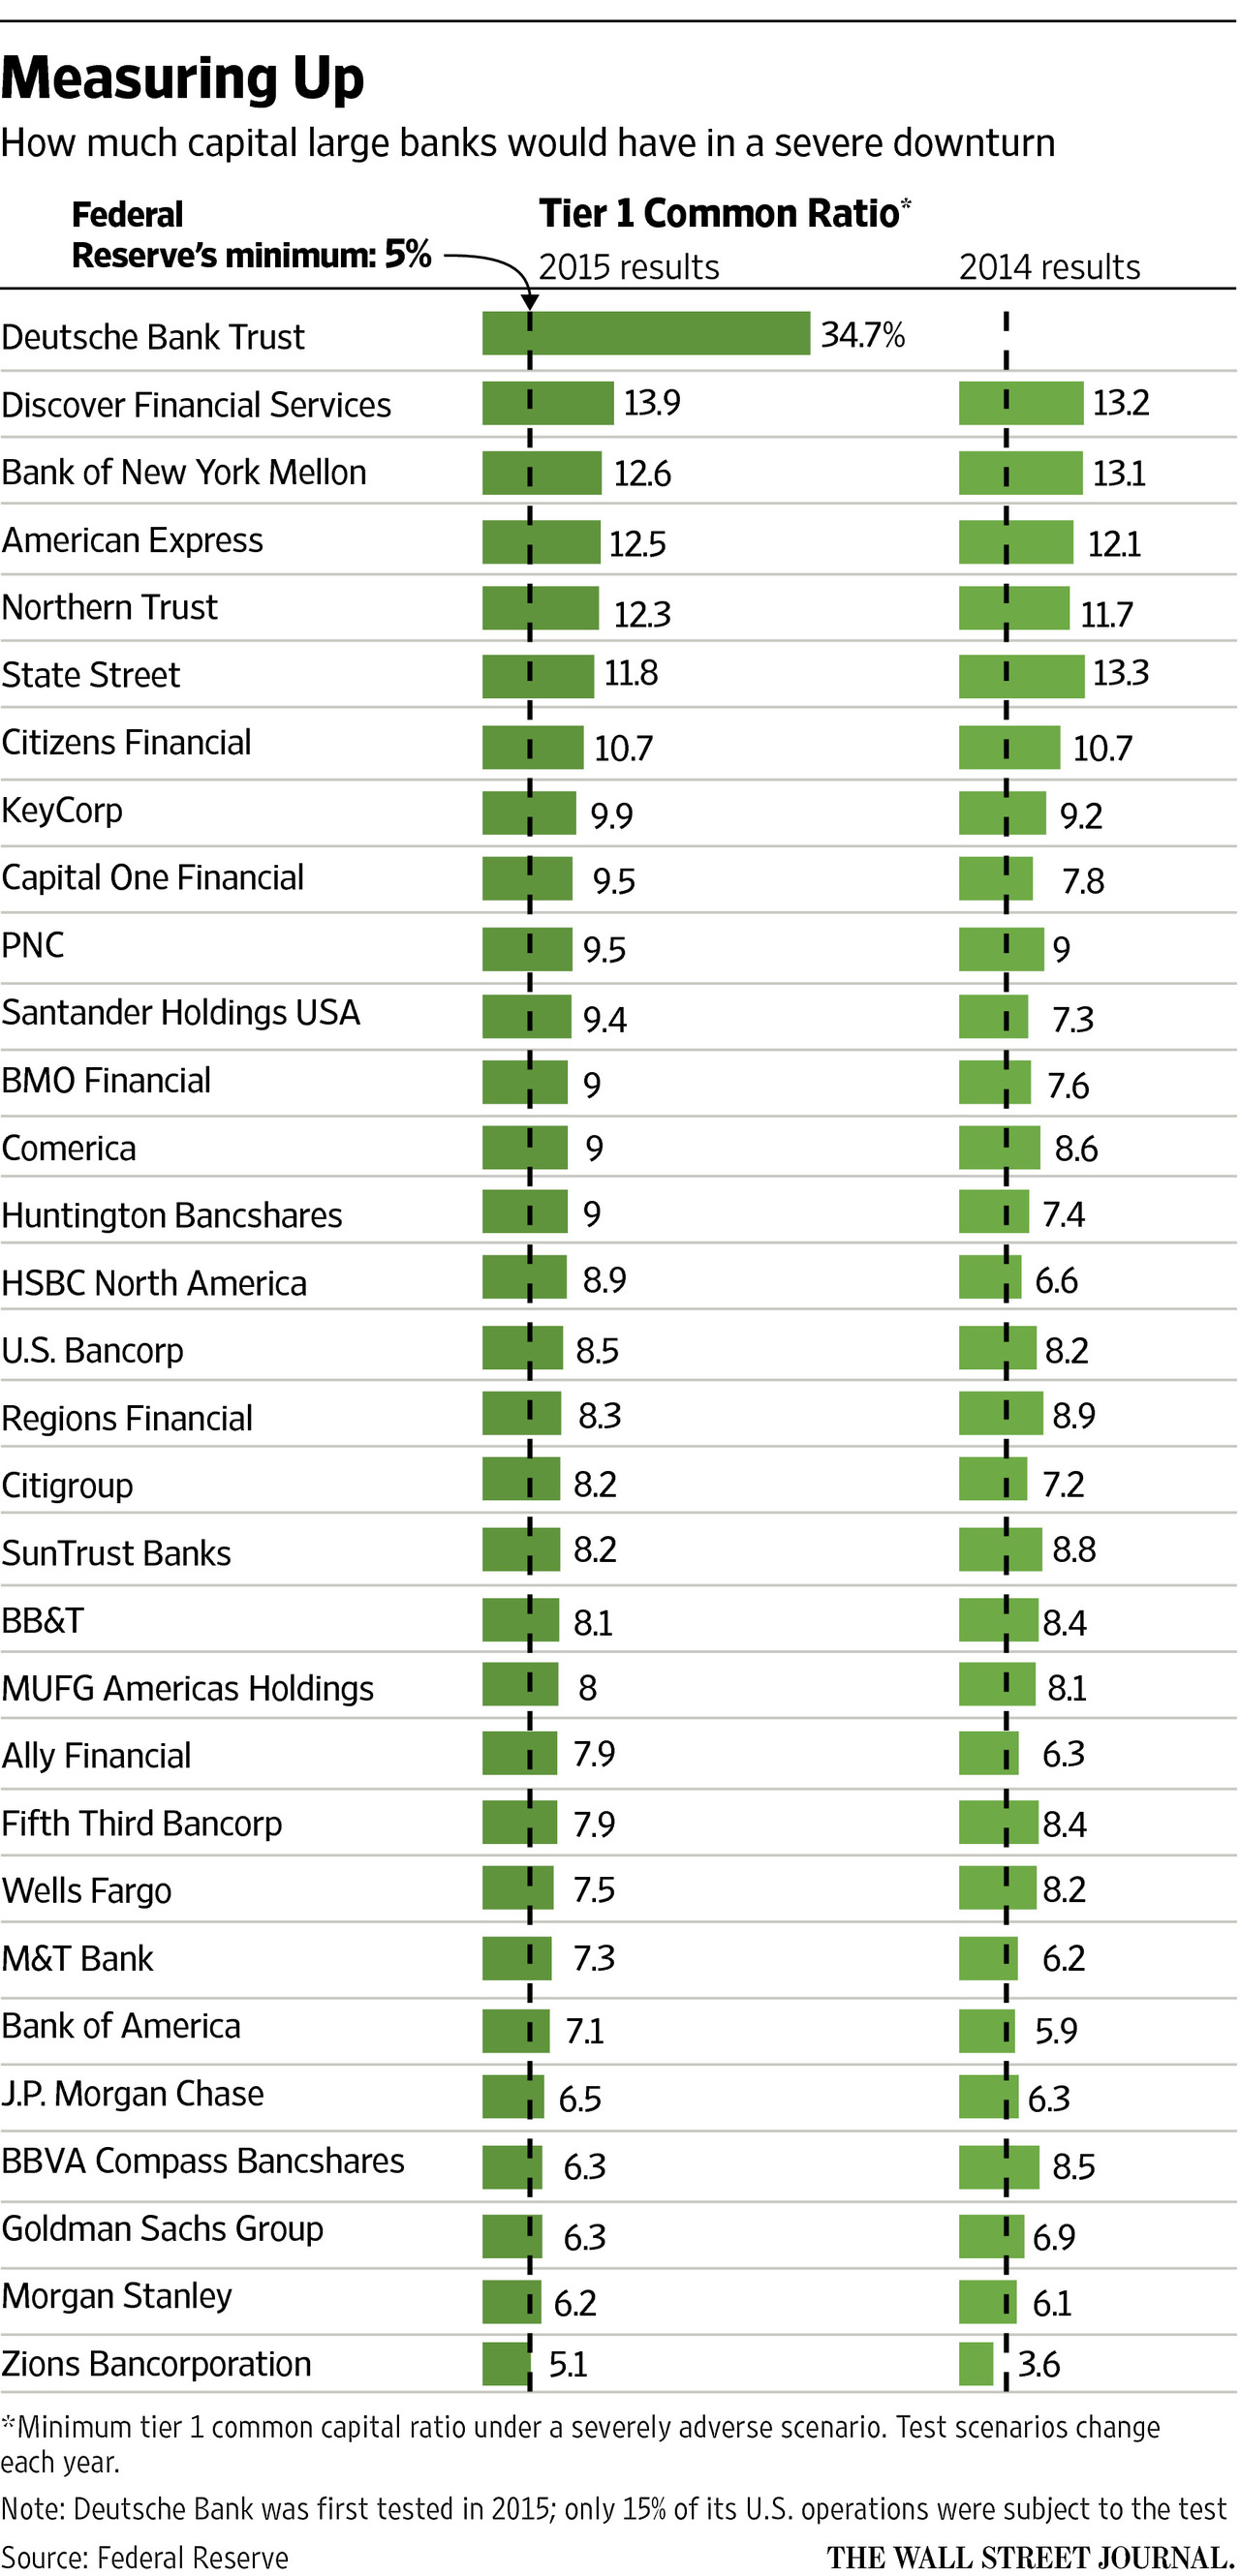
The individual bank data is interesting. You can read the details in the reports via the links above. However, here is the list of players assessed, sorted by the minimum tier 1 common ratio under the severely adverse scenario, which the WSJ reproduced from the report. Note the 5% hurdle rate which is becoming a critical lens to assess the true position of the banks, rather than the complexity of internal models.
 Going Forward
The Federal Reserve evaluates planned capital actions for the full nine-quarter planning horizon to better understand each BHC’s longer-term capital management strategy and to assess post-stress capital levels over the full planning horizon. While the nine-quarter planning horizon reflected in the 2015 capital plans extends through the end of 2016, the Federal Reserve’s decision to object or not object to BHCs’ planned capital actions is carried out annually and typically applies only to the four quarters following the disclosure of results. However, starting in 2016, the stress testing and capital planning schedules will begin in January of a given year, rather than October, resulting in a transition quarter before the next CCAR exercise. As a result, the Federal Reserve’s decisions with regard to planned capital distributions in CCAR 2015 will span five quarters and apply from the beginning of the second quarter of 2015 through the end of the second quarter of 2016.
It seems to me that Australia really needs to step up its focus on capital regulation, and simply waiting for the next Basel dictates will not cut the mustard. I think we need a massive lift in disclosure here, and the Dodd-Frank model points a potential path.
One thought on “What Does The Fed’s Bank Stress Tests Tell Us?”