
The ABC reported that “a Treasury document obtained by the ABC under Freedom of Information (FOI) shows most of the windfall from the property tax break goes to high-income earners. The modelling said more than half of the negative gearing tax benefits go to the top 20 per cent of incomes in Australia. “Negative gearing benefits high-income families,” the document said. The report stated those in the bottom 20 per cent were getting just over 5 per cent of negative gearing tax benefits”.
On the other hand, the Government has continued to argue “mum and dad” investors and Australians on average earnings are the main beneficiaries. “It does not change the fact that two thirds of Australians using negative gearing have a taxable income of less than $80,000,” Treasurer Scott Morrison said. This is of course axiomatic, but misses the point, because the whole idea of negative gearing is to offset interest costs and other losses to reduce total income, and therefore taxable income. Mr Morrison played down the heavily-redacted Treasury submission. “The numbers in the document released by Treasury are not Treasury numbers, but are a summary of a report from an ANU associate professor, Ben Phillips, that Labor uses to justify their negative gearing policy,” he said.
The previously reported RBA FOI had rebutted one of the government’s principal arguments against negative gearing namely that there would be a collapse in home prices. The Grattan Institute had argued for negative gearing reform. You can read the DFA research archive on negative gearing here.
Worth then reflecting on earlier DFA analysis which showed how complex the negative gearing questions is. We pulled data from the DFA household surveys, to examine the distribution of negative gearing. Our segmented surveys, show some of the nuances in behaviour. We start with age distribution. We find that households of all ages may use negative gearing, but more than a quarter are aged 50-59. We see the DFA household segmentation in evidence, with a number of young affluent households active aged 20-29, especially using an investment property as an alternative to buying their own place to live. We discussed this before. As we progress up the age bands, we see a strong representation by the more affluent segments, including mature stable families and exclusive professionals. In later life, wealth seniors are also active, especially in the 60-69 year bands. So negative gearing is being used by households across all age groups.
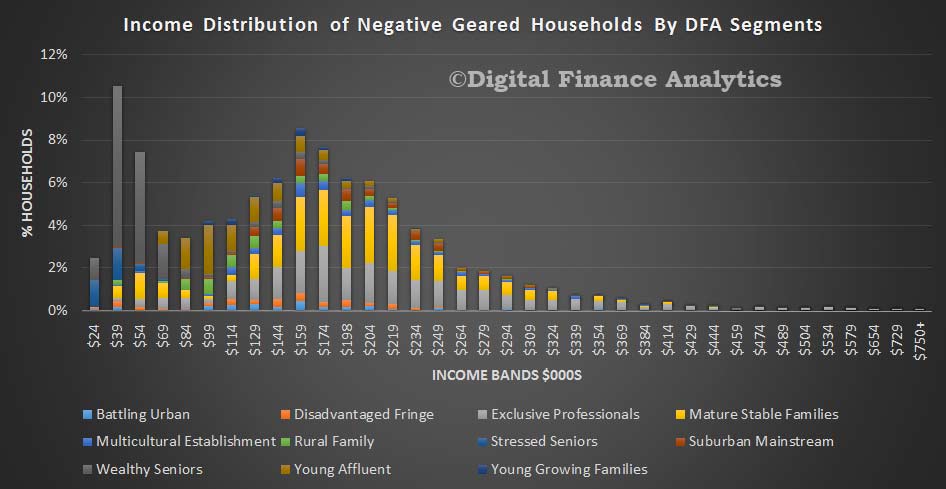 Our survey suggests that negative gearing, whilst it is spread across the income bands, is indeed concentrated among more affluent households. Four segments, exclusive professionals, mature steady state, wealthy seniors and young affluent households contain the lions share of negative geared investment property. These segments are at different life stages, have different income profiles, and different strategies. For example the young affluent are often using investment property as a potential on-ramp to later owner occupied purchase, whereas wealthy seniors are all about income, and the others more wealth creation.
This analysis shows how complex the true situation is. Prospective changes are likely to impact different segments in diverse ways and there is plenty potential for spill-over impacts and unintended consequences. But the truth is, most negative gearing resides among more affluent households. The current settings are not correct.
One thought on “The Negative Gearing Salvos Continue”