
Excellent speech from Lawrence Schembri, Deputy Governor, Canadian Association for Business Economics on house price trends. The speech, which is worth reading, contains a number of insightful charts. Australian data is included. He looks at both supply and demand issues, and touches on macroprudential. You can watch the entire speech.
I have highlighted some of the main points:
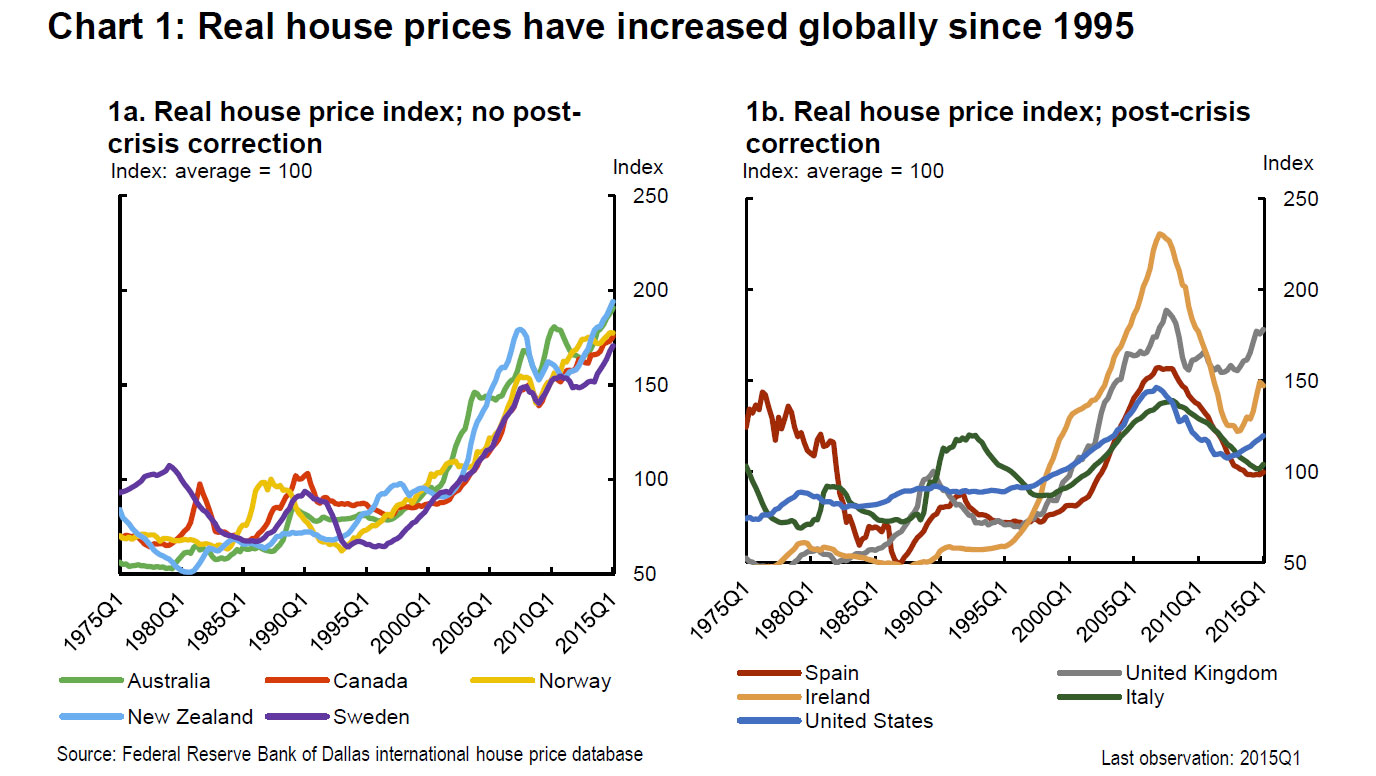
First, Chart 1 shows indexes of real house prices since 1975 for two sets of advanced economies. Chart 1a shows Canada and a set of comparable small, open economies (Australia, New Zealand, Norway and Sweden) with similar macro policy frameworks and similar experiences during and after the global financial crisis. In particular, they did not have sizable post-crisis corrections in house prices. For comparison purposes, Chart 1b shows a second set of advanced economies that did experience significant and persistent post-crisis declines in house prices.
 Since 1995, house prices in Canada and the set of comparable countries have increased faster than nominal personal disposable income (Chart 2a). During this period, all of these countries experienced solid income growth, with the strongest growth in Norway and Sweden (Chart 2b).
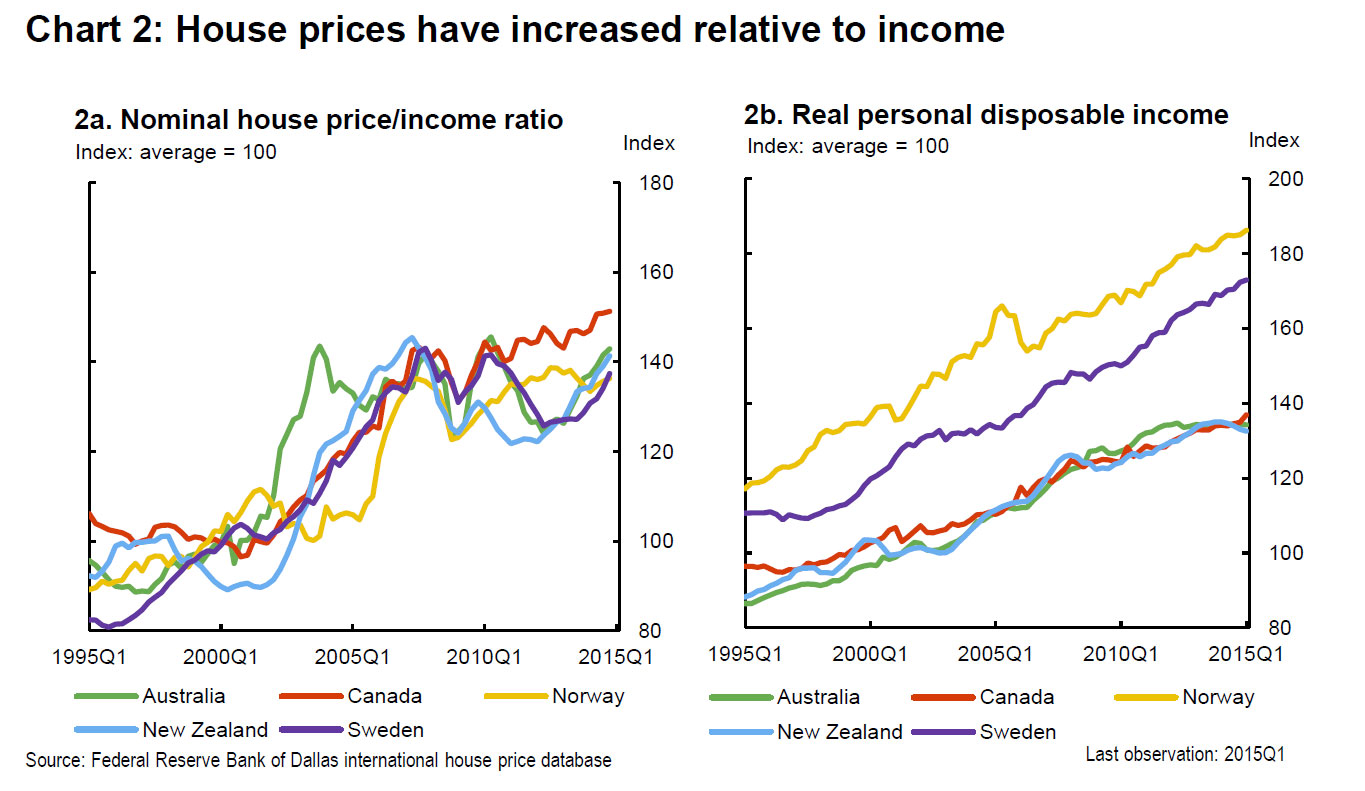 During the global financial crisis, these countries also experienced house price corrections. This caused the ratios of house prices to income to decline temporarily, after which they continued climbing.
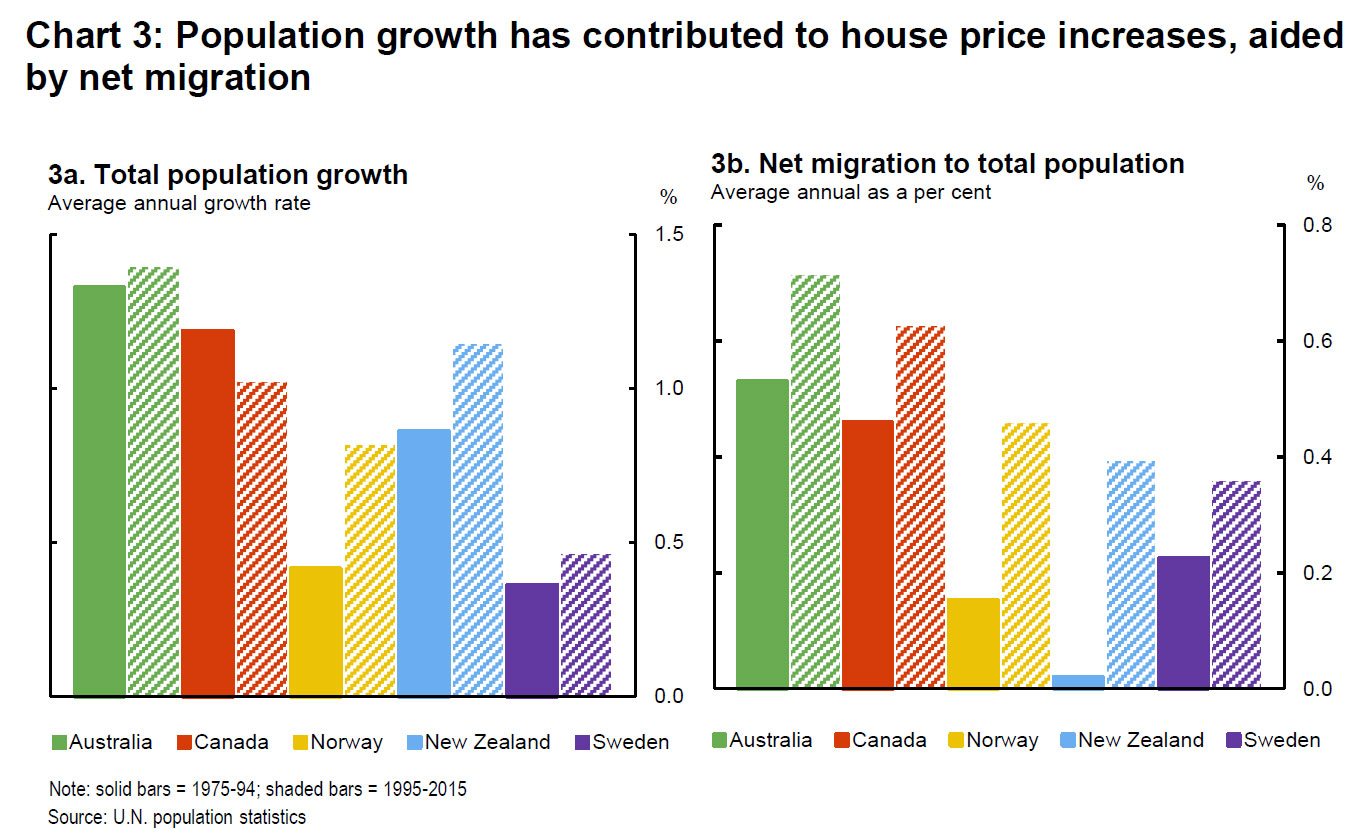
One of the factors that has affected population growth rates is migration. Net migration was highest in Australia and Canada over the entire sample. In addition, net migration increased importantly in all five countries in the second half of the sample period (Chart 3b)
 In Australia, Canada and New Zealand, the rate of population growth of the approximate house-owning cohort of those aged 25 to 75 declined in the second part of the sample period. This likely reflects the aging of their populations as the postwar baby boom generation moved from youth into middle age (Chart 4). Nonetheless, the growth rate of this cohort still remains well above 1 per cent for these three countries.
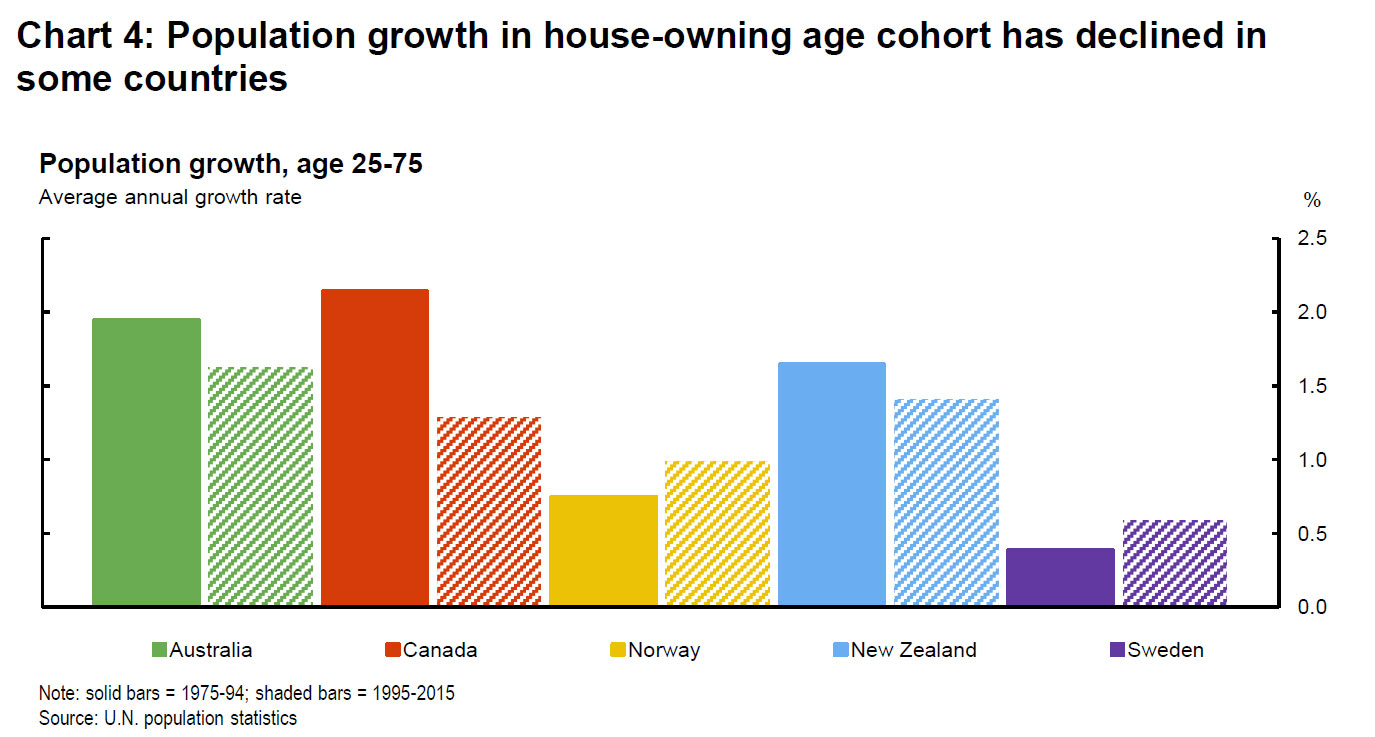 Chart 9 provides some suggestive evidence on the impact of land-use regulations on median price-to-income ratios. Many of the cities with higher ratios also have obvious geographical constraints—Hong Kong and Vancouver are good examples—so the two sources of supply restrictions likely interact to put upward pressure on prices.
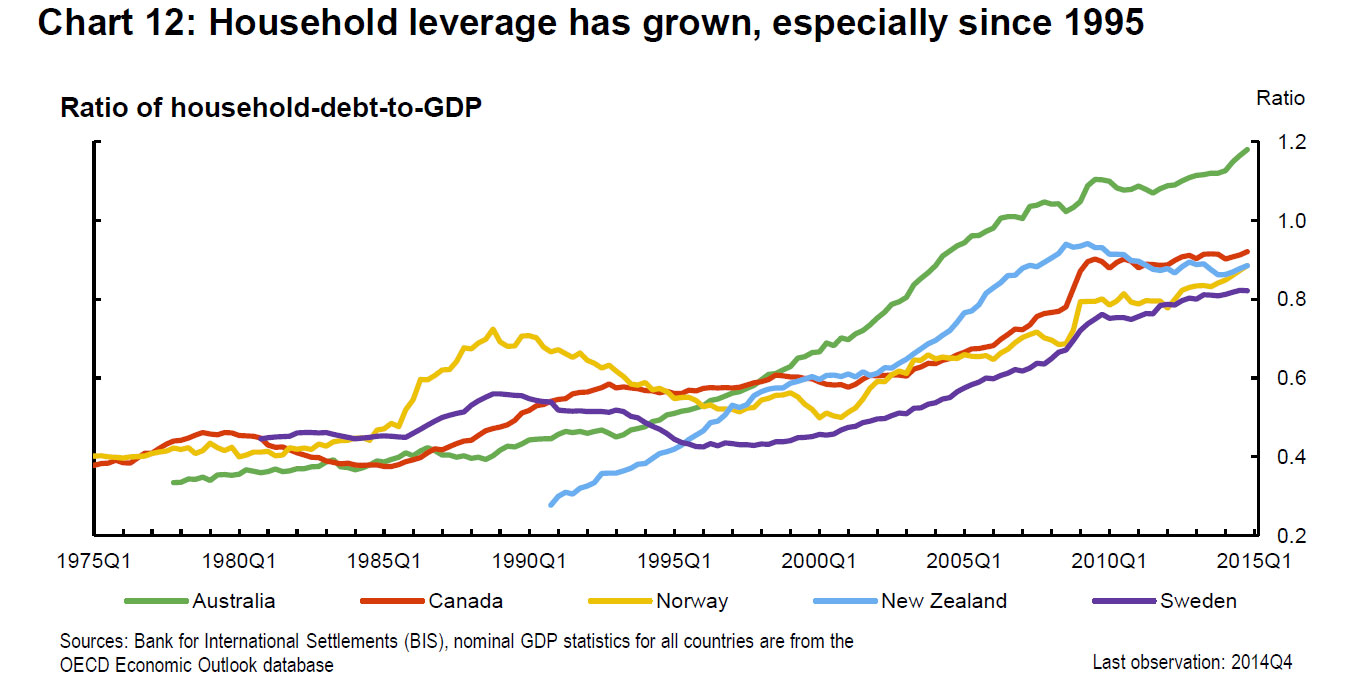
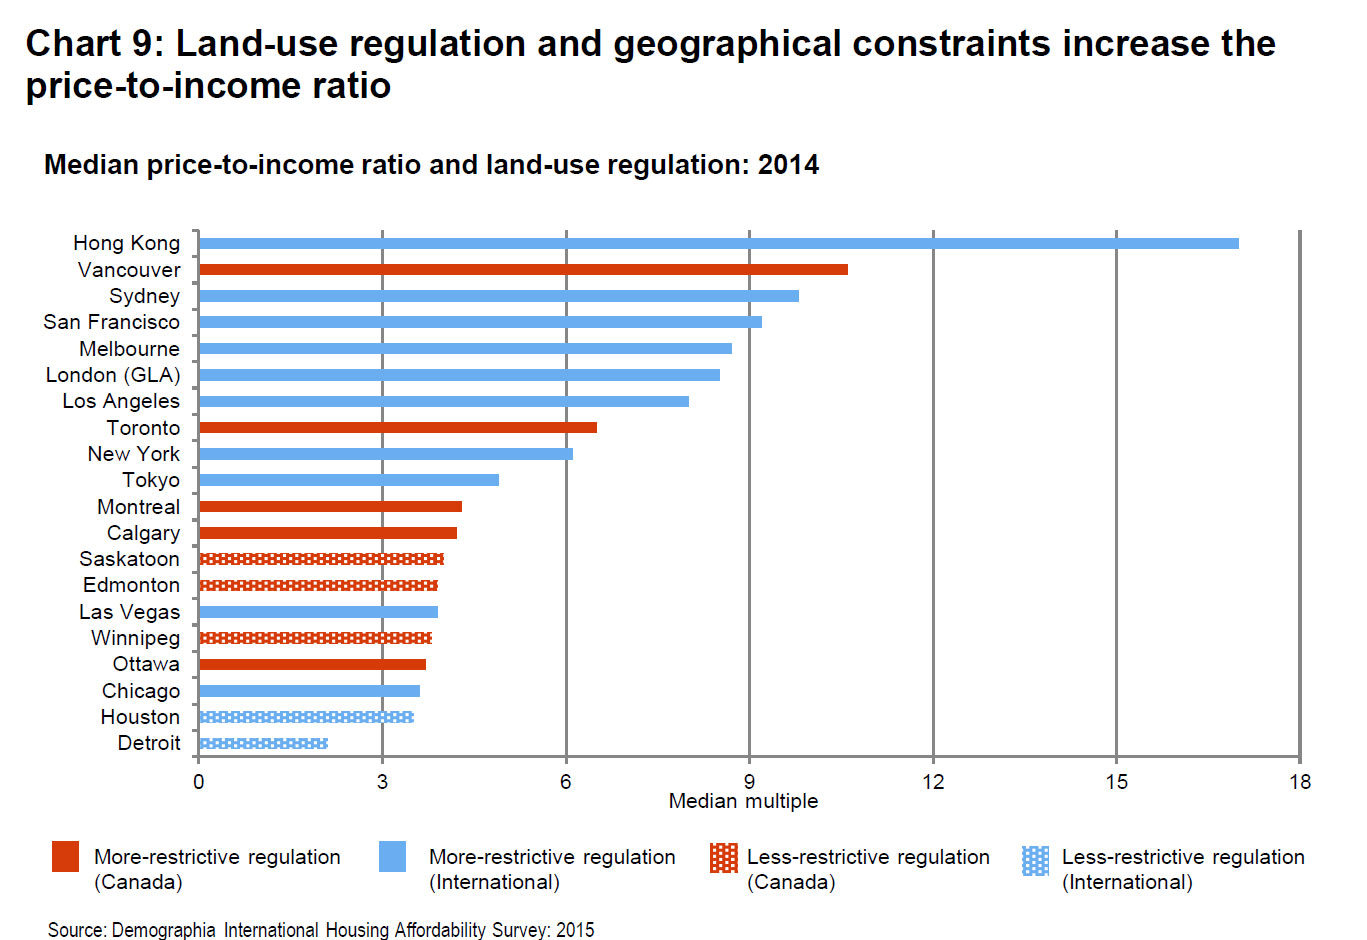 When we look at the post-crisis experiences of the countries in our comparison group, they have similar levels of household leverage, measured by household debt as a ratio of GDP (Chart 12). Household leverage has risen along with house prices, as households have taken advantage of low post-crisis interest rates. The one exception is New Zealand, where a modest degree of household deleveraging seems to have occurred. For Canada, the ratio of household debt to GDP has risen since 1975, although the growth of this ratio has notably declined since 2010. For Sweden and Norway, the ratio also grew at a modest pace in the post-crisis period. Note Australia has the highest ratios.
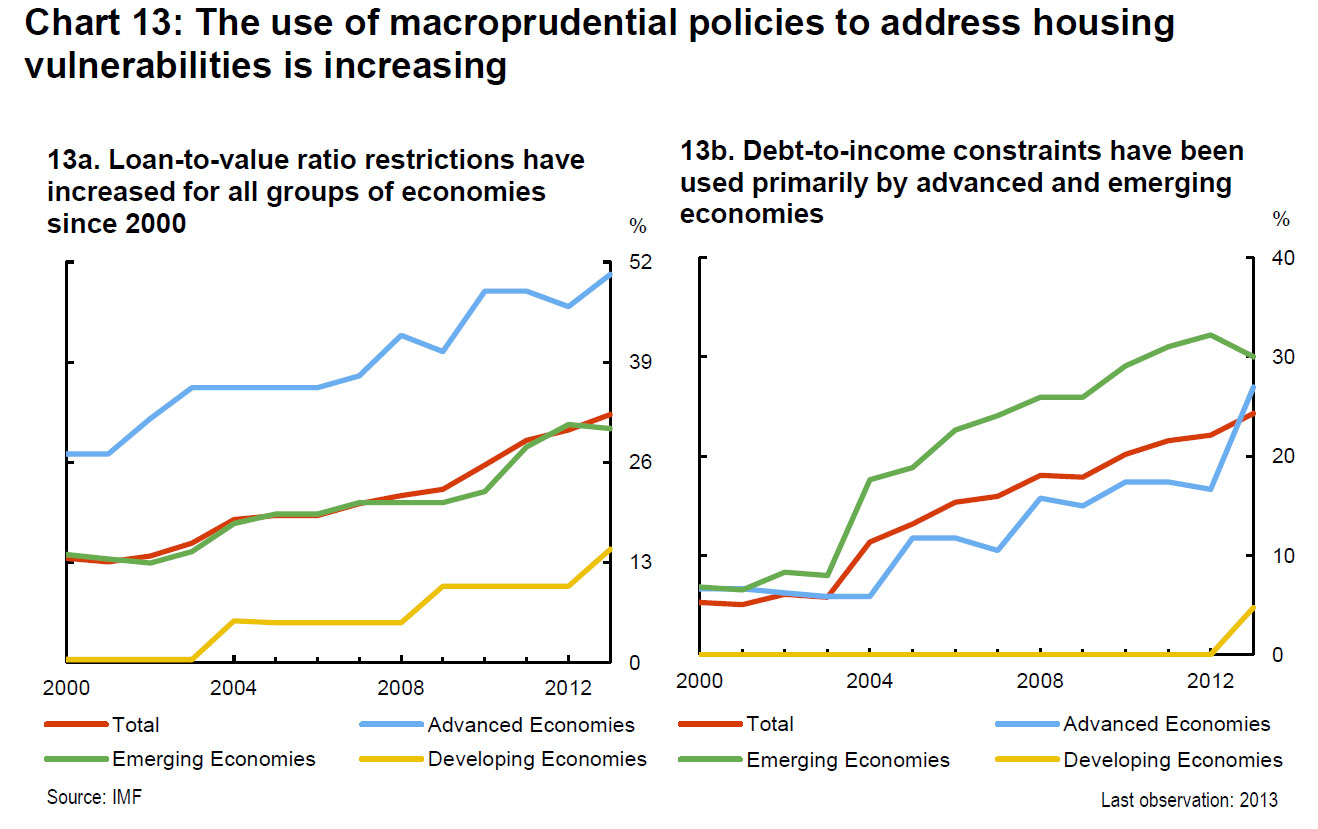
 Charts 13a and b draw on recent work by the IMF, which shows that macroprudential policies in the form of maximum loan-to-value (LTV) or debt-to-income (DTI) ratios have tightened across a broad range of countries over the past 10 years. The IMF’s research, as well as that of other economists, has found evidence suggesting that the tightening has helped to: reduce the procyclicality of household credit and bank leverage; moderate credit growth;
improve the creditworthiness of borrowers; and lower the rate of house price growth.
The most effective macroprudential policies to date appear to have been the imposition of maximum LTV and DTI constraints. Increased capital weights on bank holdings of mortgages have also had an impact. While long-term evidence on these instruments is not yet available, permanent measures that address structural regulatory weaknesses and that are relatively straightforward to implement and supervise will likely be the most effective over time.
 Interesting to note that in Canada, they have had four successive rounds of macroprudential tightening, primarily in terms of the rules for insured mortgages. The maximum amortization period for insured loans has been shortened from 40 years to 25. LTV ratios have been lowered to 95 per cent for new mortgages, and 80 per cent for refinancing and investor properties. These latter two changes effectively eliminate new insurance for refinancing and investor properties. Qualification criteria such as limits on the total debt-service ratio and the gross debt-service ratio, as well as requirements for qualifying interest rates, have also been tightened.
Conclusion
Let me conclude with a few key points from the mountain of facts, graphs and analysis that I have reviewed with you today. As I mentioned at the outset, the purpose of my presentation is to help provide more context for an informed discussion about housing and house prices given their importance to the Canadian economy and the financial system.
First, real house prices have been rising relative to income in Canada and other comparable countries for about 20 years. There are many possible explanations, mostly from the demand side, but also from the supply side.
Second, in terms of demand, demographic forces, notably migration and urbanization, have played a role in the evolution of house prices, as have improving credit conditions through lower global real long-term interest rates and financial liberalization and innovation. There are, of course, other demand factors that warrant more data and analysis, including the impacts of foreign investment and possible preference shifts.
Third, in terms of supply, the constraints imposed by geography and regulation have decreased housing supply elasticity, especially in urban areas. This reduced supply elasticity has interacted with demand shifts toward more urbanization to push up house prices in major cities.
Fourth, the credible and effective macro and financial policy frameworks in place in Canada and the other countries considered here have contributed to a high degree of macroeconomic and financial stability. Consequently, in the face of a protracted global recovery, their countercyclical policies successfully underpinned domestic demand in the post-crisis period. The resulting strength in the housing market has increased household imbalances, but the risks stemming from these vulnerabilities have been well managed by complementary macroprudential policies.
The experience in these countries therefore suggests that macroprudential policies that address structural weaknesses in the regulatory framework are best suited for mitigating such financial vulnerabilities. They reduce tail risks to financial stability and enhance the overall resilience of the financial system.