
We have highlighted the rise in mortgage stress. We identified rising mortgage rates, underemployment, higher costs of living and flat incomes as causes of stress. But we need to stop and ask how come more households are under mortgage pressure than ever?
 After all, lenders should have been operating with at least a 2.5% buffer between the mortgage rate offered and the rate they use for affordability assessment, and they should be looking at the household spending to ensure they can afford the loan. Failure to do this would make the loan “unsuitable” and under the lending provisions if loans were not made in compliance with the responsible lending provisions, the borrower can dispute the loan.
Mortgage stress should just not be as high as it is these guidelines were followed. Whilst interest rates have moved from their lows, thanks to out of cycle rises, (which in sum for owner occupied borrowers amount to around 30-40 basis points, whereas interest only loans, and investor loans are now 75-100 basis points) are still well within the 2.5% mortgage affordability rate buffer.
To try and unpick this, we have been looking at real household expenditure budgets from our core market model (using our surveys and other data), and comparing this with the standard Household Expenditure Measure (HEM) used by the banks.
HEM is based on more than 600 items in the ABS Household Expenditure Survey (HES). The HEM is calculated as the median spend on absolute basics (food, utilities, transport, communications, kids’ clothing) and the 25th percentile spend on discretionary basics, which includes expenses like alcohol, eating out and childcare. Non-basic expenses, for example overseas holidays, are excluded from calculations.
The National Consumer Credit Protection Act regulations say that whilst banks may use a HEM to guide the analysis, they must still do more complete analysis and validate the expenditure profile by looking at statements and other evidence. Relying on HEM is not sufficient.
Whats interesting about this is that APRA said last year:
On the expense side, the major differences across ADIs seen in the original exercise related to whether the ADI used a benchmark living expenses measures, such as the Household Expenditure Measure (HEM), the customer’s own reported expenses, or a more targeted calculation of the benchmark. Most people have a hard time actually estimating their own living expenses, so the customer-declared figure may not be particularly accurate. However, the basic benchmark measures are also simplistic; scaling expense assumptions to the borrower’s income level (and potentially other factors including geography) is a more realistic and prudent approach.
About half of the ADIs in our exercise were still using the basic HEM, but others have moved to implement more sophisticated approaches or are in the process of doing so. At a minimum, all ADIs now reflect the customer’s declared living expenses where these are higher than the benchmark.
A strong alignment between the HEM calculation and the final expenses assessment might be a warning of expenses being understated.
Regulators said recently that there was often a “coincidental” alignment between HEM and actual costs, especially for more affluent purchasers.
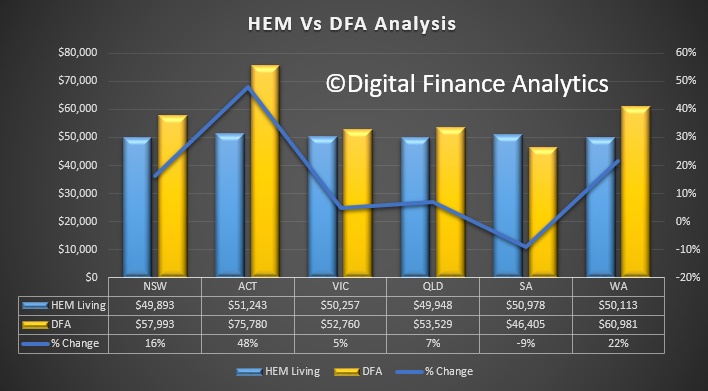
So we obtained some HEM data for a typical household in our survey, and compared the HEM output with the data on real expenditure, using the same basis of calculation as HEM.
We found that in all states except SA, the standard HEM understated household expenditure significantly, net of mortgage payments, many were more than 10% higher. ACT, WA and NSW had the highest divergence. So did lenders make sufficient allowance to actual spending in the current low growth, higher cost of living environment?
 If not, or if HEM had been used, households might have obtained a larger mortgage than could comfortably be serviced.
So, we need to ask – why the variation between HEM and reality? We suggest it may be a combination of:
- Households incomes being squeezed as costs rise and underemployment rises (households are not generally reassessed in flight by the banks)
- Banks were too generous in their initial affordability assessments and did not take actual spending sufficiently into account.
- Households did not fully disclose costs and banks did not fully check them out. HEM became the default.
Finally, we also looked across our household segments, and found that (no surprise) expenses of more affluent households were significant higher.
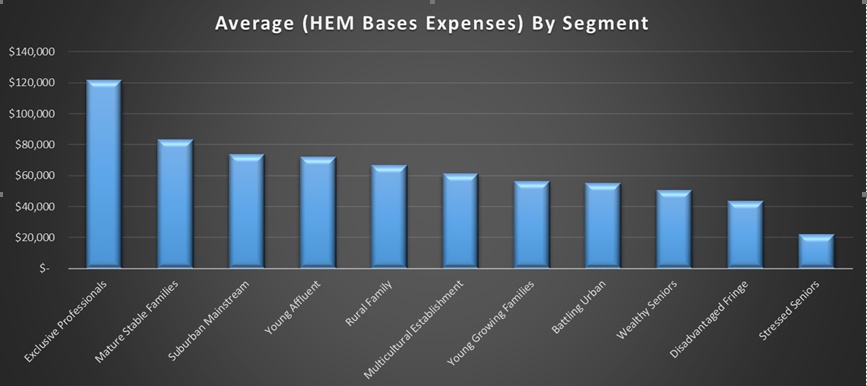 This helps to explain why we are seeing more affluent households getting into mortgage stress territory.
Should banks be obliged to review household spending patterns on a recurring basis, rather than at mortgage underwriting time? Is there merit in the regulators looking in more detail at the extent to which all lenders (including non-banks) are compliant. We suspect some lenders have been too willing to operate on lower spending buffers to enable a deal to be done.
Borrowers of course should not borrow just because the bank says they are willing to lend to a certain level. Households should prepare their own budgets and include allowance for higher mortgage rates and rising living costs. They may get a smaller loan as a result, but they will be more secure in a rising market.
Our industry contacts suggest that many lenders are reviewing their spending assessment, and that more details and granular information is now been used. However, this may nor help those who got bigger loans in easier conditions as affordability bites.
One thought on “The Affordability Conundrum”