The US 10 Year Bond Rate has now broken above 3%. It will go higher. This will put more pressure on capital market funding costs.
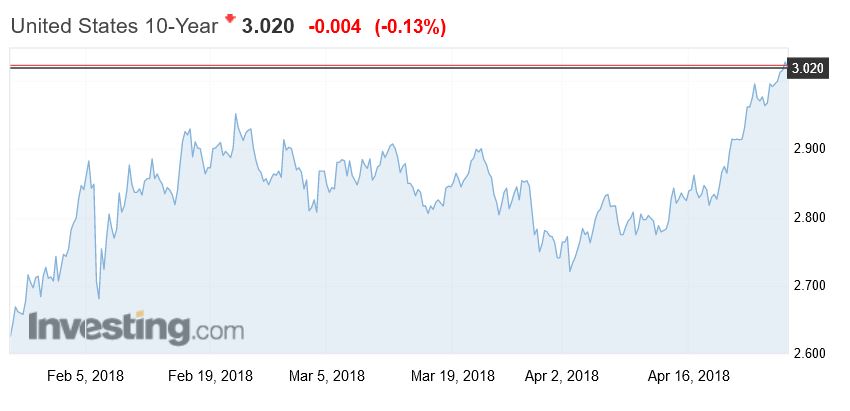 This is turn will put pressure on local funding costs.
Digital Finance Analytics (DFA) Blog
"Intelligent Insight"

The US 10 Year Bond Rate has now broken above 3%. It will go higher. This will put more pressure on capital market funding costs.
This is turn will put pressure on local funding costs.
The latest US data shows mortgage rates in the US continue higher. And more to come.
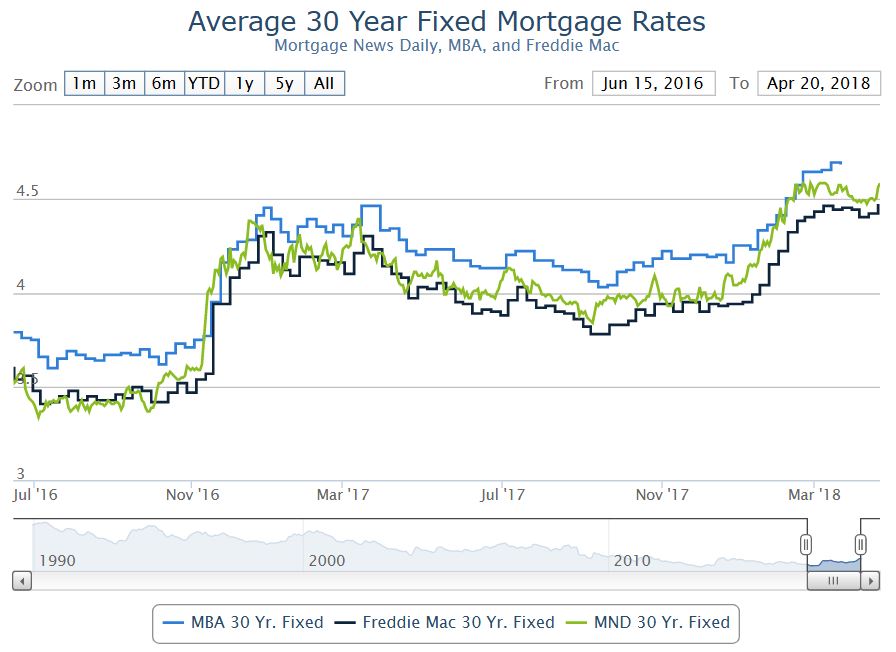 Here is the latest commentary from the Mortgage Rates Newsletter.
Let’s clear one thing up before we begin. Freddie Mac, MBA, and Ellie Mae all noted new 4-year highs in mortgage rates this week. They are all technically wrong. This has to do with the way their data is collected and/or averaged. And while I have no doubt that they are accurately conveying the results of their data collection efforts according to their methodology, there is a more accurate way to do things. Specifically, we can track actual lenders’ rate sheets every day.
Even if we take an average of that daily data, we still find that rates aren’t quite back to 4-year highs just yet. Depending on the lender, these occurred on one of the days near the end of February. In fact, some lenders’ rates from March 21st are still higher than today’s. Are we talking about very big differences between now and then? Not at all! But if we’re going to talk about rates hitting 4-year highs, we might as well be precise about it.
One thing everyone can agree on is that today’s rates are higher than yesterday’s, which in turn, were higher than Wednesday’s. The lion’s share of that move higher happened yesterday, but today’s underlying bond market movement suggests there’s a bit more pain yet to be priced-in to the average lender’s mortgage rate sheets.
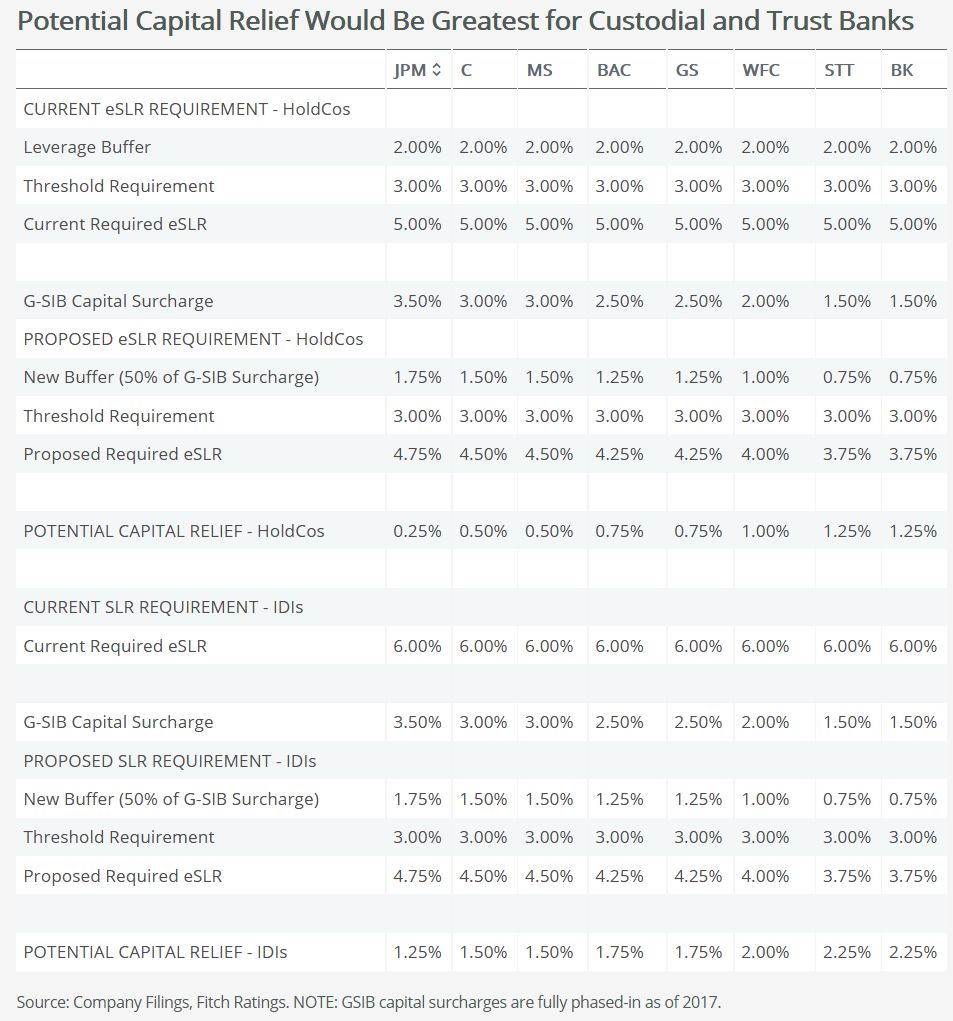
The Federal Reserve’s and the Office of the Comptroller of the Currency’s proposed changes to the enhanced supplementary leverage ratio (eSLR) and total loss-absorbing capacity (TLAC) ratio, would provide the most capital relief to trust and custodial banks relative to other U.S. global systemically important banks (GSIBs), Fitch Ratings says.
These changes are unlikely to result in near-term rating implications, though this proposal and the impact of other recently proposed rules that reduce capital requirements are credit negative for the sector. The ultimate ratings impact will depend on how individual US GSIBs respond to potentially looser regulatory standards and lower capital requirements.
The proposal would change how the US GSIBs’ eSLR and TLAC ratios are calculated to include half of their respective GSIB capital surcharge as a percentage of risk-based capital, providing the most relief to firms with the lowest relative capital risk. The Fed estimates the proposed changes would reduce the required amount of Tier 1 capital of the US GSIBs by four basis points, or approximately $400 million, and would reduce the amount of Tier 1 capital required across the lead IDI subsidiaries of the GSIBs by approximately $121 billion.
Currently, GSIBs must meet an eSLR of at least 5% at the holding company level, comprised of a minimum 3% base requirement plus a 2% standard buffer, while GSIB insured depository institution (IDI) subsidiaries need a minimum of a 6% SLR to be deemed “well capitalized.” Under the new proposals, eSLR ratios would be adjusted lower to the sum of the 3% required minimum plus 50% of the respective banks’ GSIB surcharge, instead of the prior standard. The same application of the proposed rule would apply for IDIs, replacing the 6% required minimum to be deemed well capitalized.
Amendments to the eSLR calculation, which apply to U.S. GSIBs and their IDIs, would benefit custody and trust banks the most. State Street and Bank of New York Mellon have the lowest GSIB risk-based capital surcharge of 1.5%, which could potentially result in lowering their eSLR by 1.25% at the holding company and up to 2.25% at the IDI level. The proposed amendments don’t incorporate the changes presented in the Senate bill to ease Dodd-Frank Act requirements, which would allow the trust and custody banks to remove certain safe assets such as Fed deposits from their leverage ratios if the bank was predominantly engaged in custodial banking.
Under the proposed legislation, the amount of required eligible debt required for total loss absorbing capital (TLAC) would also fall. The bank holding company TLAC leverage buffer, like the SLR calculation, would be also modified to 50% of the GSIB risk-based capital surcharge buffer, instead of a fixed 2% leverage buffer. The leverage component of the long-term minimum debt requirement would be cut to 2.5% from 4.5% previously.
The U.S. economy is humming along, but we believe that the economy will weaken and likely fall into recession sometime in 2020 as the boost from the fiscal stimulus fades. There is considerable uncertainty in the timing of the next recession, but the U.S. bond market increases our concerns about the economy in the next couple of years.
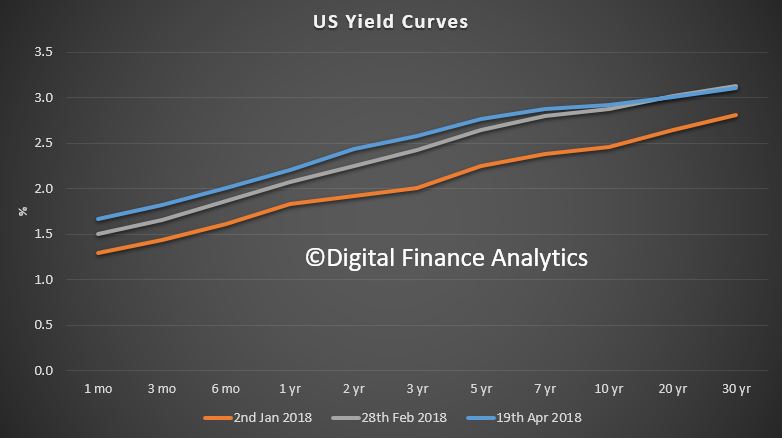
Since the mid-1960s, the yield curve, or the difference between the 10-year Treasury yield and three month yield, has been nearly perfect in predicting recessions. On average a recession occurs 15 months after the yield curve inverts. The shortest time between an inversion and a recession was eight months in the early 1970s. The longest was 20 months in the late 1960s. It has given only one false signal, in 1966, when a slowdown—but not an official recession—followed an inversion.
Assuming our forecast for the next downturn is correct, the yield curve should invert late this year or early next. Further flattening in the yield curve doesn’t alter our forecast for GDP growth this year, but it does pose some downside risk. As the yield curve flattens, it could weigh on the collective psyche, particularly among investors. Investors are a fickle bunch, and the further flattening in the yield curve could increase the odds of a sudden decline in stock prices, which if significant and persistent could have noticeable economic costs.
Knowing why the yield curve is flattening is important in assessing whether there should be concern about growth this year and early next. If it is because the lower long-term rates are fueled by concerns about U.S. growth, that would raise a red flag. This doesn’t appear to be the case now, because the 10-year U.S. Treasury yield has been hovering generally between 2.8% and 2.9% since the beginning of February and is up 40 basis points since the end of 2017. Therefore, the flattening in the yield curve is coming from the short end, which has put the focus on the Fed. But the central bank is only part of the story.
The flattening in the yield curve is less troubling for the economy in the very short run if it’s occurring because the economy is doing well and the Fed is raising short-term rates while the long-term rate continues to be depressed by the size of the Fed’s and other global central banks’ balance sheets.
It doesn’t appear that the dynamics for long-term rates will change significantly soon, so the next rate hike by the Fed, likely in June, will flatten the yield curve further. Therefore, the Fed will feel the heat for flattening the yield curve, potentially fanning concerns that it is headed for a policy mistake that will end this expansion.
However, the Fed isn’t the only reason that the yield curve is flattening. The Treasury Department has ramped up its issuance in anticipation of a higher deficit from last year’s tax overhaul and a two-year budget deal that will increase federal spending over the next two years. Over the past few months, Treasury net issuance of bills has spiked. Net issuance of bills in March was $211 billion following a net $111 billion in February. The increase in supply has driven short-term interest rates higher. In fact, prior to the Fed rate hike in March, the spread between the three-month Treasury bill and the fed funds rate was the widest over the past 15 years.
We see the odds rising that the yield curve inverts by the end of this year. This would increase the odds of a recession in the subsequent 12 months.
From The St. Louis Fed On The Economy Blog
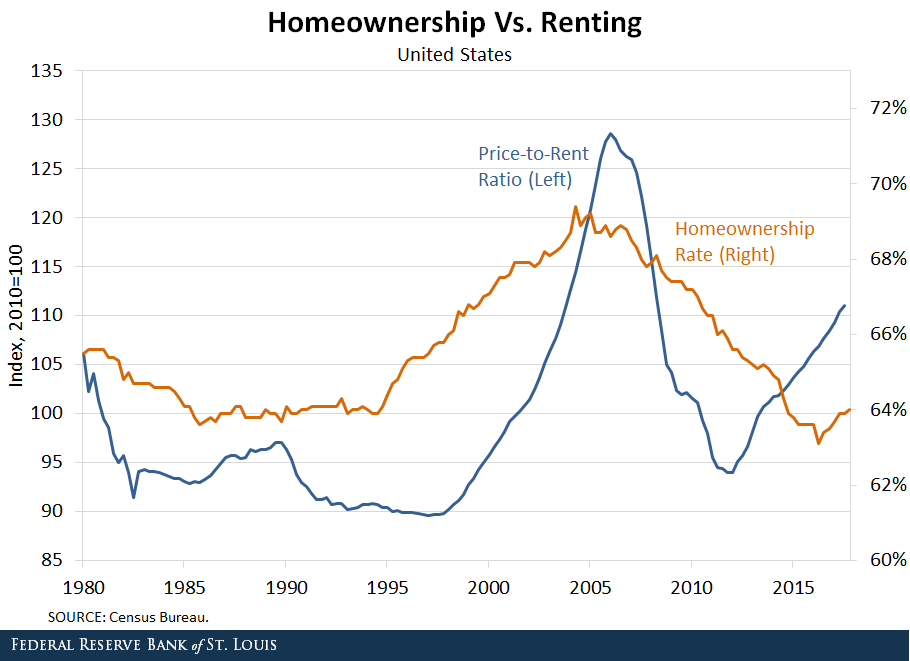
An excellent FED post which discusses the decoupling of home ownership from home price rises. We think the answer is simple: the financialisation of property and the availability of credit at low rates explains the phenomenon.
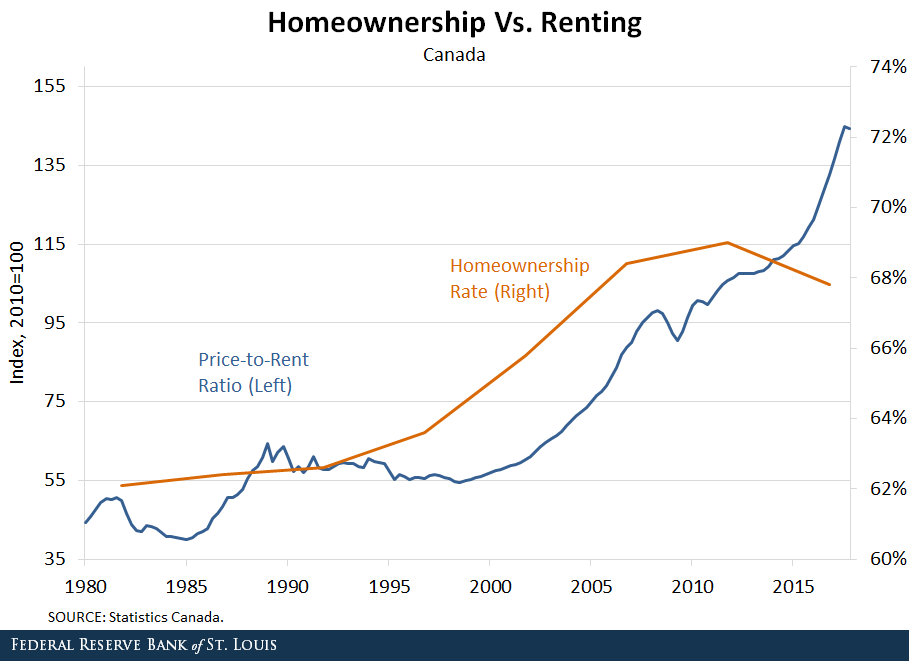
In the aftermath of WWII, several developed economies (such as the U.K. and the U.S.) had large housing booms fueled by significant increases in the homeownership rate. The length and the magnitude of the ownership boom varied by country, but many of these countries went from a nation of renters to a nation of owners by around the late 1970s to mid-1980s.

Historically, the cost of buying a house, relative to renting, has been positively correlated with the percent of households that own their home. From 1996 to 2006, both the price of houses and the homeownership rate increased in the U.S. This increasing trend ended abruptly with the global financial crisis that drove house prices and homeownership rates to historically low levels.
It is reasonable to expect prices and homeownership to move in the same direction. A decrease in the number of people who want to buy homes to live in could lead to a decrease in both prices and homeownership. Similarly, an increase in the number of people buying homes to live in could lead to an increase in both prices and homeownership.
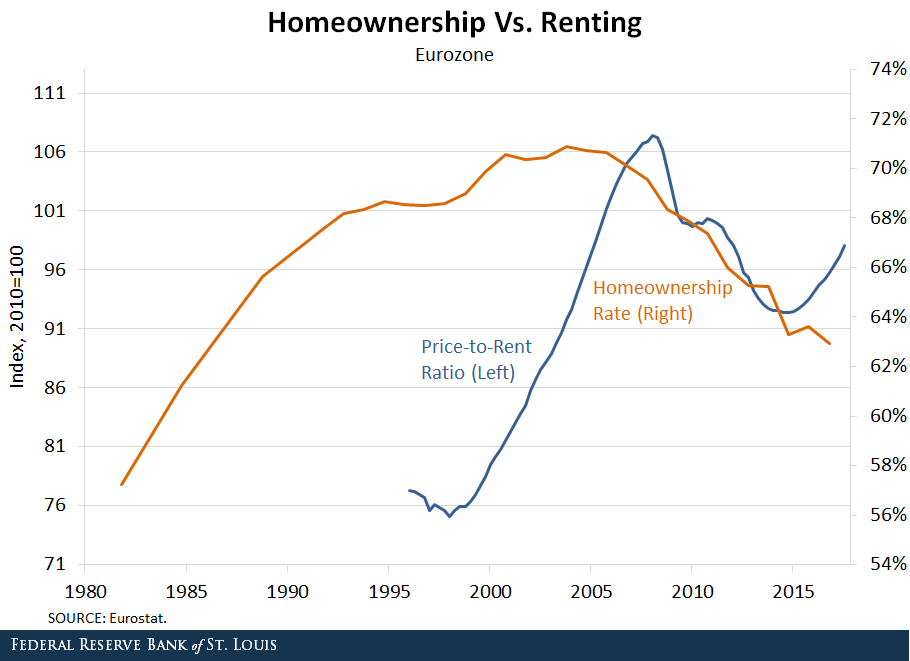
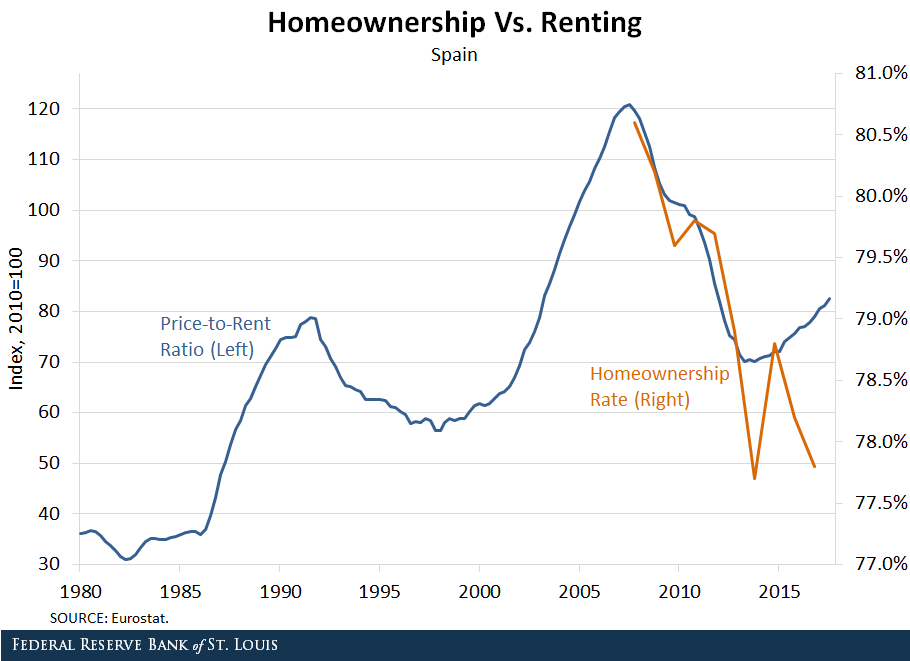
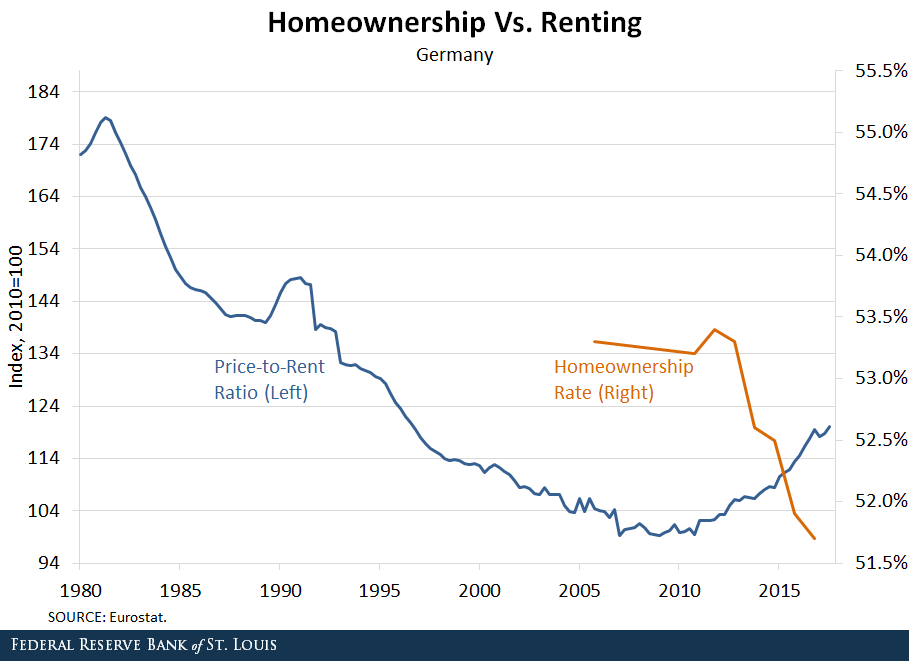
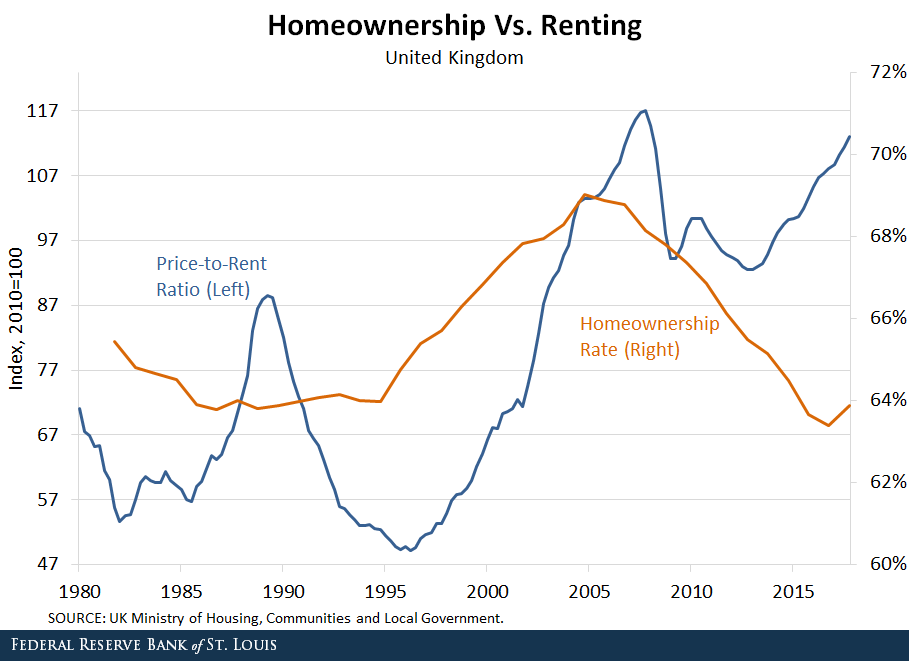
However, recent evidence indicates that the cost of buying a home has increased relative to renting in several of the world’s largest economies, but the share of people owning homes has decreased. This pattern is occurring even in countries with diverging interest rate policies. It is important to delve into this fact and try to find potential explanations. (For trends in homeownership rates and price-to-rent ratios for several developed economies, see the figures at the end of this post.)
Increasing Cost of Housing
The price-to-rent ratio measures the cost of buying a home relative to the cost of renting. Factors like credit conditions or demand for homes as an investment asset affect the price of houses but not the price of rentals. These and other factors cause the price-to-rent ratio to move.
Over the period 1996-2006, the cost of buying a home grew more quickly than the cost of renting in many large economies. For example, the price-to-rent ratio in the U.S. increased by more than 30 percent between 2000 and 2006. Even larger increases occurred in the U.K. and France, where the price-to-rent ratio rose by nearly 80 percent over the same period.
The price-to-rent ratio declined in the wake of the housing crisis in the U.S., the eurozone, Spain and the U.K., but in the past few years, it has started to increase again. The price of houses is again increasing more quickly than the price of rentals.
Decreasing Homeownership
However, the homeownership rate has not increased along with the price-to-rent ratio. The homeownership rate (the percent of households that are owner-occupied) has fallen in several large economies:
- In the U.S., the homeownership rate fell from around 69 percent before the recession to less than 64 percent in 2016.
- In the U.K., the rate fell from nearly 69 percent to around 63 percent.
- The homeownership rates in Germany and Italy have also fallen.
Diverging Policies
The pattern of increasing house prices and decreasing homeownership has occurred even in countries with diverging monetary policies:
- By 2016, the Federal Reserve had ended quantitative easing and had begun raising rates in the U.S.
- In contrast, the Bank of England and the European Central Bank continued quantitative easing throughout 2016 and reduced rates.
Nonetheless, the homeownership rate continued to fall in the U.S., the U.K. and many parts of Europe, while the price-to-rent ratio continued to increase.
Housing Supply
Several factors could be driving the decoupling of the price-to-rent ratio and the homeownership rate. From the housing supply side, there is a trend toward decreased construction of starter and midsize housing units.
Developers have increased the construction of large single-family homes at the expense of the other segments in the market. From 2010 to 2016, the fraction of new homes with four or more bedrooms increased from 38 percent to 51 percent.
This limited supply, particularly for starter homes, could result in increased prices for those homes and fewer new homeowners. One possible factor is regulatory change. The National Association of Home Builders claims that, on average, regulations account for 24.3 percent of the final price of a new single-family home. Recent increases in regulatory costs could have encouraged builders to focus on larger homes with higher margins. Supply may be just reacting to developments in demand that we discuss next.
Housing Demand
From the demand side, there are three leading explanations, which are likely complementary and self-reinforcing:
- Changes in preferences toward homeownership
- Changes in access to mortgage credit
- Changes in the investment nature of real estate
Preferences for homeownership may have changed because households who lost their homes in foreclosure post-2006 may be reluctant to buy again. Also, younger generations may be less likely to own cars or houses and prefer to rent them.
Demand for ownership has also decreased because credit conditions are tighter in the post-Dodd Frank period.
Real Estate Investment
The previous demand arguments can explain why the price-to-rent ratio dropped post-2006. As rents grew relative to home prices, together with the low returns of safe assets, rental properties became a more attractive investment. This attracted real estate investors who bid up prices while depressing the homeownership rate.
Moreover, builders increased their supply of apartments and other multifamily developments. From 2006 to 2016, single-family construction projects declined from 81 percent to 67 percent of all housing starts.
There are several types of real estate investors:
- “Mom and dad” investors looking for investment income
- Foreign investors who have increased real estate prices in many of the major cities of the world
- Institutional landlords like Invitation Homes or American Homes 4 Rent
In fact, since 2016 the real estate industry group has been elevated to the sector level, effective in the S&P U.S. Indices.
In addition, the widespread use of internet rental portals such as Airbnb and VRBO has increased the opportunity to offer short-term leases, increasing the revenue stream from rental housing.
There are several potential explanations, but more research is needed to determine the cause of the decoupling of house prices from homeownership rates and what it means for the economy.
Authors: Carlos Garriga, Vice President and Economist; Pedro Gete, IE Business School; and Daniel Eubanks, Senior Research Associate
In another sign of weakening banking supervision, the FED proposes new rules to “tailor leverage ratio requirements“. Tailoring appears to mean reduce!
The Federal Reserve Board and the Office of the Comptroller of the Currency (OCC) on Wednesday proposed a rule that would further tailor leverage ratio requirements to the business activities and risk profiles of the largest domestic firms.
Currently, firms that are required to comply with the “enhanced supplementary leverage ratio” are subject to a fixed leverage standard, regardless of their systemic footprint. The proposal would instead tie the standard to the risk-based capital surcharge of the firm, which is based on the firm’s individual characteristics. The resulting leverage standard would be more closely tailored to each firm.
The proposed changes seek to retain a meaningful calibration of the enhanced supplementary leverage ratio standards while not discouraging firms from participating in low-risk activities. The changes also correspond to recent changes proposed by the Basel Committee on Banking Supervision. Taking into account supervisory stress testing and existing capital requirements, agency staff estimate that the proposed changes would reduce the required amount of tier 1 capital for the holding companies of these firms by approximately $400 million, or approximately 0.04 percent in aggregate tier 1 capital.
Enhanced supplementary leverage ratio standards apply to all U.S. holding companies identified as global systemically important banking organizations (GSIBs), as well as the insured depository institution subsidiaries of those firms.
Currently, GSIBs must maintain a supplementary leverage ratio of more than 5 percent, which is the sum of the minimum 3 percent requirement plus a buffer of 2 percent, to avoid limitations on capital distributions and certain discretionary bonus payments. The insured depository institution subsidiaries of the GSIBs must maintain a supplementary leverage ratio of 6 percent to be considered “well capitalized” under the agencies’ prompt corrective action framework.
At the holding company level, the proposed rule would modify the fixed 2 percent buffer to be set to one half of each firm’s risk-based capital surcharge. For example, if a GSIB’s risk-based capital surcharge is 2 percent, it would now be required to maintain a supplementary leverage ratio of more than 4 percent, which is the sum of the unchanged minimum 3 percent requirement plus a modified buffer of 1 percent. The proposal would similarly tailor the current 6 percent requirement for the insured depository institution subsidiaries of GSIBs that are regulated by the Board and OCC.
Welcome to the Property Imperative Weekly to 07 April 2018.
Watch the video, or read the transcript.
In this week’s digest of finance and property news, we start with Paul Keating’s (he of the recession we had to have fame), comment that the housing boom is really over at the recent AFR conference.
He said that the banks were facing tighter controls as a result of the Basel rules on capital adequacy, while financial regulators had had a “gutful” of them. This was likely to lead to changes that would restrict the banks’ ability to lend. He cited APRA’s recent interventions in interest only loans as one example, as they restrict their growth. Keating also said the royal commission into misconduct in the banking and financial services sector would also “make life harder” for the banks and pointed out that banks did not really want to lend to business these days and would “rather just do housing loans”. Finally, he spoke of the “misincentives” within the big banks to grow their business by writing new mortgages, including having a high proportion of interest-only lending.
Anna Bligh speaking at the AFR event, marked last Tuesday her first year as CEO of the Australian Banking Association (ABA) – but said she feels “like 500 years” have already passed. Commenting on the Royal Commission she warned that credit could become tighter ahead. The was she said an opportunity for a major reset, not only in how we do banking but how we think about it, its place in our lives, its role in our economy and, most of all, it’s trustworthiness”.
At the same conference, Rod Simms the Chair of the ACCC speech “Synchronised swimming versus competition in banking” He discussed the results of their recent investigation into mortgage pricing, and also discussed the broader issues of competition versus financial stability in banking. He warned that the industry should be aware of, and respond to, the fact that the drive for consumers to get a better deal out of banking is shared by many beyond the ACCC. Every household in Australia is watching. You can watch our video blog on this for more details.
He specifically called out a lack of vigorous mortgage price competition between the five big Banks, hence “synchronised swimming”. Indeed, he says discounting is not synonymous with vigorous price competition. They saw evidence of communications “referring to the need to avoid disrupting mutually beneficial pricing outcomes”.
He also said residential mortgages and personal banking more generally make one of the strongest cases for data portability and data access by customers to overcome the inertia of changing lenders.
Finally, on competition. he says if we continue to insulate our major banks from the consequences of their poor decisions, we risk stifling the cultural change many say is needed within our major banks to put the needs of their customers first. Vigorous competition is a powerful mechanism for driving improved efficiency, and also for driving improved price and service offerings to customers. It can in fact lead to better stability outcomes.
This puts the ACCC at odds with APRA who recent again stated their preference for financial stability over competition – yet in fact these two elements are not necessarily polar opposites!
Then there was the report from the good people at UBS has published further analysis of the mortgage market, arguing that the Royal Commission outcomes are likely to drive a further material tightening in mortgage underwriting. As a result, they think households “borrowing power” could drop by ~35%, mainly thanks to changes to analysis of expenses, as the HEM benchmark, so much critised in the Inquiry, is revised. Their starting point assumes a family of four has living expenses equal to the HEM ‘Basic’ benchmark of $32,400 p.a. (ie less than the Old Age Pension). This is broadly consistent with the Major banks’ lending practices through 2017. As a result, the borrowing limits provided by the banks’ home loan calculators fell by ~35% (Loan-to-Income ratio fell from ~5-6x to ~3-4x). This leads to a reduction in housing credit and a further potential fall in home prices.
Our latest mortgage stress data, which was picked by Channel Nine and 2GB, thanks to Ross Greenwood, Across Australia, more than 956,000 households are estimated to be now in mortgage stress (last month 924,500). This equates to 30.0% of households. In addition, more than 21,000 of these are in severe stress, no change from last month. We estimate that more than 55,000 households risk 30-day default in the next 12 months. We expect bank portfolio losses to be around 2.8 basis points, though with losses in WA are higher at 4.9 basis points. Flat wages growth, rising living costs and higher real mortgage rates are all adding to the burden. This is not sustainable and we are expecting lending growth to continue to moderate in the months ahead as underwriting standards are tightened and home prices fall further”. The latest household debt to income ratio is now at a record 188.6. You can watch our separate video blog on this important topic.

ABS data this week showed The number of dwellings approved in Australia fell for the fifth straight month in February 2018 in trend terms with a 0.1 per cent decline. Approvals for private sector houses have remained stable at around 10,000 for a number of months. But unit approvals have fallen for five months. Overall, building activity continues to slow from its record high in 2016. And the sizeable fall in the number of apartments and high density dwellings being approved comes at a time when a near record volume are currently under construction. If you assume 18-24 months between approval and completion, then we still have 150,000 or more units, mainly in the eastern urban centres to come on stream. More downward pressure on home prices. This helps to explain the rise in 100% loans on offer via some developers plus additional incentives to try to shift already built, or under construction property.
CoreLogic reported last week’s Easter period slowdown saw 670 homes taken to auction across the combined capital cities, down significantly on the week prior when a record number of auctions were held (3,990). The lower volumes last week returned a higher final clearance rate, with 64.8 per cent of homes selling, increasing on the 62.7 per cent the previous week. Both clearance rate and auctions volumes fell across Melbourne last week, with only 152 held and 65.5 per cent clearing, down on the week prior when 2,071 auctions were held across the city returning a slightly higher 65.8 per cent success rate.
Sydney had the highest volume of auctions of all the capital city auction markets last week, with 394 held and a clearance rate of 67.9 per cent, increasing on the previous week’s 61.1 per cent across a higher 1,383 auctions.
Across the smaller capital cities, clearance rates improved week-on-week in Canberra, Perth and Tasmania; however, volumes were significantly lower across each market last week compared to the week prior.
Across the non-capital city auction markets, the Geelong region recorded the strongest clearance rate last week with 100 per cent of the 20 auction results reporting as successful.
The number of homes scheduled to go to auction this week will increase across the combined capital cities with 1,679 currently being tracked by CoreLogic, up from last week when only 670 auctions were held over the Easter period slowdown.
Melbourne is expected to see the most significant increase in volumes this, with 669 properties scheduled for auction, up from 152 auctions held last week. In Sydney, 725 homes are set to go to auction this week, increasing on the 394 held last week.
Outside of Sydney and Melbourne, each of the remaining capital cities will see a higher number of auctions this week compared to last week.
Overall auction activity is set to be lower than one year ago, when 3,517 were held over what was the pre-Easter week last year.
Finally, with local news all looking quite negative, let’s look across to the USA as the most powerful banker in the world, JPMorgan Chase CEO Jamie Dimon, just released his annual letter to shareholders. Given his bank’s massive size (it earned $24.4 billion on $103.6 billion in revenue last year) and reach (it’s a giant in consumer/commercial banking, investment banking and wealth management), Dimon has his figure on the financial pulse.
He says that’s while the US economy seems healthy today and he’s bullish for the “next year or so” he admits that the US is facing some serious economic headwinds.
For one, he’s concerned the unwinding of quantitative easing (QE) could have unintended consequences. Remember- QE is just a fancy name for the trillions of dollars that the Federal Reserve conjured out of thin air.
He said – Since QE has never been done on this scale and we don’t completely know the myriad effects it has had on asset prices, confidence, capital expenditures and other factors, we cannot possibly know all of the effects of its reversal.
We have to deal with the possibility that at one point, the Federal Reserve and other central banks may have to take more drastic action than they currently anticipate – reacting to the markets, not guiding the markets.
And of course the DOW finished the week on a down trend, down 2.34%, and wiping out all the value gained this year, and volatility is way up. Here is a plot of the DOW.
This extreme volatility does suggest the bull market is nearing its end… if it hasn’t ended already. Dimon seems pretty sure we’re in for more volatility and higher interest rates. One scenario that would require higher rates from the Fed is higher inflation:
If growth in America is accelerating, which it seems to be, and any remaining slack in the labor markets is disappearing – and wages start going up, as do commodity prices – then it is not an unreasonable possibility that inflation could go higher than people might expect.
As a result, the Federal Reserve will also need to raise rates faster and higher than people might expect. In this case, markets will get more volatile as all asset prices adjust to a new and maybe not-so-positive environment.
Now– here’s the important part. For the past ten years, the largest buyer of US government debt was the Federal Reserve. But now that QE has ended, the US government just lost its biggest lender.
Dimon thinks other major buyers, including foreign central banks, the Chinese, etc. could also reduce their purchases of US government debt. That, coupled with the US government’s ongoing trade deficits (which will be funded by issuing debt), could also lead to higher rates…
So we could be going into a situation where the Fed will have to raise rates faster and/ or sell more securities, which certainly could lead to more uncertainty and market volatility. Whether this would lead to a recession or not, we don’t know.
We’ll leave you with one final point from Jamie Dimon. He acknowledges markets have a mind of their own, regardless of what the fundamentals say. And he sees a real risk “that volatile and declining markets can lead to a market panic.”
Financial markets have a life of their own and are sometimes barely connected to the real economy (most people don’t pay much attention to the financial markets nor do the markets affect them very much). Volatile markets and/or declining markets generally have been a reaction to the economic environment. Most of the major downturns in the market since the Great Depression reflect negative future expectations due to a potential or real recession. In almost all of these cases, stock markets fell, credit losses increased and credit spreads rose, among other disruptions. The biggest negative effect of volatile markets is that it can create market panic, which could start to slow the growth of the real economy. Because the experience of 2009 is so recent, there is always a chance that people may overreact.
Dimon cautioned investors that interest rates could rise much sooner than they expect. If inflation suddenly comes roaring back. Indeed, it’s entirely possible the 10-year could break above 4% in the near future as inflation returns to 2% and the Fed shrinks its balance sheet.
Dimon also cast a wary eye toward exchange-traded funds, which have seen their popularity multiply since the financial crisis. There are now many ETF products that are considerably more liquid than their underlying assets. In fact far more money than before (about $9 trillion of assets, which represents about 30% of total mutual fund long-term assets) is managed passively in index funds or ETFs (both of which are very easy to get out of). Some of these funds provide far more liquidity to the customer than the underlying assets in the fund, and it is reasonable to worry about what would happen if these funds went into large liquidation.
And Finally America’s net debt currently stands at 77% of GDP (this is already historically high but not unprecedented). The chart below also shows the Congressional Budget Office’s estimate of the total U.S. debt to GDP, assuming a 2% real GDP growth rate. Hopefully, with the right policies they can grow faster than 2%. But more debt does seem on the cards.
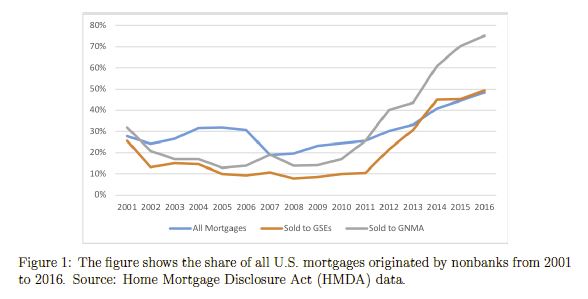
And to add to that perspective, we spoke about the recent Brookings report which highlighted the rise in non conforming housing debt in the USA. debt as lending standards are once again being loosened, and risks to mortgage services are rising.
The authors quote former Ginnie Mae president Ted Tozer concerning the stress between Ginnie Mae and their nonbank counterparties.
… Today almost two thirds of Ginnie Mae guaranteed securities are issued by independent mortgage banks. And independent mortgage bankers are using some of the most sophisticated financial engineering that this industry has ever seen. We are also seeing greater dependence on credit lines, securitization involving multiple players, and more frequent trading of servicing rights and all of these things have created a new and challenging environment for Ginnie Mae. . . . In other words, the risk is a lot higher and business models of our issuers are a lot more complex. Add in sharply higher annual volumes, and these risks are amplified many times over. . . . Also, we have depended on sheer luck. Luck that the economy does not fall into recession and increase mortgage delinquencies. Luck that our independent mortgage bankers remain able to access their lines of credit. And luck that nothing critical falls through the cracks…
They say that goldfish have the shortest memory in the Animal Kingdom… something like 3-seconds. But not even a decade after these loans nearly brought down the entire global economy, SUBPRIME IS BACK. In fact it’s one of the fastest growing investments among banks in the United States. Over the last twelve months the subprime volume among US banks doubled, and it’s already on pace to double again this year.
What could possibly go wrong?
In a further sign of loosening of rules in the US, the Board of Governors of the Federal Reserve System, the Federal Deposit Insurance Corporation, and the Office of the Comptroller of the Currency issued a final rule that increases the threshold for commercial real estate transactions requiring an appraisal from $250,000 to $500,000.
They say the increased threshold will not pose a threat to the safety and soundness of financial institutions. “Commenters opposing an increase to the commercial real estate appraisal threshold asserted that an increase would elevate risks to financial institutions, the banking system, borrowers, small business owners, commercial property owners, and taxpayers. Several of these commenters asserted that the increased risk would not be justified by burden relief”.

The agencies originally proposed to raise the threshold, which has been in place since 1994, to $400,000, but determined that a $500,000 threshold will materially reduce regulatory burden and the number of transactions that require an appraisal. The agencies also determined that the increased threshold will not pose a threat to the safety and soundness of financial institutions.
The final rule allows a financial institution to use an evaluation rather than an appraisal for commercial real estate transactions exempted by the $500,000 threshold. Evaluations provide a market value estimate of the real estate pledged as collateral, but do not have to comply with the Uniform Standards of Professional Appraiser Practices and do not require completion by a state licensed or certified appraiser.
The final rule responds, in part, to concerns financial industry representatives raised that the current threshold level had not kept pace with price appreciation in the commercial real estate market in the 24 years since the threshold was established and about regulatory burden during the Economic Growth and Regulatory Paperwork Reduction Act review process completed in March 2017.
Every 10 years or so there is a banking crisis. We are due. However, the furthest thing from most people’s minds with the Trump boom is a banking/financial crisis, except for a few folks at the Brookings Institution, who just released a paper entitled “Liquidity Crisis in the Mortgage Market.”
 You Suk Kim, of the Federal Reserve Board; Steven M. Laufer, who also labors on the Federal Reserve Board along with Karen Pence, plus, Richard Stanton of the University of California, Berkeley, and Nancy Wallace, also of University of California, Berkeley, to give away the punchline from their paper’s abstract, write, “We describe in this paper how nonbank mortgage companies are vulnerable to liquidity pressures in both their loan origination and servicing activities, and we document that this sector in aggregate appears to have minimal resources to bring to bear in a stress scenario.”
John and Joan Q. Public believe the 2018 mortgage business is like George Bailey’s Building & Loan in “It’s a Wonderful Life.” People deposit money, bankers lend it out, keeping the mortgage on their books. Easy Peasy.
As the folks from Brookings point out, it’s not that easy in these dark days of financial engineering. George Bailey’s handshake, promise and maybe a few words on a document to be signed by the borrower which meant simply, “I’ll pay you back,” has become a financial instrument, to be traded and hypothecated by faceless financial bureaucrats, each one taking a sliver of profit off the top.
Everyone remembers the crash of 2008 and plenty explanations have been posited. What the writers for Brookings explain is,
The literature has been largely silent on the liquidity vulnerabilities of the short-term loans that funded nonbank mortgage origination in the pre-crisis period, as well as the liquidity pressures that are typical in mortgage servicing when defaults are high. These vulnerabilities in the mortgage market were also not the focus of regulatory attention in the aftermath of the crisis.
They continue,
Of particular importance, these liquidity vulnerabilities are still present in 2018, and arguably the potential for liquidity issues associated with mortgage servicing is even greater than pre-financial crisis. These liquidity issues have become more pressing because the nonbank sector is a larger part of the market than it was pre-crisis, especially for loans securitized in pools with guarantees by Ginnie Mae.
George Bailey and his little financial institution are nowhere to be found.
The authors quote former Ginnie Mae president Ted Tozer concerning the stress between Ginnie Mae and their nonbank counterparties.
… Today almost two thirds of Ginnie Mae guaranteed securities are issued by independent mortgage banks. And independent mortgage bankers are using some of the most sophisticated financial engineering that this industry has ever seen. We are also seeing greater dependence on credit lines, securitization involving multiple players, and more frequent trading of servicing rights and all of these things have created a new and challenging environment for Ginnie Mae. . . . In other words, the risk is a lot higher and business models of our issuers are a lot more complex. Add in sharply higher annual volumes, and these risks are amplified many times over. . . . Also, we have depended on sheer luck. Luck that the economy does not fall into recession and increase mortgage delinquencies. Luck that our independent mortgage bankers remain able to access their lines of credit. And luck that nothing critical falls through the cracks…
Tozer said these words in 2015. The mortgage engine is built for perfection: a thriving economy, with low interest rates, allowing everyone, from the mortgage borrowers to the credit line providers and securitizers to keep their promises.
However, the world is anything but perfect.
Nonbank mortgage providers essentially borrow short and lend long, using warehouse lines of credit from banks to fund mortgages. From 2012 to the third quarter of 2017, commitments on warehouse lines has increased 70 percent. Of course, if all goes well, a mortgage will be sold quickly into the secondary market (on average 15 days) and the line will be reduced.
The Brookings authors identify three vulnerabilities in the process.
1) margin calls due to aging risk (i.e., the time it takes the nonbank to sell the loans to a mortgage investor and repurchase the collateral) and/or mark-to-market devaluations, 2) roll-over risk and 3) covenant violations leading to cancellation of the lines.
These vulnerabilities are very real, should there be a sudden increase in interest rates or other significant change in the market that causes collateral values to drop. Most nonbank lenders have multiple warehouse lines. However, cross default provisions will trigger a scramble amongst warehouse lenders for a mortgage originator’s assets should it default on one of its lines.
The authors explain,
These sources of warehouse credit began to dry up rapidly in the run-up to the financial crisis as the slowdown in the securitization markets made it difficult for the nonbanks to move loan originations off the warehouse lines and the premiums paid for subprime warehoused loans evaporated. In 2006:Q4 there were 90 warehouse lenders in the U.S. with about $200 billion of outstanding committed warehouse lines; however, by 2008:Q2 there were only 40 warehouse lenders with outstanding committed lines of $20–25 billion, a decline exceeding 85%.34 By March of 2009, there were only 10 warehouse lenders in the U.S. In addition, runs on SIVs led to the collapse of this form of warehouse funding by the end of 2007 … and it has not returned as a funding source post-crisis.
Mortgage servicers have liquidity issues because they are required to continue making payments to investors, tax authorities, and insurers if mortgage borrowers quit making payments. Servicers are eventually reimbursed for these “servicing advances,” however, they need to finance the advances in the interim.

For example, servicers were stressed last year when hurricane victims were allowed payment forbearance by Ginnie Mae and the GSEs. Fortunately, the servicers were geographically diversified enough to manage through the strain.
Again, everything is dandy if borrowers make their payments. However, as Mike “Mish” Shedlock explains,
Nonbanks are vulnerable to macroeconomic shocks, rising interest rates, home price declines and job losses, often with a bare minimum down payment.
This is happening while debt-to-income DTI ratios are on the rise (Fannie Mae increased its DTI ceiling from 45 percent to 50 percent last July 29) and median FICO scores are dropping.
This is hardly surprising given homes are not affordable.
The crash clock is ticking.
The stock market is at record highs and people with FICO scores as low as 500 are once again happily obtaining mortgages. Not only that, but these mortgages are once again being securitized and are in demand by yield chasers.
All of the elements that are necessary for the 2008 subprime crisis to repeat itself are starting to fall back into place. Aside from the fact that we have inflated bubbles across basically all asset classes for the most part, not the least of which is evident in the stock market, the Financial Times reported today that not only are subprime mortgage backed securities becoming prominent again, but that the chase for yield was what fueling demand:
Issuance of securities backed by riskier US mortgages roughly doubled in the first quarter from a year earlier, as investors lapped up assets blamed for bringing the global financial system to the brink of collapse a decade ago. Home loans to people with scratches and dents in their credit histories dwindled to almost nothing in the aftermath of the crisis, as litigation-weary lenders retreated to patch up their balance sheets.
But over the past couple of years a group of specialist firms has begun to bring the loans back, navigating a dense web of new rules drawn up to protect borrowers and investors in the $9.3tn US home-loan market. Last year saw issuance of $4.1bn of securities backed by loans that would have been called “subprime” before the last financial crisis, according to figures from Inside Mortgage Finance, with the pace picking up in the latter half of the year. The momentum has continued into 2018, with deals worth $1.3bn in the first quarter — twice the $666m issued in the same period a year earlier.
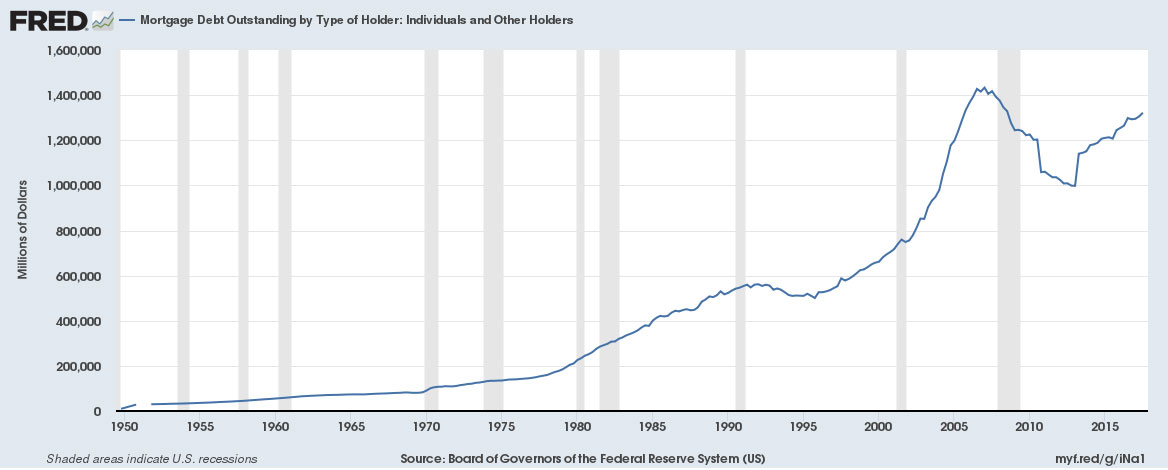
Our central banks have done such a great job of getting us out of our last crisis that the recovery has prompted a mortgage originators and real estate investors to basically do the same exact thing that they were doing 2006 to 2007. After all, mortgage levels are already almost back to 2008 levels.
 If that wasn’t disturbing enough, the hedge fund partner that FT quotes in the article says that the subprime market has “a lot of room to grow“ as if it were some type of new emerging market generating productivity, and not just a carbon copy repeat of exactly what happen nearly 10 years ago.
“The market is . . . starting from such a small base that it has a lot of room to grow,” said Jamshed Engineer, a partner at Axonic Capital, a New York hedge fund with more than $2bn in assets under management.
“[Investors] are definitely chasing yields. Whenever these deals come out, for the most part, they are oversubscribed.”
The Financial Times article tries to couch the fact that all hell could be breaking loose yet again at some point soon by citing Dodd Frank reforms that we reported in March are already past the Senate. The key provisions of the rollback are:
Despite the fact that the FT states that 500 FICO scores are getting approved for mortgages, S&P, one of the willfully ignorant and blind rating agencies that missed the subprime crisis thinks that everything is going to be fine:
“The risk is contained, in our view,” said Mr Saha.
For the way that our Federal Reserve has addressed the problems of 2007 or 2008, these are the end results that they deserve, but the American people ultimately do not.