We look at the ABS data for November. Are the analysts right to call this as a significant event?
Digital Finance Analytics (DFA) Blog
"Intelligent Insight"

The September data was better than expected – lets celebrate the good news!
https://www.abs.gov.au/ausstats/abs@.nsf/mf/5368.0?OpenDocument
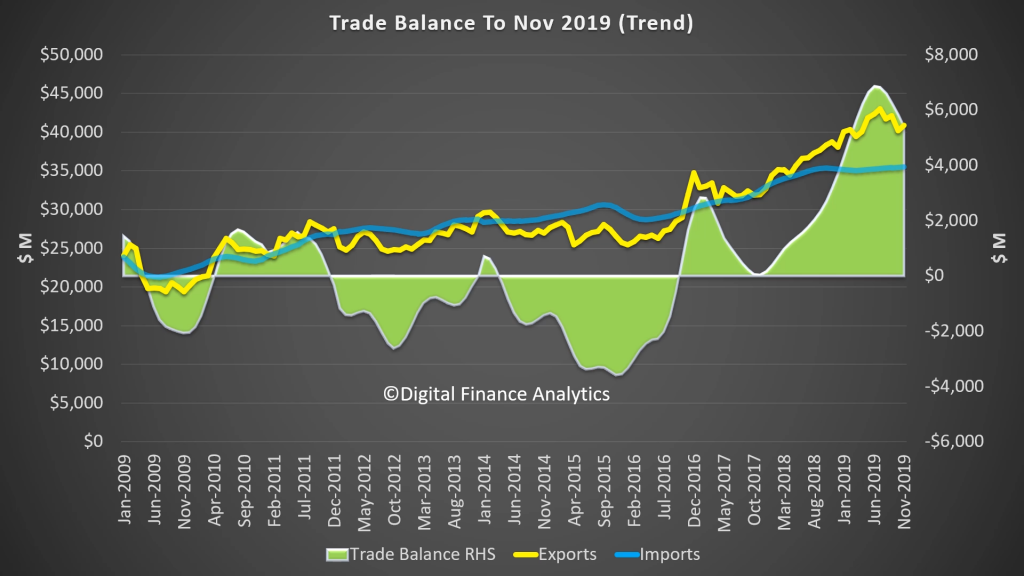
The ABS released their latest trade figures today, and we look at the results.
We look at the latest trade figures, which came out yesterday and which reached another record.
We look at the latest trade figures, which reached another record.
 Blog")
The latest from the ABS suggests that thanks to a lift in export prices, against imports, the GDP next time will be significantly assisted. Indeed the quantum of the changes are surprising strong. This may be sufficient to stop the RBA cutting the cash rate next month.
IMPORT PRICE INDEX
The Import Price Index fell 0.5% in the March quarter 2019. This follows a rise in the December quarter 2018 of 0.5%.
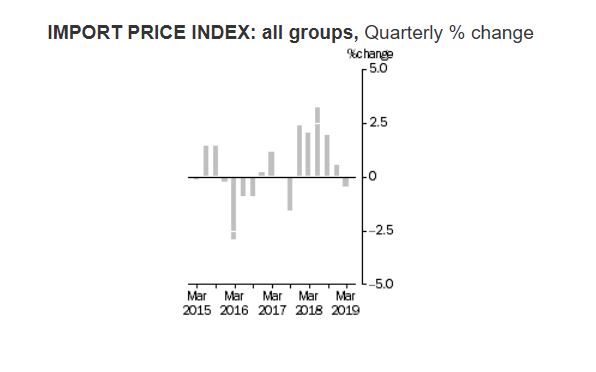
The main contributor to the fall this quarter is Petroleum, petroleum products and related materials (-6.8%), due to an increase in global supply.
Other major price falls were recorded in Inorganic chemicals and Medicinal and pharmaceutical products.
Inorganic chemicals fell 15.3%, driven by falls in the price of caustic soda, due to a global oversupply.
Medicinal and pharmaceutical products fell 3.1%, due to annual price reviews and increased competition from generic medicines.
These falls were partially offset by rises in prices for Gold, non-monetary (excluding gold ores and concentrates) (+6.8%), and General industrial machinery and equipment, n.e.s., and machine parts, n.e.s. (+2.5%).
Through the year to the March quarter 2019, the Import Price Index rose 5.2%. The main contributors to the rise are Petroleum, petroleum products and related materials (+5.6%), and General industrial machinery and equipment, n.e.s., and machine parts, n.e.s. (+8.6%).
MAJOR IMPORT PRODUCTS
The price movements of Australia’s major import products are summarised below:
EXPORT PRICE INDEX
The Export Price Index rose 4.5% in the March quarter 2019. This follows a rise in the December quarter 2018 of 4.4%.
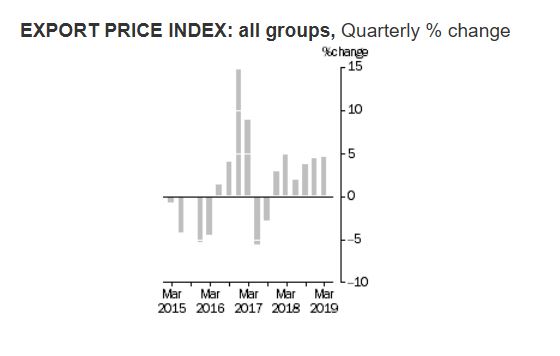
The main contributor to the rise this quarter is Metalliferous ores and metal scrap (+12.9%), reflecting local and global supply disruptions for iron ore and on-going demand from China.
Other major price rises were recorded in Gold, non-monetary (excluding gold ores and concentrates), Cereals and cereal preparations, Gas, natural and manufactured, and Non-ferrous metals.
Gold, non-monetary (excluding gold ores and concentrates), rose 6.6%, due to increased investor demand amid concerns over global economic growth.
Cereals and cereal preparations rose 4.3%, due to the impact of dry weather conditions globally in many wheat growing regions.
Gas, natural and manufactured rose 0.9%, due to the continuation of demand across Asia for liquefied natural gas. Export contract prices for liquefied natural gas are influenced by the international crude oil price with a four to six month lag.
Non-ferrous metals rose 3.3%, driven by increased demand for copper.
Offsetting these rises were falls in prices for Petroleum, petroleum products and related materials (-11.7%), and Meat and meat preparations (-2.3%).
Through the year to the March quarter 2019, the Export Price Index rose 15.3%. The main contributors to the rise are Metalliferous ores and metal scrap (+25.4%), Gas, natural and manufactured (+37.1%), and Coal, coke and briquettes (+9.0%).
MAJOR EXPORT PRODUCTS
The price movements of Australia’s major export products are summarised below:
This is all about the Iron Ore price, thanks to Brazil. Fortunate yes, planned no!
The ABS reported that
This from Westpac.
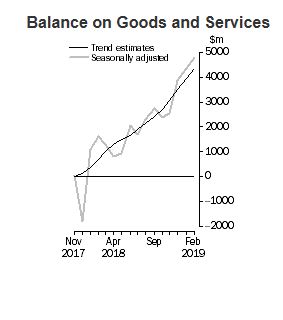
The trade surplus rose to $4.8bn in February, up from a revised $4.35bn.
That exceeded expectations (market median $3.7bn and Westpac $3.8bn).
Exports: exceeded expectations, +0.2% vs a forecast -0.9%. The key surprise, the expected pull-back in gold failed to materialise.
Imports: were softer than anticipated, -1.1% vs a forecast +1.1%
Additional detail
Export earnings have been boosted by higher commodity prices, particularly for coal and iron ore. In February, metal ore export earnings (including iron ore) jumped by $1.0bn to $9.6bn, a record high – as anticipated. The spot iron ore price soared to US$85/t in the month as global supply was dented by the tailings dam tragedy in Brazil. Coal exports fell sharply, down $0.8bn on weaker volumes. Gold exports, up $1.4bn in January, held at high levels in February, down only $140mn.
Comments
The trade balance has strengthened from a $2.9bn surplus on average in the December quarter to a $4.6bn on average surplus in the March quarter. The bulk of this improvement likely reflects higher commodity prices. The lift in prices is boosting Australia’s national income, which is flowing through to higher tax revenues – providing governments with additional fiscal flexibility, as evident in recent budget updates. However, despite this, wages growth remains sluggish.
The ABS released their International Trade in Goods and Services to October 2016. The gap was bigger than expected, as exports rose slower than imports, and the value of exports was lower than some anticipated, given recent commodity price movements.

This is the first increase in the deficit since June this year, and was higher than the $800 million expected by economists.
Within this, the value of exports rose by 1% to $27.6 billion and imports jumped by 2% to $29.2 billion.
In trend terms, the balance on goods and services was a deficit of $1,565m in October 2016, a decrease of $154m (9%) on the deficit in September 2016.
In seasonally adjusted terms, the balance on goods and services was a deficit of $1,541m in October 2016, an increase of $269m (21%) on the deficit in September 2016.
In seasonally adjusted terms, goods and services credits rose $389m (1%) to $27,631m. Non-rural goods rose $223m (1%) and non-monetary gold rose $198m (13%). Rural goods fell $150m (4%) and net exports of goods under merchanting fell $3m (6%). Services credits rose $121m (2%).
In seasonally adjusted terms, goods and services debits rose $658m (2%) to $29,172m. Capital goods rose $490m (10%), consumption goods rose $100m (1%) and intermediate and other merchandise goods rose $97m (1%). Non-monetary gold fell $162m (26%). Services debits rose $135m (2%).
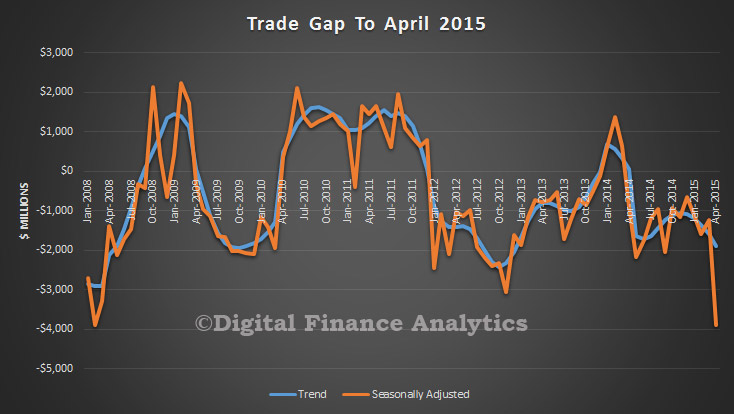
The ABS published the April International Trade in Goods and Services to April 2015. In trend terms, the balance on goods and services was a deficit of $1,883m in April 2015, an increase of $292m (18%) on the deficit in March 2015. However, in seasonally adjusted terms, the balance on goods and services was a deficit of $3,888m in April 2015, an increase of $2,657m (216%) on the deficit in March 2015. This is a significant “blip” and seems to be caused by a couple of specific one-off items, including loss of exports caused by bad weather, and the purchase of a large piece of machinery.
 In seasonally adjusted terms, goods and services credits fell $1,561m (6%) to $25,659m. Non-rural goods fell $1,271m (8%) partly driven by coal, coke and briquettes, down $859m (22%) as a result of the temporary closure of ports due to severe weather conditions. Non-monetary gold fell $306m (22%), rural goods fell $31m (1%) and net exports of goods under merchanting fell $5m (15%). Services credits rose $52m (1%).
In seasonally adjusted terms, goods and services debits rose $1,096m (4%) to $29,547m. Capital goods rose $546m (10%) driven by imports of machinery and industrial equipment, up $1,232m (69%). Intermediate and other merchandise goods rose $371m (4%) and consumption goods rose $314m (4%). Non-monetary gold fell $91m (24%). Services debits fell $43m (1%).