Please consider supporting our work via Patreon ;
Please share this post to help to spread the word about the state of things….

/
RSS Feed
Digital Finance Analytics (DFA) Blog
"Intelligent Insight"

The latest edition of our weekly digest of property and finance news with a distinctively Australian flavour
Please consider supporting our work via Patreon ;
Please share this post to help to spread the word about the state of things….
Welcome to the Property Imperative Weekly to 1st September 2018, our digest of the latest finance and property news with a distinctively Australian flavour. Locally the bad news keeps coming, while US markets remain on the boil.
 And by the way, if you value the content we produce please do consider joining our Patreon programme, where you can support our ability to continue to make great content.
Listen to the podcast, read the transcript, or watch the video show.
NineNews published an article this week, claiming that Sydney and Melbourne dwelling values “may soon rise again” because of a decline in dwelling construction, citing a report saying that the rate of construction is expected to slow down, with the number of new homes built set to fall by up to 50,000 each year. So they said, that would mean 20,000 fewer homes built across the country each year than the 195,000 needed to meet future demand.
Indeed, the ABS reported this week that building approvals in July were 5.6 per cent lower than in the same month last year. Total seasonally adjusted dwelling approvals in July fell in New South Wales (-5.2 per cent), Victoria (-4.6 per cent), Queensland (-6.0 per cent), South Australia (-26.5 per cent) and Western Australia (-14.7 per cent). Seasonally adjusted approvals increased in Tasmania by 13.6 per cent. In trend terms, total dwelling approvals in July increased by 4.5 per cent in the Northern Territory and in the Australian Capital Territory (12.2 per cent).
The data shows its high rise apartments which are slowing the fastest (in response to slowing demand from investors) but it is worth noting that the volume of approvals for new detached houses have been tracking around their strongest levels in 15 years. The HIA said that weaker conditions in a number of states have typically been overshadowed by strong activity in Victoria. With Victorian home approvals now showing signs of weakness they expect the national trend – of declining building approvals – will continue throughout 2018.
The HIA also reported on new home sales for July, saying that consistent with the trend for much of 2018, July saw sales fall by 3.1 per cent compared to the previous month. Sales in 2018 thus far are 6.1 per cent lower than in the corresponding time in 2017. The noticeable new trend is that new home sales in Victoria are weakening. Victoria has experienced exceptionally strong conditions, which have been sustained over a number of years, obscuring weaker conditions in a number of other states. With Victorian new home sales now showing signs of weakness we expect the national trend – of declining sales – will continue throughout 2018.
The Sydney market has also been cooling throughout the year particularly in the new growth areas. The high volume of new apartments in metropolitan cities are competing for first home buyers and resulting in a slowdown in new detached home sales. Other regions in New South Wales, such as the Hunter, around the ACT and South and North Coasts, are continuing to see strong growth. They say the market for new home sales across the country is cooling for a number of reasons including a slowdown in inward migration since July 2017, constraints on investor finance imposed by state and federal governments and falling house prices. They expect that it will continue to slow over the next two years due to the adverse factors now starting to take effect the market.
Specifically, they say that finance has become increasingly difficult to access for home purchasers. Restrictions on lending to investors and rising borrowing costs have seen credit growth squeezed. Falling house prices in metropolitan areas have also contributed to banks tightening their lending conditions which have further constrained the availability of finance. An increase in interest rates charged by banks, which had been anticipated, will accelerate the slowdown in sales and ultimately new home building activity.
The latest data from the RBA and APRA confirm the fall in credit, with the monthly RBA credit aggregates for July showing total credit for housing up 0.2% in the month, to $1.77 trillion, with owner occupied credit up 0.5% to $1.18 trillion and investment lending down 0.1% to $593 billion. Investment housing credit fell to 33.4% of the portfolio, and business credit was 32.5%. APRA’s data showed that investor loan balances at Westpac, CBA and ANZ all falling, while NAB grew just a tad. Macquarie, HSBC. Bendigo Bank and Bank of Queensland grew their books, highlighting a shift towards some of the smaller lenders. Suncorp balances fell a little too. You can watch our separate video “Rates Up, Lending Down”, for more on this.
And of course we saw more out of cycle rates hikes from Westpac, who lifted variable rates for owner occupies and investors holding loans with them by 14 basis points – see out video “Westpac Blinks” for more on this – where we discuss the margin compression the experienced, thanks to rising international funding rates (see the BBSW) and the switch from interest only to principal and interest loans. Then on Friday, Suncorp and Adelaide Bank, both of whom had already lifted a couple of months back, lifted again. As I said yesterday, what is happening here is that funding costs are indeed rising. But the real story is that they are also running deep discounted rates to attract new borrowers, (especially low risk, low LVR loans) and are funding these by repricing the back book. This is partly a story of mortgage prisoners, and partly a desperate quest for any mortgage book growth they are capture. Without it, bank profits are cactus. Once again customer loyalty is being penalised, not rewarded. Those who can shop around may save, but those who cannot (thanks to tighter lending standards, or time, or both) will be forced to pay more
Damien Boey at Credit Suisse, writing before Suncorp And Adelaide Bank moved again said Westpac was the latest of the banks to hike variable rates across new and existing customers, following similar moves from BOQ, BEN, MQG and SUN over the past few months. Not only are out of cycle rate hikes broadening out across the system – we think that they will continue to broaden out across the majors, and become a recurring theme. This is because:
Even after some banks have hiked rates out of cycle, we still think that in aggregate there are more than 50bps of variable rate mortgage hikes in the pipeline based on already known developments in the money market. But the RBA only has 1.5% worth of rate cut ammunition left in its bag of tricks.
This means that the RBA has lost some autonomy over the monetary transmission mechanism, because effective borrowing rates can rise independently of the cash rate. In particular, Australian-US yield differentials are likely to further invert, undermining the carry trade appeal of the AUD/USD. The Fed still seems quite determined to hike rates. But the RBA is unlikely to be matching the Fed’s hawkishness given the slowdown in train, and given what the banks are doing to rates and credit supply.
So we are in for a period of more out of cycle rate rises, as well as tighter lending standards. No surprise, then that refinance rejections are rocketing, as we reported this week, and mortgage prisoners are getting locked in. The ABC story even got picked up by ZeroHedge in the US.
So back to that NineNews report, they missed completely the real reason why home prices are falling, it’s all about credit availability. Lending standards are tighter now – borrowing power is reduced, and so new loans are only available on tighter terms. If you want to understand the link between credit and home prices, which is still not widely understood, I recommend you watch my recent conversation with Steve Keen, who explains the mechanisms involved, and the policy failures behind them. See “Are Icebergs Fluffy? … A Conversation with Steve Keen”. This show has already become one of the most popular in the site, and it is really worth a watch.
The upshot though is home prices are likely to continue to fall. CoreLogic’s dwelling price index showed another fall in August, recording a 0.38% decrease in values at the 5-city level. This is the 11th consecutive monthly decline in home values, down a cumulative 3.4% over that period at the 5-city level: Quarterly values also fell another 1.3% In the year to August, with home values down by 3.09% at the 5-city level, driven by Sydney (-5.64%). Significantly, Perth’s housing bust continues to roll on, with dwelling values now down 13% since peaking in June 2014 after falling another 0.6% in August: the cumulative loss in values at 13% is greater than the 11.5% peak-to-trough falls experienced between 2009-09, and the duration of the downturn has hit 50 months – more than twice as long as prior downturns. Plus, rents there have similarly fallen, with median asking rents down 29% for both houses and units since June 2013.
My theory is, where Perth has gone, other centres are likely to follow as the great property reset rolls on. Melbourne and Victoria is deteriorating significantly, and remember there net rental yields are some of the lowest across the country. No, prices are not likely to recover anytime soon.
And if you want further evidence, auction clearance rates remain in the doldrums. It is interesting to see now the main stream media is beginning to talk about this, and I have been busy this week with interviews on Radio Melbourne, 2GB and elsewhere. Remember this is only the end of the beginning. I continue to believe 2019 will be a really bad year, what with more rate hikes, interest only loan switches, and decaying sentiment. As one industry insider told me this week, “some of my property investor clients have decided to try and sell before the falls bite”. It may be too late.
And to add to the mix, ABC’s Michael Janda wrote an excellent piece this week on the advantage some large banks have with regard to how APRA assesses their capital base. The big four banks between them hold around 80 per cent of all Australian home loans. There are many factors that have led to this extreme market dominance: economies of scale, better credit ratings and an implicit Federal Government guarantee — all of which are linked. But the major banks — plus Macquarie and, recently, ING — also enjoy a regulatory benefit that is little known outside the financial sector, but provides a substantial competitive advantage. “The average capital risk weights of the standard banks is around 39 per cent, the major banks average around 25 per cent, and the actual cost [difference] of that equates to around 15 basis points in margins, so it’s not insignificant at all,” the chief executive of second-tier lender ME Bank, Jamie McPhee, told The Business. Those 15 basis points, or 0.15 percentage points, either have to be added onto the interest rate of mortgages that ME Bank and other smaller lenders offer or they take a hit to their profit margins.
For regional banks on the “standardised” system, the safest high-deposit, fully documented housing loans are considered just 35 per cent at risk, meaning they only have to hold $35,000 in capital on $1 million home loan. However, the major banks, plus Macquarie and ING, are allowed to set their own risk weights, using internal financial modelling under the internal ratings-based (IRB) approach. Until the Financial System Inquiry (FSI) there was no floor on how low these could be — a couple of the major banks were averaging less than 15 per cent on mortgages, meaning they held less than $15,000 in capital to protect against losses on $1 million home loan. Smaller banks have ‘disadvantage baked in’. However, on recommendations from that inquiry, the bank regulator APRA introduced a floor of 25 per cent on the average mortgage risk weight for these banks. That still leaves a significant difference between the amount of capital the big banks hold and what the smaller banks have to put aside.
APRA continues to argue that these more sophisticated banks deserve benefit from their investment in more advanced management systems, and yet APRAs recent reviews suggest significant issues. Here is a recent discussion between Senator Whish-Wilson and APRA Chair Wayne Byers discussing in a Senate committee hearing in May the outcomes from their targeted reviews of major bank lending practices in 2017, but only released publicly through the royal commission process earlier this year.
This casts doubt on whether the big four actually live up to the theory of having better risk assessment and management than the smaller banks. Is APRA still captured we ask, and should the playing field be levelled. We continue to think so.
So now to the markets. Locally, Bendigo and Adelaide Bank fell 0.26% on Friday to 11.59, Suncorp rose 0.06% to 15.49, Westpac fell 0.38% to 28.54, well down from a year ago, despite the mortgage rate hike, and CBA fell 1.26% to 71.24. More are getting negative on the banks, given recent events. The ASX 200 fell 0.51% to 6,319, just off its highs, as the financial sector fell away. The Aussie continues to fall against the US dollar, down a significant 0.96% to 71.93, and we continue to expect more weakness ahead.
Sentiment is rather different in the US markets, with the 10-year rate still elevated, and the gap to the 3 month Libor very narrow, as we discussed before a potential harbinger of a recession later. But the US stock markets remain in positive territory. The Dow Jones Industrial Average fell 0.09% to 25,964, still below its peak in February. The S&P 500 passed a new record in the week, and ended on Friday at 2,901. The VIX was down again, falling 4.95% to 12.87, indicating the market is risk off at the moment. The US Dollar Index Futures was up 0.43% to 95.05.
That said, the burst of optimism about trade in the market during the week, didn’t last until the closing bell on Friday. The U.S. announced a bilateral deal with Mexico on Monday. But tension built throughout the week as the U.S. announced there was a Friday deadline to bring Canada into a newly-revamped NAFTA. The U.S. and Canada missed that deadline, but announced that talks would resume next Wednesday, leaving the market facing more wait-and-see trading days. There was also drama during Friday’s discussions after the Toronto Star reported that Trump told Bloomberg off the record he had no plans to give any concessions at all to Canada. The president appeared to later confirm that stance in a tweet, saying Canada now knows where he stands.
Trade worries spread beyond North America, though. Trump told Bloomberg he was prepared to withdraw from the WTO if necessary. And he plans to move ahead with tariffs on $200 billion in Chinese imports as soon as a public-comment period concludes next week. China’s foreign ministry said Friday that the U.S. putting pressure on Beijing would not work.
The Yuan rose a little against the US Dollar, but remains way down on a year ago.
Meantime retail earnings dominated the calendar this week, leading to strong stock movements in the low-volume environment. The S&P Retail index ended up slightly for the week.
Among big movers, Abercrombie & Fitch stock plummeted on second-quarter revenue and same-store sales missed estimates. Best Buy stock tumbled despite better-than-expected second quarter revenue and earnings as online sales slowed and the company warned that it is “expecting a non-GAAP operating income rate decline in the third quarter.” And Tiffany & Co spiked on second-quarter results and strong outlook, but then tumbled in later sessions.
In tech, Tesla shares started the week with a quick drop and finished it lower as it scrapped plans to go private. CEO Elon Musk wrote in a blog late last week that he would not move forward with a plan to take the company private, noting that after speaking with retail and institutional shareholders that “the sentiment, in a nutshell, was ‘please don’t do this.’”
Musk had surprised the market out of the blue, tweeting he was thinking of taking the company private at $420 per share and had funding secured. The SEC was interested in whether the tweet was designed in a way to punish short sellers, according to reports.
The NASDAQ rose 0.26% to 8,109.5 in record territory driven by the booming sector.
Data out this week illustrated two contrasting segments of the U.S. economy, one stronger and one weaker. Economic indicators on the consumer side remained very strong. The Conference Board’s index of consumer confidence increased to 133.4 this month, compared to a reading of 126.7 forecast by economists. That was its highest level since October 2000. The University of Michigan’s August consumer confidence index was revised up to 96.2 from its preliminary measure of 95.3. And consumer spending, which accounts for more than two-thirds of U.S. economic activity, rose 0.4% last month, matching June’s reading and analyst forecasts.
But the National Association of Realtors said its pending home sales index, which measures signed contracts for homes where transactions have not yet closed, fell 0.7% to a reading of 106.2 after rising by a revised 1.0% in the previous month. Economists had forecast pending home sales rising 0.3% last month. So more questions on the housing sector ahead.
Oil closed out the month higher as traders balanced expectations of crude supply losses with the potential of trade wars denting global demand. China, the world’s largest commodity importer, has seen economic growth dwindle since the trade war with the U.S. kicked off, and a further escalation could dent growth, forcing Beijing to rein in crude imports. Oil prices ended the month nearly 2% higher on bets on renewed global supply shortage as U.S. sanctions on Iran’s crude exports are expected to reduce crude from market, underpinning higher crude prices. Both WTI and Brent crude are expected gain on a potential slump in Iranian exports, although gains in WTI prices will be limited as the refinery maintenance season is set to get underway. Oil prices were helped earlier in the week by an EIA report showing crude oil stockpiles fell much more than expected.
Gold moved a little higher this week, ending up 0.16% on Friday to 1,206, Bitcoin lifted 1.23% to 7,029
So, we can see a significant divergence between the local market here, dragged down by negative sentiment on banks and housing (and the increasing realisation of more issues ahead) and the US where stocks are at the highs despite the building risks from higher corporate debt and the yield curve inversion.
The two markets are poles apart.
The latest edition of our weekly finance and property news digest with a distinctively Australian flavour.
Please consider supporting our work via Patreon
Please share this post to help to spread the word about the state of things….
The latest edition of our weekly finance and property news digest with a distinctively Australian flavour.
Please consider supporting our work via Patreon
Please share this post to help to spread the word about the state of things….
Welcome to the Property Imperative weekly to 25th August 2018, our digest of the latest finance and property news with a distinctively Australian flavour. And what a week it was…
By the way, if you value the content we produce please do consider joining our Patreon programme, where you can support our ability to continue to make great content.
Watch the video, listen to the podcast or read the transcript.
Scott Morrison, the new PM must carry much of the burden for our current economic situation, which to my mind is sliding by the day. Booming debt and flat wages have combined to drag way too high home prices lower, as the number of SME’s feeling the pressure continue to rise. Sprooking high jobs growth (measured on a simplistic basis which does not report underemployment, accurately) and in an environment where the cpi for real households is much higher than the quoted number means the GDP is likely to flag, as the Aussie continues to slide against the US. The bears are it seems out in force now. You can watch my discussion with John Adams, recorded before the spill “Is Parliament Fiddling While Rome Burns” for the political context.
We expect some unnatural acts from the new man, perhaps with first time buyers offered the chance to tap into super to “buy now” and probably overt attempts to trim migration ahead of the election ahead. Remember Morrison spent time at the Property Council, so he is so to speak, pro-property, and pro-property investment – thus the debt bubble may grow further and investors enticed back, at least to some extent. This means a harder fall if or when Labor sweeps to power as the property market turns to custard, what a nice incoming present.
And analysts seem to agree the bears are out. For example, Damien Boey at Credit Suisse says that in the year-to-2017, the Australian population grew by 388,056 people to 24,782,303 residents. According to the 2016 Census, the average number of people per household is 2.57894. Assuming this number remained steady throughout 2017 (an optimistic assumption), household formation was about 150,471 (388,056 divided by 2.57894). Now it is possible for replacement housing demand to rise as high as 25,000 per annum. Therefore, an optimistic estimate of underlying housing demand is around 175,000 per annum. This is below the current level of dwelling completions of around 210,000 per annum. In other words, Australia is in a situation of marginal housing oversupply to the tune of 35,000 per annum. Consistent with this state, house prices are falling moderately. However, it is now possible that marginal oversupply could become worse, due to changes in the political climate. For example, former Prime Minister Abbott, representing the shadow conservative wing of the ruling Liberal Party, has advocated in the past that he would like to cut immigration by up to 80,000 per annum. If the immigration intake is cut by 80,000 per annum, household formation would fall to 119,451 per annum, and underlying housing demand would fall to 144,450 per annum. At the current level of dwelling completions, this would increase marginal housing oversupply to 65,549 per annum, consistent with much faster house price declines. A 40,000 per annum cut to the immigration intake result in a 50,039 per annum housing glut. On top of all of this, we need to consider the risk that if the Liberal Party loses the next election, and the Labour government wins a majority, the new government would attempt to grandfather out negative gearing provisions for investment properties.
Boey does not include the tighter credit environment and high debt which is, as we discussed in this week’s live stream event, crimping households’ ability to borrow. In fact, this is the strongest negative impact on home prices, which is why we revised down our four economic scenarios, such that we think there is only a 5% probability of the RBA’s forecast for the economy playing out. All our other scenarios are more bearish. You can watch the full event on YouTube, including the chat during the session, we had more than 300 watch live on Tuesday. Our next event will be on the 18th September at 20:00 Sydney, and its already scheduled on the channel if you want to set a reminder.
We expect the next RBA rate move to be down, not up, whilst both Barclays and RBS this week pushed out their expectation of a potential cash rate rise from the RBA, due to weaker economic conditions to late 2019 or 2020.
Home prices continue to run lower, as the latest data from CoreLogic shows, with year to date falls of 3.44% in Sydney, and 3.29% in Melbourne, plus a fall of 1.95% in Perth. But also of note is that prices are now falling faster in Melbourne, down 0.59% this month so far, compared with 0.23% in Sydney. And auction clearance rates continue to languish, as more properties remain on the books for sale.
Of course, values are still up 35.3% since the 2010 peak at the 5-city level, driven overwhelmingly by exceptionally strong gains in Sydney at 58.5% and Melbourne 40.4%. But there has been little movement elsewhere (and in fact down in inflation-adjusted terms). And remember the CoreLogic index is driven by settlement data which is weeks behind transactions themselves.
CoreLogic also showed that as well as fewer seven-figure sales occurring now as values decline, the volume of more affordable homes selling is also falling. Their analysis shows that the share of sales under $400,000 homes has continued to decline over the past year. Nationally, 29.2% of all houses and 34.6% of all units sold over the 2017-18 financial year transacted for less than $400,000. The share of sales below this price point has fallen from 30.7% for houses and 35.4% for units a year earlier. The share of sales below $400,000 has increased slightly over the past few months for both houses and units.
An historic low 13.9% of combined capital city house sales and 25.8% of capital city unit sales were under $400,000 over the 2017-18 financial year. The share of sales below $400,000 has fallen over the year from 16.2% of houses and 27.1% of units. Although capital city dwelling values are falling, there continues to be fewer sales occurring below the $400,000 threshold.
The share of sales below $400,000 is predictably much larger across regional areas of the country than within the capital cities. Over the latest financial year, 49.6% of all regional house sales and 57.3% of all unit sales were for less than $400,000. House sales under $400,000 were at a record low and down from 51.6% the previous year while unit sales under $400,000 have increased over recent months but are lower than the 58.0% a year earlier.
Then consider falling rental yields. The AFR reported that Andreas Lundberg from Montgomery Investment Management believes that the sagging yield on residential rental properties in Sydney could drive prices lower if investors seek higher yields without an increase in rents. Sluggish rental growth is weakening the income-generating prospects of property, giving buyers another reason to avoid the asset class and potentially forcing prices to fall further. Such a “de-rating” of residential property is not out of the realm of possibility. “In a rational market, rental yield should drift higher but don’t think it’s a rational market. Mr Lundberg said official data showed property rental yields in Sydney are about 2.7 per cent – well below the long-term average of 4 per cent. “In an environment where rates are no longer falling and indebtedness is very high, rental yields should become a more important consideration in where you should invest your money,” he said.
If you look at Sydney, the annual fall in rental rates is significant, according to CoreLogic data. This is one reason why property investors are, and will continue to head for the exits. Rental yields remain the lowest in Melbourne (3.04%) and Sydney (3.21%) which, given the dim prospects for capital growth and tougher credit conditions, is likely to act as a further disincentive to investors in these markets and help push prices even lower. Labor’s proposed negative gearing and capital gains tax reforms will also add to the downward pressures.
We discussed the state of the property market in a prerecord for Nines’ Sixty Minutes to be broadcast in a few weeks. You can see my video blog which tells the story of the days filming “Talking Finance and Property On Channel Nine”.
Building Company Lend Lease, in their results, which were strong, specifically called out that they were preparing for Australia’s housing slowdown. “We have been participating in a slowdown for some time and most markets are past their peak,” The Group Chief Executive Steve McCann said. Presold lots in its big residential communities slowed to 3,231 lots in financial 2018 from 3,896 in the previous corresponding period. Their sales were down -17% year on year. Their share price is off its highs but up 24% over the past year. As building approvals are still pretty strong, perhaps Lend Lease market share is lower here now. That said, they are still holding a huge land bank and have diversified from residential building. They can afford to wait for the next property boom, down the track.
Westpac’s quarterly update was a salutary lesson in what’s happening in their mortgage book. The biggest property investor lender in the country reported that its net interest margin in June quarter 2018 was 2.06% compared to 2.17% in First Half. The 11bp decline mostly reflected higher funding costs and a lower contribution from the Group’s Treasury. We discussed this in more detail in our post “Through The Westpac Looking Glass” but the primary source of higher funding costs has been the rise in short term wholesale funding costs as the bank bill swap rate (BBSW) increased sharply since February. Every 5bp movement in BBSW impacts the Group’s margins by around 1bp and compared to 1H18, BBSW was on average 24bps higher in 3Q18, reducing the Group’s net interest margin by 5bps. As well as reduced Treasury activity of 4 basis points, 2 basis points came from the ongoing changes in the mix of the mortgage portfolio (less interest only lending) along with lower rates on new mortgages. Deposit pricing changes only had a small impact on margins in 3Q18. And finally, while overall credit quality was fine, mortgage 90+ day delinquencies in Australia were up 3bps over the three months ended June 2018 with most States recording some increase.
So we see the pincer movements at work, deep discounting to try to attract new business, a switch from interest only loans, reducing interest take, a hike in funding costs and higher delinquencies. Combined these forces are enough to put considerable pressure on the bank, as well as others in the sector. Their share price fell 2.43% on Friday to 27.66, just above their 12-month low of 27.30 in June. We see more downside than upside in the banking sector and remember the Royal Commission is still grinding away.
In comparison CBA, the largest owner occupied lender was up 0.2% to 70.89 on Friday. The ASX 200 ended the week at 6,247, up a little on Friday after the ructions in Canberra this week, but below its recent highs. Again, we see more downside than upside.
The Aussie against the US Doller ended at 73.26, up 1.08% on Friday. Looking at the daily chart, AUD/USD was at one-point climbing back into its familiar consolidation range from June. By the close of play, it remains right on the May 2017 low. That was also its largest daily gain since June 4th. From a bigger picture, its dominant downtrend since February still remains in play. But for now, the pair may consolidate between near-term resistance and support. The former is around 73.82 or the August 21st high. A push above that exposes a descending resistance line composed of the July and August highs. This line also intersects the February trend, making for a potentially stubborn area of resistance. In the event Aussie Dollar pushes above that and potentially reverses its significant progress to the downside, we may eventually get to the June 6th high at 76.77.
On the other hand, immediate support is at 72.38 which is the low set on Friday. A descent under that then exposes the current 2018 low at 72.03. Continuation of AUD/USD’s dominant downtrend would then involve getting beyond the December/May 2016 lows between 71.60 and 71.45. We think the longer term trajectory will be lower as the local economy slows further. The risk is there to go below 70 cents ahead.
Across to the US markets, where the bull market is still running. The Dow Jones Industrial ended up 0.52% to 25,790, up 0.52% on Friday, still below its February highs. But the Benchmark S&P 500 stock index clinched its longest bull-market run on Friday, closing above its previous January high, as Federal Reserve Chairman Jerome Powell affirmed the U.S. central bank’s current pace of rate hikes.
The S&P had last reached a new closing high on Jan. 26, then retreated more than 10 percent, a correction that lasted until Feb. 8. Friday’s new closing high confirmed that the index’s bull run remained intact. Speaking at a research symposium in Jackson Hole, Wyoming, Powell said the Fed’s gradual interest rate hikes were the best way to protect the economic recovery, maintain strong job growth and keep inflation under control. His comments did little to change market expectations of a rate hike in September and perhaps again in December. Investors said they were reassured that Powell’s comments stayed in line with previous commentary from the Fed regarding policy. Economic data also boosted sentiment. New orders for key U.S.-made capital goods increased more than expected in July and shipments growth held firm, the Commerce Department said. The index was up 0.62% to 2,875.
However, Housing numbers continue to give the market pause. It’s recently been the part of the economy waving the most red flags. Data on existing home sales released by the National Association of Realtors on Wednesday showed a surprise drop. Existing home sales fell 0.7% in July from the previous month to an annualized pace of 5.34 million units. Economists had forecast a 0.6% increase to an annualized pace of 5.44 million. Sales are now 1.5% below a year ago and have fallen on an annual basis for five-straight months, according to NAR, especially at the lower end of the market. The report also showed that the median existing-home price for all housing types in July was $269,600, up 4.5% from July 2017 ($258,100). July’s price increase marks the 77th straight month of year-over-year gains. In addition, new home sales fell short, dropping to a nine-month low in July. New home sales fell 1.7% last month to an adjusted annual rate of 627,000 units. Economists expected a rise to 645,000 units.
And Moody’s highlighted that once again at the late stage of a cyclical boom, there are signs of excessive risk taking. This time, the most serious developing threat to the current cycle is lending to highly leveraged nonfinancial businesses. While businesses appear to be in good shape in aggregate, a significant number of highly leveraged companies are taking on sizable amounts of debt. This is evident in the rapid growth of so called leveraged loans—loans extended to companies that already have considerable debt. These loans tend to have floating rates—typically Libor plus a spread—with a below-investment-grade (Baa or less) rating.
Leveraged loan volumes are setting records, and loans outstanding have increased at a double-digit pace over the past five years to nearly $1.4 trillion. Businesses use the loans to finance mergers, acquisitions and leveraged buyouts, followed by refinancing, and to pay for dividends, share repurchases and general expenses.
Powering leveraged lending is demand from the collateralized loan obligation market. CLOs are leveraged loans that have been securitized, and global investors can’t seem to get enough of them. This is clear from the thin spreads between CLO yields and comparable risk-free Treasuries.
Approximately one-half of leveraged loans currently being originated are packaged into CLOs, with CLO outstandings approaching $550 billion.
To meet the strong demand for leveraged loans from the CLO market, lenders are easing their underwriting standards. According to the Federal Reserve’s survey of senior loan officers at commercial banks, a net 15% of respondents say they lowered their standards on commercial and industrial loans to large and medium-size companies this quarter compared with the previous quarter. The only other time loan officers eased as aggressively on a consistent basis was at the height of the euphoria leading up the financial crisis in the mid-2000s. Standards for loans to small companies have not eased nearly as much, since they are much less likely to be bundled into a CLO.
Considering the leveraged loan and junk corporate bond market together, highly indebted nonfinancial companies owe about $2.7 trillion. Their debts have been accumulating quickly as creditors have significantly eased underwriting standards. As interest rates rise, so too will financial pressure on these borrowers. Despite all this, global investors appear sanguine, as credit spreads in the CLO and junk corporate bond market are narrow by any historical standard.
Regulators are undoubtedly nervous—they issued guidance to banks to rein in their leveraged lending in 2013—but an increasing amount of the most aggressive lending is being done by private equity, mezzanine debt, and other institutions outside the banking system and regulators’ purview.
Now consider that subprime mortgage debt outstanding was close to $3 trillion at its peak prior to the financial crisis. Insatiable demand by global investors for residential mortgage securities drove the demand for subprime mortgages, inducing lenders to steadily lower their underwriting standards.
Subprime loans were adjustable rate, which became a problem in a rising rate environment as borrowers didn’t have the wherewithal to make their growing mortgage payments. Regulators were slow to respond, in part because they didn’t have jurisdiction over the more egregious players.
It is much too early to conclude that nonfinancial businesses will end the current cycle in the way subprime mortgage borrowers did the previous one. Even so, while there are significant differences between leveraged lending and subprime mortgage lending, the similarities are eerie.
We will make a longer post later on this important issue, but it does highlight that even amid the booming US markets, the bears are stalking their prey.
Finally, to round out our review, the fear index – the VIX was lower, down 3.38% to 11.99 on Friday, Gold was higher, up 1.53% to 1,213, though still well down across the year and Bitcoin ended the week at a slightly higher 6,722, up 3.5% on Friday though just one day after the U.S. Securities and Exchange Commission (SEC) rejected proposed rule changes for nine bitcoin ETFs, the Commission initiated a review of all related decisions. As a result, three rejection orders made on August 22 are now stayed pending the review by the SEC Chairman and the Commissioners. This is the first time the SEC initiated a review of its staff decisions on bitcoin ETFs. Their initial rejections were driven by concerns about the underlying markets so this just might indicate a change of view. Bitcoin of course is way off its highs of more than 18,000, but this might just signal a change in sentiment. We will see.
So in summary, the Bears are in town!
Welcome to the Property Imperative weekly to 11th August 2018, our digest of the latest finance and property news with a distinctively Australian flavour. Another week, more data, so let’s dive straight in.
And by the way, if you value the content we produce please do consider joining our Patreon programme, where you can support our ability to continue to make great content.
Watch the video, listen to the podcast or read the transcript.
We start with the trauma from Turkey which showed how fragile the financial markets are at the moment. Turkey’s finance minister (the President’s Son in Law) unveiled a new plan for their economy. The new economic stance will be one with “determination” — that’s a key part of it, he said. It will “transform” Turkey’s economy. It will also have a “strategic” and “powerful infrastructure.”
U.S. President Trump has repeatedly lashed out at Turkey over the continued detention of pastor Andrew Brunson, whom Turkish officials accuse of terrorism for his part of the failed 2016 coup, and no progress was made as delegates from both NATO countries met in Washington this week. Then Donald Trump, tweeted that he would double tariffs on Turkish steel and aluminum products.
As a result, the Turkish Lira plummeted further. In the course of an hour, it reached a new low of 6.80 to the dollar, marking its worst daily performance in over a decade. This from Bloomberg:
It recovered a little afterwards, but it has lost about 40% of its value against the dollar since the start of the year.
Many fear the fallout could spread beyond Turkey’s border, prompting traders to abandon riskier assets like stocks in search of safe-havens like gold, yen and Treasuries. Volatility, as measured by the VIX “fear index”, rose nearly 17%, highlighting investor concerns about the broader impact of a possible crash in Turkey’s economy.
One analyst said the exposure to a slump in Turkey’s economy is “pretty international,” though limited to the banking sector, but data from the Bank for International Settlements showed that Japanese banks are owed $14 billion, U.K. lenders $19.2 billion and the United States about $18 billion. Enough to make a dent.
The Turkish Lira also moved the same way against the Euro, up 14.33%. “We’re not going to lose the economic warfare” being waged against Turkey said President Erdogan.
In the US, core consumer prices rose by their quickest pace in a decade in July and topped market forecasts, keeping the Federal Reserve on track to raise interest rates twice more this year. The data add to a robust picture of the US economy, which grew by a speedy annual rate of 4.1 per cent in the June quarter. The unemployment rate is close to its lowest level in 18 years. Core inflation, which strips out volatile energy and food prices and is closely followed by the Fed, rose 2.4 per cent year on year in July and up from 2.3 per cent in June. That was the fastest annual pace of core inflation since September 2008.
While headline inflation is rising more quickly than average hourly earnings, wages may pick up given the strength of the labour market. The Fed seems well positioned to carry on tightening policy at its current pace, with no reason to either speed up or slow down. That said, the Turkish situation took the probability of two more cuts down a little according to Bloomberg.
The US dollar was relatively steady following the inflation data. The DXY index, tracking the US currency against a weighted basket of global peers, was up 0.8 per cent following the inflation figures, having been up 0.6 per cent before the data release. The index rose above 96 on Friday for the first time in 11 months.
Looking at the US indices, the NASDAQ slipped 0.67% to 7,838 on Friday, while the DOW Jones Industrial slipped 0.77% to 25,313. Gold futures slide a little to 1,219 and Copper was down 0.74% to 2.75. Oil futures rose 1.45% to 67.78, as the International Energy Agency warned that the recent cooling in the market may not last. Bitcoin was weaker, down 6.03% to 6,153, not helped by the news that creditors of the defunct coin exchange Mt. Gox are trying to recoup money.
European shares also fell on Friday as worries over a dramatic fall in the Turkish lira jolted financial markets amid concerns of the region’s banks’ exposure to upheaval in Turkey. The Germans DAX fell 1.99% to 12,424.
Asian stocks closed mostly lower on Friday as global investors opted to sell risk assets while they also continued to assess the impact of the latest tit-for-tat in the trade war between the U.S. and China.
China’s Shanghai Composite index managed to eke out meagre gains on high volatility. The index had recorded seven straight swings of 1% or more, the longest stretch since Chinese markets crashed in 2015.
In other emerging markets currency, the Russian rouble continued its decline, hitting fresh two year lows, after the US imposed fresh sanctions against the Kremlin for its alleged part in poisoning a former British spy and his daughter in the UK. It closed at 67.71, up 1.52%.
The Aussie continued to slide, as expected, down 1.04% on Friday to 72.96. And we also slipped against the British pound, down 0.63%.
Trade Tariffs continue to worry the market, with Fitch suggesting there is every reason to believe the United States’ trade dispute with China will get worse before it gets better, and that the US trade deficit will widen further rather than shrinking.
Now that they are on the receiving end of US tariffs, Chinese policymakers have three options. First, they could capitulate, by scaling back many of the “discriminatory practices” identified in the US Trade Representative’s March 2018 report on technology transfers and intellectual property. So far, there is no indication that China is considering this option. Second, China could escalate the dispute. It could set its own tariffs higher than those of the US, apply them to a larger range (and greater dollar value) of US exports, or offset the impact of US tariffs on Chinese exporters by allowing the renminbi to depreciate against the dollar. Alternatively, policymakers could look beyond trade in goods to consider capital flows and related businesses associated with US firms, effectively allowing the authorities to impede US financial and nonfinancial firms’ Chinese operations. As with the first option, this one seems unlikely, at least at this stage of the dispute. So far, China has chosen the third option, which lies between capitulation and escalation. China has retaliated, but only on a like-for-like basis, matching US tariff rates and the dollar value of trade affected. At the same time, it has tried to claim the moral high ground, by eliciting international condemnations of protectionism and unilateralism. This hasn’t been difficult, given that several other major economies are currently facing US tariffs. Securing such third-party buy-in is critical for the Chinese leadership’s domestic position. If the government were perceived at home as being bullied by the US, it would have to take a much tougher line in the trade dispute.
Fitch thinks that the US actually has rather limited options, despite having initiated the dispute. Even for a notoriously unpredictable administration, a full and unconditional reversal on tariffs seems out of the question. But so is the status quo, now that China has already levelled the playing field by retaliating in kind. That leaves only escalation – a possibility that the Trump administration has already raised by threatening additional tariffs on all imports from China
With the US locked in a trade war with China and other nations, Gregory Daco at Oxford Economics suggested that higher tariffs could gradually filter through to producer and consumer prices, supporting expectations of a gradual pick-up of inflationary pressures.
Locally, the RBA released its quarterly Statement on Monetary Policy with updated forecasts for inflation, unemployment and economic growth. The central bank has downgraded its inflation forecast for 2018. The RBA now expects both core and underlying inflation to rise by 1.75% to December 2018, down from the May forecasts of 2.25% and 2% respectively. Beyond that time frame, the central bank kept its inflation forecasts relatively unchanged. Previously, it expected both core and underlying inflation to reach 2.25% by the middle of 2020. In Tuesday’s rate announcement, Lowe also said that “a further gradual decline in the unemployment rate is expected over the next couple of years to around 5%”. The bank has maintained its forecasts that the unemployment rate will stay at around 5.25% through to June 2020, before dropping to 5% in December.
It’s also worth looking at Lowe’s speech on Wednesday, when he said that “Electricity prices in some cities have declined recently after earlier large increases, and changes in government policy are likely to result in a decline in child care prices as recorded in the CPI,” Lowe said. “There have also been changes to some state government programs that are expected to lead to lower measured prices for some services.” In Tuesday’s rates decision, Lowe said “the central forecast is for inflation to be higher in 2019 and 2020 than it is currently”.
The central bank slightly bumped up its forecasts for GDP growth in Q2 2018, to 3% from 2.75%. Longer-term, the bank’s growth projections were little-changed. It still expects GDP growth to average 3.25% over the next two financial years, before falling to 3% in June 2020 and remaining at that level through to December.
Given the projections were the first to include a time frame out to December 2020, the forecasts confirmed that underlying inflation pressures are expected to remain low for at least the next two and a half years. The latest set of projections confirmed that the RBA still looks set to keep interest rates on hold for the foreseeable future.
The Royal Commission hearings were back with avengence this week, with NAB’s MLC Wealth management business in the spotlight first, and later in the week IOOF. We saw more of the poor cultural norms on display, with investors being charged for no service, and attempts to block the release of documents and the late delivery of evidence to the commission. In fact, the CEO of NAB went as far as releasing an apology in Twitter. NAB shares ended up slightly to $28.09.
Shares in IOOF, Australia’s second largest wealth manager fell as senior executives from the fund manager appeared before the commission. At the close, the shares were down 2.7% to $8.73. Questioning in the royal commission centred around payments to related parties and the flow of cash back to the super fund from external fund managers when IOOF invests in those funds. Michael Hodge, senior counsel assisting the royal commission, said: “One of the things we are trying to understand is how trustees go about dealing with these volumes based fees where a percentage of the investment of the trust’s money is being paid to another part of the retail group.” Tendered to the commission today was a letter from prudential regulator APRA to IOOF about the conflicts of interest between members of the IOOF super fund and shareholders of IOOF.
The bottom line, is that poor corporate behaviour and the inability of regulators to get to the key facts was again in evidence, and again, consumers lose out as a result. It is shameful.
The CBA’s full-year results to 30 June 2018 (FY18) highlighted the pressure on Australian banks with an increase in wholesale funding costs squeezing CBA’s net interest margin in 2H18, slower loan growth and continued investment into the business and compliance contributed to higher expenses. Mortgage arrears also trended upwards due to some pockets of stress, and while they have not translated into higher provision charges as yet due to strong security values, continued moderation in Australian house prices may result in higher provisioning charges in future financial periods. CBA shares were up 0.03% on Friday to 75.39, and several commentators are claiming the worst is over for them, unlike for AMP, who also reported, and whose shares remain in the doldrums, reflecting the major changes to turn that ship around. Suncorp also reported and they did pretty well in the tight market, their shares rose after their results, and now stands at 15.63.
However, expect more bad news ahead, placing pressure on profit growth for all Australian banks. Increased regulatory and public scrutiny of the sector may make it difficult for the larger banks to reprice loans to incorporate the increase in wholesale funding costs, meaning net interest margins are likely to face some downward pressure. Loan growth is likely to further slow as the housing market continues to moderate, while compliance costs continue to rise due to the scrutiny on the sector. And of course the most prominent scrutiny is the royal commission into misconduct in the banking, superannuation and financial services industry, which has already identified a number of shortcomings within the industry.
That said, CBA’s FY18 results show a level of resiliency despite these issues. The bank reported cash net profit after tax from continuing operations declined 5% to AUD9.2 billion in FY18, but this was driven by a number of one-off charges, including a AUD700 million fine to settle a civil case in relation to breaches of anti-money laundering and counter-terrorism financing requirements. Cash net profit after tax from continuing operations rose by 4% to AUD10.0 billion when the one-off items were excluded.
CBA has much more to do to fix its reputation, and strong capital ratios are not sufficient to allay the concerns in the business. It is more about culture and putting customers first.
So, perhaps no surprise this week, the Greens called for the big banks to be broken up. They said “It’s time that banks became banks again. Australians are sick and tired of these massive financial institutions getting away with murder because they can throw stacks of money at the two old political parties. Our banks should be working for us, not against us and this policy will make sure that happens.
Under the Greens proposal: Banks will no longer be able to own wealth management businesses that both create financial products and spruik them to unsuspecting customers. Consumers will be able to easily distinguish between the simple and essential products and services that the vast majority of Australians use—deposits and loans, superannuation and insurance—and the more complex and selective activity that is the domain of big business, the wealthy, and the adventurous. By removing hidden conflicts of interest, Australians will be able to trust that the advice they’re getting from their banker is designed to line their own pocket, not the other way round. The watchdogs have failed. They would strip ASIC of its responsibility for overseeing consumer protection and competition within the essential services of basic banking, insurance and superannuation and return them to the ACCC.
But we believe there is much more to do than just breakup the banks. We will be discussing this in a future post. The major banks have too much market power, as we discussed on our recent video How Much Market Power Do “The Big Four” Hold? and they continue to milk customers using poor business practice, for example in the home loan market, the mortgage rate you get is hard to compare, and obtuse. We discussed this in our show “Price Information In the Home Loan Market”.
You might also like to watch our show on the latest lending statistics and mortgage stress data, “Lending, Stress and All Things DFA”, as we are not going to have time to cover these today.
So quickly to the property market. Once again prices continue to fall in the main centres of Sydney and Melbourne.
In terms of auctions, CoreLogic says that last week the number across the combined capital cities fell with 1,324 held with a final clearance rate of 54 per cent, down from the previous week. Combined clearance rates have levelled out somewhat remaining within the low to mid 50 per cent range for 13 consecutive weeks. They note that despite the continued slowing in the market, clearance rates are still tracking higher each week relative to the same period in 2012; during the last significant downturn in home values.
Melbourne’s final clearance rate came in at 57 per cent across 629 auctions last week compared with 911 last year returning a substantially higher clearance rate of 73.9 per cent. Sydney’s final auction clearance rate fell to 51.9 per cent across 462 auctions last week, down on the previous weeks. In same week last year, 620 homes went to auction and a clearance rate of 66.4 per cent was recorded.
This week, 1,320 capital city auctions are currently being tracked by CoreLogic; remaining relatively steady on last week’s final result which saw 1,324 auctions held. Over the same period one year ago, there was a considerably higher 2,040 homes taken to auction.
In June, according to the latest ABS housing finance data, first-home buyers accounted for 18.1% of the growth in owner-occupier loans, continuing a trend seen throughout this year. The chart from the RBA helps illustrate the effect that first home-buyers are having on the market. Clearly, there’s a trend underway in Sydney and Melbourne: The value of cheaper homes is holding up, while more expensive home prices have gone into reverse.
This is explained by increasing incentives in NSW and Victoria for first time buyers, and also more lower priced small apartments are coming on stream. The figures tie in with recent trends evident in the Sydney market, with more evidence of recent price falls among higher-end properties valued above $2 million.
Of course the question is, with prices falling, and likely to continue to fall further, could first time buyers get a better deal later by waiting for further falls. That, in my view is a tricky call but our modelling of future credit growth suggests first time buyers will continue to prop up the lower end of the market for some time to come yet.
And finally today, mark your diary, the next DFA live stream event will be on Tuesday 21st August at eight PM Sydney. I will be providing more information shortly about the event, but is already scheduled on the channel if you want to set a reminder. And feel free to send questions in beforehand.
Welcome to the Property Imperative weekly to 4th August 2018, our digest of the latest finance and property news with a distinctively Australian flavour.
By the way if you value the content we produce please do consider joining our Patreon programme, where you can support our ability to continue to make great content.
Watch the video, listen to the podcast, or read the transcript.
A big week of news to cover, so let’s get straight in at the deep end with the Productivity Commission report on Competition in Financial Services which was released on Friday. The final report, which was released earlier than expected really highlights the never-mind-the customer attitude of the industry and its regulators. They call out regulatory failure and conflicts of interest across the sector, referring to opaque pricing, unsuitable products, no reward for customer loyalty as well as product complexity and faux competition. Major players have too much market power, and have fingers in multiple segments of the market. Customers lose out as a result. They made a wide range of recommendations, including the introduction of a best interest obligation for all providers in the home loans market, mortgage Brokers trail commissions should be phased out, ASIC to ensure that the interests of borrowers are adequately safeguarded in the LMI market, APRA is singled out for myopic regulation. ACCC should focus on encouraging competition across the industry and safeguarding the interests of consumers in the regulatory system, the new payments system needs a proper access regime and the Payments System Board of the RBA should ban all card interchange fees. We discussed the implications in our recent video, and the link to that is above. In summary a number of critical reforms which if implemented could certainly change the landscape for financial customers in Australia for the better, whilst clipping the wings of the major incumbents. We discussed this on ABC Radio. Good Job, Productivity Commission. Let’s now see if the Government is up to the challenge.
There was a bit of good news on the retail front, with turnover for June, the month of the end of year sales, where deep discounting was the hallmark. The ABS says retail turnover rose 0.4 per cent seasonally adjusted, which follows a 0.4 per cent rise in May. The trend estimate, which I prefer, reported a 0.3 per cent in June following a rise of 0.4 per cent in May 2018. Compared to June 2017, the trend estimate rose 3.1 per cent. In trend terms, clothing and footwear rose 0.7%, department stores rose 0.5% and household goods 0.3%. Across the states, New South Wales and Victoria rose 0.5%, ACT 0.8% and Tasmania 0.9%. Queensland was flat and WA rose just 0.1%, so again the variations are significant. Online retail turnover contributed 5.7 per cent of total retail turnover in original terms in June 2018, a rise from 5.6 per cent in May 2018. In June 2017 online retail turnover contributed 4.1 per cent to total retail.
This means households are spending more than their income growth, by continuing to tap into their savings. So it will be interesting to see if the retail momentum continues, or sags in July after the end of season sales.
Continuing the “cat among the pigeons” theme, ANZ parted company from its competitors by cutting its variable home loan rate for new customers. While banks including the CBA have cut fixed loan rates and offered “honeymoon deals” in recent weeks, the ANZ is the first to move on variable rates. The ANZ told mortgage brokers it was bringing down its basic principal and interest home rate for owner-occupiers by 0.34 percentage points to 3.65 per cent. The ANZ offer only applies to new customers looking for a loan valued at 80 per cent or less than the value of their property. Loan-to-value ratios above 80 per cent remain unchanged at 3.99 per cent. As we discussed in our separate post “ANZ Ups The Ante In The Mortgage Wars” – the industry is homing in on lower risk customers in an attempt to maintain loan book growth. We also discussed this significant event on 2GB’s Money Show with Ross Greenwood. As Ross said, picture the lions around a shrinking watering hole trying to protect their territory!
Also this week ASIC released their review of exchange traded products (ETP’s) in Australia. These are open-ended investment products that are traded on a securities exchange market. ETPs trade and settle like shares and give investors exposure to underlying assets without owning those assets directly. They differ from listed funds because they are open-ended. This means that the number of units on issue may increase or decrease daily depending on investor demand. ETPs, especially exchange traded funds (ETFs), are increasingly popular with retail investors and self-managed superannuation funds (SMSFs). This is because of their accessibility, perceived low cost, transparency, intraday liquidity, diversification benefits and ability to provide exposure to new asset classes. There has been steady growth in both funds under management and the number of ETP products available on the market in Australia. ASIC called out a number of concerns, including the question of spreads and liquidity, the concentration of market makers, and the lack of good disclosure. More of the same-ol’ same -ol’. Potential investors should be wary.
Data from the Household, Income and Labour Dynamics in Australia HILDA survey came out this week and showed again the rise in the proportion of the household population who is renting, with the number of Australian renters eventually becoming homeowners plummeting over the last 15 years – particularly for those between the ages of 18 and 24. The survey found the overall proportion of people living in rental accommodation has increased by 23 per cent since 2001 to 31.3 per cent in 2016. They called out “The growing evidence of ‘intergenerational inequality’”. The data also chimes with our surveys, that more households are under financial pressure thanks to flat incomes and rising costs. It’s worth highlighting their data only runs to 2016, so it’s already a couple of years old. We think the trends continue to grow, based on our latest Mortgage Stress data which will be out next week.
And another survey from mortgage lender State Custodians found that as many as 15% of surveyed homeowners have faced challenges when trying to refinance, due to falling property prices. The figures published by State Custodians also revealed that young people were the most affected, with around 34% of those under the age of 34 saying they’ve been unsuccessful in re-financing because of declining property values. This highlights the rise of “mortgage prisoner’s” who cannot refinance to get the better deals because of little or no equity, or other financial pressures.
And talking of households in financial pressure, the number of Australians falling behind on their mortgages will rise in the next two years as interest-only loans end and repayments get more expensive, ratings agency Moody’s warned this week. Delinquencies on loans that have converted from interest-only to principal and interest are running at double the rate of those still on interest-only, they said. About 40 per cent of loans by Australian banks in 2014 and 2015 were interest-only for five years, meaning a large portion are set to come under pressure with higher repayments in 2019 and 2020, said Moody’s. This backs up our findings, which estimates that more than 970,000 Australian households are now believed to be suffering housing stress. We discussed this in our video Wither Interest Only Loans.
Genworth, the Lender’s Mortgage Insurer related their 1H18 results this week and their profit remains under pressure, as claim rates rise. The Delinquency Rate increased from 0.51% in 1H17 to 0.54% in 1H18, and they pointed and increase in the number of delinquencies in Western Australia, New South Wales and to a lesser extent South Australia. This was partially offset by a decrease in delinquencies in Victoria and Queensland. New delinquencies were down in the half (1H18: 5,565 versus 1H17: 5,997). Delinquencies in mining areas are showing signs of improving. In non-mining regions there are indications of a softening in cure rates.
Turning now to property, the home price slides continue, as we discussed in our post “Home Price Falls Are Just Starting (…more to come!). We discussed the importance of looking at the local, micro property markets as the averages mean nothing. For example, over the past year prices are down more than 20% in some suburbs, and not necessarily where you might expect.
And talking of videos, do check out the latest in our series of Adams/North discussions, “The Great Airbrush Scandal – Policy Failure of the Year!”, where we dissect APRA’s Bank Stress Tests and conclude they were not fit for purpose. This one has already generated a large number of comments and observations. John suggests our regulators are asleep at the wheel! You can also read his original article.
Corelogic says Auction volumes are lower across each individual capital city this week with 1,224 homes scheduled to go under the hammer, down from 1,536 last week. A further sign of weakness in the property sector. Melbourne is particular is slowing fast.
Last week the homes taken to auction across the combined capital cities, returning a final auction clearance rate of 55.6 per cent, down from 57.0 per cent across 1,257 auctions the previous week. Over the same week last year, 1,987 homes went to auction and a clearance rate of 68.7 per cent was recorded. Melbourne’s final clearance rate was recorded at 58.5 per cent across 802 auctions last week, compared to 59.9 per cent across 613 auctions over the previous week. This time last year 956 homes were taken to auction across the city and a much stronger clearance rate was recorded (75.6 per cent). Sydney’s final auction clearance rate came in at 52.4 per cent across 469 auctions last week, down from 55.2 per cent across 407 auctions over the previous week. Over the same week last year, 714 homes went to auction returning a clearance rate of 65.4 per cent. Across the smaller auction markets, clearance rates improved across Canberra and Perth, while Brisbane and Adelaide saw clearance rates fall week-on-week. There were no auctions recorded in Tasmania last week. Of the non-capital city auction markets, the Hunter region was the best performing in terms of clearance rate, with 10 of the 14 reported auctions selling (71.4 per cent), followed by Geelong with a 65.0 per cent clearance rate across 20 results. The busiest region for auctions was the Gold Coast where 39 homes were taken to auction, returning a clearance rate of just 32.3 per cent.
Building approvals in June were slightly stronger in trend terms, rising by just 0.1% as reported by the ABS. The Mainstream media fixated on the stronger, but less reliable seasonally adjusted figures. Among the states and territories, dwelling approvals rose in June in the Australian Capital Territory (5.8 per cent), South Australia (5.6 per cent), Northern Territory (4.8 per cent), Tasmania (2.2 per cent), Western Australia (1.7 per cent) and New South Wales (0.2 per cent) in trend terms. Dwelling approvals fell in trend terms in Queensland (1.6 per cent) and Victoria (1.2 per cent). Overall momentum is slowing in our view, as demand for high-rise investment apartments ease.
And overall lending for housing is still tracking higher despite investor lending sliding, according to the latest RBA and APRA figures for June. Owner occupied housing lending rose 0.6% or $6.6 billion to $1.18 trillion, while investment lending fell $800 million, down 0.1% in seasonally adjusted terms, or rose $1 billion, up 0.2% in original terms. (I have no idea what adjustments the RBA makes, it’s not disclosed!). Investment lending fell to 33.5% of the portfolio. Total lending for housing is a new record $1.77 trillion, and remember this is at a time when housing debt to income is knocking on the 200 door, and we are one of the most in debt nations on the planet. Lest we forget, loans need to be repaid, eventually! We discussed both the credit data and the building approvals in our video “Another Housing Record Set”. We have not fundamentally addressed the credit elephant in the room. Despite all the noise. Perhaps the regulators would like to tell us, how much debt is too much? We clearly have not hit their pain threshold yet, despite the rising financial stress in many households.
So to the markets. Locally, the ASX100 finished down a little on Friday to 5,126, still significantly higher than earlier in the year. The banks were down, for example, CBA fell 1.15% on Friday, to end the week at 72.83, in reaction to the Productivity Commission report. Westpac fell 0.96% to end at 28.91. AMP also fell, down 0.85% on Friday, to 3.50, despite a broker’s report suggesting there may be long term value in the stock, after a restructure. The market was perhaps not convinced.
The Aussie was below 74 cents against the US dollar, despite a small rise on Friday, to 73.97, but higher, up 0.29% to 5.05 against the Chinese Yuan. It appears China is flexing its currency muscles in response to the US trade tariffs.
The Bank of England lifted their cash benchmark rate 0.25% to 0.75% as inflation is above the lower bounds target, despite the uncertainty surrounding Brexit (be it hard or soft). The Aussie was up 0.62% on Friday against to UK Pound to 0.56 cents in reaction to the news.
Across the pond in the US market, Apple took market attention for a host of reasons this week, including reaching a historic Wall Street milestone by becoming the first U.S. company to hit $1 trillion in market capitalization. Apple Inc stock hit the target number of $207.05 (based on the numbers of shares outstanding reported in its 10Q) just before noon on Thursday. Shares closed solidly above that Friday at 207.99. Shares moved into trillion-dollar territory following a strong earnings report earlier this week. On Tuesday, Apple’s fiscal third-quarter results beat on the top and bottom lines, driven by sales of the pricier iPhone X and subscription revenue to services such as Apple Music and its App Store. Apple also lifted the cloud that was hovering over the tech sector following weak reports from Facebook and Twitter. The NASDAQ ended the week at 7,812, a strong finish, but not a record, despite the Apple price. The S&P Information Technology sector index finished at 1,277.05 Friday, compared with 1,262.27 a week ago.
The July US employment report gave the market more evidence that the economy is humming along at a pace that won’t alarm the Federal Reserve. Although the rise in nonfarm payrolls was less than expected for July, jobs gains for the two previous months were revised up by 59,000, making the overall rise about in line with forecasts. And average hourly earnings showed wage inflation at the same year-on-year pace as before. That leaves the Fed set up to continue its plan of gradually rising rates. “The economy is growing really strongly and headline inflation set to hit 3% next week, so the case for September and December Fed rate hikes remains strong,” ING Chief International Economist James Knightley said.
Fed fund futures are still pricing in the next rate hike to be at the next September 25-26 meeting. Odds for an additional increase in December remained little changed after the release at around 65%.
The Fed had its say this week as well. The Federal Open Market Committee kept rates unchanged as expected, and also kept the language in its statement substantially the same. The FOMC said it continues to expect that further gradual increases in the target range for the federal funds rate will be consistent with “sustained expansion of economic activity, strong labor market conditions and inflation near the Committee’s symmetric 2% objective over the medium term.” That reaffirmed investor expectations that the central bank remained on track to hike rates twice more this year. “The stance of monetary policy remains accommodative, thereby supporting strong labor market conditions and a sustained return to 2 percent inflation,” the Fed said in its statement.
A report on Tuesday showed that the Fed’s preferred measure of inflation, the core personal consumption expenditures price index, which excludes food and energy prices, was up 0.1% and 1.9% on a year-over-year basis. The Fed targets inflation of 2%.
Oil settled lower for the day and week Friday, as concerns about a trade war stifling demand hurt sentiment. On the New York Mercantile Exchange crude futures for September delivery fell 47 cents to settle at $68.65 a barrel. Oilfield services firm Baker Hughes reported on Friday that the number of U.S. oil drilling rigs in operation fell by 2 to 861, pointing to tightening U.S. output. And the weekly oil inventories numbers showed an unexpected rise in U.S. stockpiles, further weighing on prices. Concerns also remained about escalating output from the OPEC and Russia. On June 22-23, OPEC, Russia and other non-members agreed to return to 100% compliance with oil output cuts that began in January 2017, after months of underproduction elsewhere had pushed adherence above 160%. Even though output continued to decline in Iran, Libya and Venezuela, the survey suggested that compliance had only fallen to 111% in July, suggesting more room for increasing production from the likes of Saudi Arabia or OPEC’s non-member ally Russia.
Trade worries whipsawed this week, keeping the market on edge, amid conflicting reports of U.S. action and proposed retaliation from China. Tensions on Wall Street eased significantly on Tuesday on a report from Bloomberg that both sides were trying to restart trade talks. But that was quickly countered by another report that the U.S. was considering raising tariffs on $200 billion in Chinese goods to 25% from 10%, which the White House later confirmed was under consideration. On Friday, China shot back with a potential plan for tariffs on $60 billion of U.S. goods. “The U.S. side has repeatedly escalated the situation against the interests of both enterprises and consumers,” China said, according to Reuters. “China has to take necessary countermeasures to defend its dignity and the interests of its people, free trade and the multilateral system.” White House Economic adviser Larry Kudlow warned China not to underestimate President Donald Trump.
The Dow Jones ended at 25,462, up 0.54%, high, but not at a peak, while, the US Dollar Chinese Yuan sat at 6.83, right at the top of its range, and China exerts pressure on the rate.
Bond rates were down a little, with the 10 Year benchmark sitting at 2.95, well down from its 3.12 in May. At the short end, the 3-month bond rate is 2.00, still at the top of its range. Libor is still sitting at 2.34, at the top of its range, signalling higher funding costs in the system.
Gold continues lower, at 1,222, as many risk investors are favouring the US Dollar at the moment. Bitcoin ended the week at 7,443 up 0.65% on Friday, but below its recent highs.
So back once more to cats and pigeons. Next week we will be hearing the latest from the Royal Commission in sessions covering wealth management. NAB and MLC are up first, but I will be especially interested in the evidence from the Industry superfunds. We suspect more revelations as the Commission works its magic. And the results from CBA will be a highlight, it will be interesting to see what they report in terms of net interest margin. I am expecting more loan repricing, both up and down.
It’s never a dull moment in the finance and property sector, so expect more turbulence ahead. The bumpy ride continues….
Welcome to the Property Imperative weekly to 28th July 2018, our digest of the latest finance and property news with a distinctively Australian flavour.

Watch the video, listen to the podcast, or read the transcript.
By the way, if you value the content we produce please do consider joining our Patreon programme, where you can support our ability to continue to make great content.
Today we start with local economic news. The latest headline inflation rate came it at 2.1%, but the relevant underlying rate was 1.9%. This is even below the 2.0% the RBA forecast in May and continues the trend here, and elsewhere. Economists are scratching their heads as to why, some referring to the not so trusty Phillips curve, globalisation, charging work practices, automation, or something else. We suspect the high consumer debt and limited spending power has played a significant role. Despite the low number, we do not expect the RBA to react with a rate cut.
Rising costs continue to hit households, for example, in annual terms, transport rose 5.2%, and tobacco by 7.8%, plus higher electricity costs, fuel and child care expenses. It also worth noting the regional variations. Sydney rose 2.1 per cent, Melbourne rose 2.5 per cent, Brisbane rose 1.7 per cent, Adelaide rose 2.7 per cent, Perth rose 1.1 per cent, Hobart rose 2.4 per cent, Darwin rose 1.2 per cent, and Canberra rose 2.8 per cent. For more, see our separate post “Debt Crisis – What Debt Crisis” where we discuss the cpi figures in the context of household debt – here is the link and it’s in the comments below. Otherwise it was a quiet week for Australian economic data. But it’s worth remembering that policy interest rates less consumer price inflation is all still negative around the world. Not pretty.
The US Bureau of Economic Analysis released their GDP Data overnight. The US real gross domestic product increased at an annual rate of 4.1 percent in the second quarter of 2018. This is based on that’s called the “advance” estimate, so it may change ahead. The first quarter, real GDP increased by a revised 2.2 percent. In addition to the rise in consumer and business spending, increases in exports and government spending also helped. Personal consumption expenditures rose 4 percent while business investment grew 7.3 percent and federal government outlays increased by 3.5 percent. Exports rose in part as farmers rushed to get soybeans to China ahead of expected retaliatory tariffs to take effect in the coming days. Declines in private inventory investment and residential fixed investment were the main drags. President Donald Trump himself tweeted a few days ago that the U.S. has the “best financial numbers on the planet,” while National Economic Council Chairman Larry Kudlow predicted on Thursday that Q2 GDP will be “big.” The administration has used a mix of tax cuts, deregulation and spending increases to push growth. White House budget director Mick Mulvaney told CNBC earlier this week that deregulation likely has had the most impact so far as companies feel more comfortable about committing capital. The next question will be whether the growth spurt is sustainable. There were several jumps in GDP under former President Barack Obama. In 2014 there was a 5.1 percent rise in the second quarter. But by the end of 2015, growth had slowed to 0.4 percent. Federal Reserve officials forecast GDP to rise 2.8 percent for all of 2018 but then to tail off to 2.4 percent in 2019 and 2 percent in 2020. Some economists worried that the jump in consumer spending for the April-to-June period may not be sustainable, adding to scepticism that the gains will continue.
However, the numbers support the Fed’s current plan of gradual interest rate hikes. Fed fund futures continued to price in a rate hike in September and the probability for a hike in December was last at 68.9%, compared to 69.5% before the release. Meantime the US Bond rates are continuing to push higher, with the 3-Month rate slightly up to 1.992, while the 10-year sits just below 3%, and the 30 Year at 3.085. Thus the compression between short term and long term rates continues to bite.
In comparison’ China’s GDP growth remains stronger at 6.8% in the first half, and the IMF is estimating a 6.6% full year out-turn, reflecting the lagged effect of regulatory tightening and softer external demand. Risks are tilted to the downside, with tightening global financial market conditions and rising trade tensions. If the authorities move more decisively to resolve the policy tensions now and focus on higher-quality growth and a greater role for the market, near-term growth would be weaker but longer-term growth would be stronger and more sustainable. An illustrative “proactive” scenario features faster reform progress, particularly state-owned enterprises (SOE) reform and resolving zombie firms, which also accelerates rebalancing from investment to consumption. If there is a risk of a too sharp slowdown, a temporary fiscal stimulus package with resources to support rebalancing could help cushion the near-term adverse impact.
The Chinese Yuan US Dollar fell 0.44% on Friday to 0.14, and the Chinese Yuan Australian Dollar fell 0.43% to 0.19. The Aussie Dollar remains weaker against the US currency, and we expect this to continue.
The key question ahead is the extent to which the rate of quantitative tightening really starts to bite. According to Fitch Ratings, the combined net asset purchases of the four central banks that engaged in quantitative easing (QE) will turn negative in 2019, one year earlier than previously estimated. This underscores the shift in global monetary conditions that is underway – as strong global growth continues and labour markets tighten – and could portend an increase in financial market volatility.
The four “QE” Central Banks (CBs) – i.e. the Fed, European Central Bank (ECB), Bank of Japan (BOJ) and Bank of England (BOE) – made net asset purchases equivalent to around USD 1,200 billion per annum on average over 2009 to 2017. This is set to slow significantly this year to around USD 500 billion as the Fed’s balance sheet shrinks, the BOJ engages in de facto tapering and ECB purchases are phased out by year-end. More significantly, combined net asset purchases are expected to turn negative next year as the decline in the Fed’s balance sheet will be larger in absolute terms than ongoing net purchases by the BOJ.
They say that private sector investors will be called upon to absorb a much greater net supply of government debt in the coming years as CB reduce holdings and government financing needs persist in Europe and Japan and rise sharply in the US. This will put more pressure on bond rates ahead.
Then of course there is the trade wars question. An escalation of global trade tensions that results in new tariffs on USD 2 trillion in global trade flows would reduce world growth by 0.4% in 2019, to 2.8% from 3.2% says Fitch Ratings‘ June 2018 “Global Economic Outlook” baseline forecast. The US, Canada and Mexico would be the most affected countries. They modelled a scenario in which the US imposes auto import tariffs at 25% and additional tariffs on China, where trading partners retaliate symmetrically, and NAFTA collapses. They factored in new tariffs on a total of USD 400 billion of US goods imports from China in the simulations in light of recent statements from the US administration. The tariffs under this new scenario would cover 90% of total Chinese goods exports to the US when added to tariffs on USD 50 billion of exports already announced. They suggest that the global drop of 0.4%.
The tariffs would initially feed through to higher import prices, raising firms’ costs and reducing real wages. Business confidence and equity prices would also be dampened, further weighing on business investment and reducing consumption through a wealth effect. Over the long run, the model factors in productivity being affected as local firms are less exposed to international competition and so would face fewer incentives to seek efficiency gains. Export competitiveness in the countries subject to tariffs would decline, resulting in lower export volumes. The negative growth effects would be magnified by trade multipliers and feed through to other trading partners not directly targeted by the tariffs. Import substitution would offset some of the growth shock in the countries imposing import tariffs. The US, Canada and Mexico would be the most affected countries. GDP growth would be 0.7% below the baseline forecast in 2019 in the US and Canada and 1.5% in Mexico. The level of GDP would remain significantly below its baseline in 2020. China would be less severely impacted, with GDP growth around 0.3% below the baseline forecast. China would only be affected directly by US protectionist measures in this scenario, whereas the US would be imposing tariffs on a large proportion of its imports while being hit simultaneously by retaliatory measures from four countries or trading blocs. US tariffs would hit Chinese imports like mobile phones, laptops, clothing and footwear, all of which may mean consumers will spend less. Meantime, Australia and other countries would likely be caught in the cross-fire, so some extent.
But perhaps the market’s trade-war worries may have hit an inflection point this past week. Trump proclaimed the United States and the European Union had launched a “new phase” in their relationship following a meeting with European Commission President Jean-Claude Juncker on Wednesday. The leaders pledged to expand European imports of U.S. liquefied natural gas and soybeans and both vowed to lower industrial tariffs. They also agreed to refrain from imposing car tariffs while the two sides launch negotiations to cut other trade barriers, as well as re-examine U.S. steel and aluminum tariffs and retaliatory duties imposed by the EU “in due course.” The upbeat remarks helped ease some of the fears of a transatlantic trade war. But there is still China to consider. China said Thursday it was ready to retaliate against any increase in U.S. tariffs on Chinese imports — be it $16 billion or $200 billion — an official in Beijing said, according to Bloomberg.
And just remember the US is funding its growth by running higher deficits, and the tax cuts for corporates has led to a cut in taxes from that sector, a skewed the tax take significantly towards individuals. More pressure on US households.
Looking across the markets, the ASX 100 ended the week higher, up 0.95% to 5,180. Bank stocks helped lift the index, with the largest owner occupied mortgage lender, Commonwealth Bank up 0.71% to $75.36, Westpac, the largest investor mortgage lender up 1.10% to 29.47, National Australian Bank up 0.96% to 28.40 and ANZ Banking Group up 1.62% to 29.48.
But AMP took a bath, following the release of their “recovery plan”. AMP has a massive hole to dig itself out of, given the evidence revealed during the Royal Commission. They charged fees for no services (which by the way other organisations also did), but then appeared to deflect and mislead the regulators pointing to a concerning set of cultural and behavioural issues across the organisation, and to the highest levels in the company. They have destroyed significant shareholder value, and worse have milked some of their customers for years. The reputational damage is excruciating. They announced a series of measures designed to give the investment market some comfort that action is in hand, although the specifics remain vague, and it is unlikely to placate the potential class action horses circling the AMP wagons. It is hard to judge whether these measures will ever fully compensate customers of AMP for their blatant acts of deceit, and whether shareholders will view the announcements as necessary and sufficient to get to the root causes of the systemic poor practice. The 4% fall in the share price following the announcement suggests probably not and in fact the total potential liabilities facing the company are also probably unknowable at this time. So, my reaction was too little too late. The repair job has only just started and will take years to complete, if indeed this is possible at all. Other investors seem to agree, with the price falling 5.17% to $3.30, a price not seen since the early 2000’s. Takeover target anyone?
In the US markets, Facebook sent a huge tremor through tech stocks this week with a worrying warning about revenue that sent the stock spiralling to a record-setting market-cap loss. Shares of Facebook sank nearly 19% on Thursday, slashing the company’s value by about $120 billion. That was the largest single-day loss in market cap in Wall Street history. Revenue missed expectations, but it was the conference call that really spooked investors. “Looking beyond 2018, we anticipate the total expense growth will exceed revenue growth in 2019,” CFO Dave Wehner said on the conference call. “Over the next several years, we would anticipate that our operating margins will trend toward the mid-30s on a percentage basis.” Facebook also predicted its total revenue growth rate would continue to decelerate in the third and fourth quarters. But it’s worth putting this in context of its long term price growth, from around $50 a share in 2014, to $175 a share now, after the drop.
Just a day after Facebook’s drop, Twitter caused its own shockwaves in the social media space. The stock tumbled more than 20% on Friday after the company reported a surprise drop in average monthly users. Average monthly users dropped to 335 million from 336 million in the first quarter, due to deletion of fake accounts and bots, or, as the company put it, “prioritizing the health of the platform.” Shares of Twitter had wavered earlier in the week after President Donald Trump accused the company of shadow banning Republicans (effectively making the user impossible to find). The company responded that it does not shadow ban in any cases. The longer term trend is starkly different from Facebook, back in 2014 it was priced at well over $50, today, after its 20% fall it was sitting at $34.
The broader markets were down on Friday, despite the GDP numbers, with the S&P 500 falling 0.66% to 2,818, the Dow Jones Industrial average down 0.3% to 25,451 and the NASDAQ, where many of the tech stocks hang out down 1.46% to 7,737. The Volatility Index was higher, up 7.33% to 13.03, suggesting more risks than last year, but still well the panic peak in the earlier part of the year.
Crude oil prices ended the week slightly lower after a selloff Friday ending at 69.02, down 0.85%. But supply concerns remained front of mind for traders. Data released this past week showed that US crude oil inventories fell to their lowest level since 2015 as exports jumped and imports fell sharply. Also, Saudi Arabia temporarily paused shipments through the Bab el-Mandeb strait, which joins the Red Sea to the Gulf of Aden, after two of its oil tankers were reportedly attacked by Houthi rebels. The disruptions in the Middle East come as market participants continue to bet on further disruptions in oil flows underpinning oil prices. “The potential for further disruptions remains high in Libya, Venezuela and Nigeria with last week seeing new disruptions in Norway and Iraq, and Saudi has little incentive to let inventories rise,” Goldman Sachs said in a note to clients Thursday.
Gold fell to 1,222, down 0.29% suggesting that investors are still preferring the US dollar and Copper was down 0.78% on Friday to 2.796. Bitcoin rose to 8,160 up 2.51%. This week we discussed the potential for Bitcoin and compared it with other forms of money. The bottom line is; it may have a place. See our post “Some Myths Around Bitcoin”.
And so finally, back to the property market. CoreLogic reported that last Saturday the combined capital cities returned a final auction clearance rate of 57 per cent last week, improving on the 52 per cent over the week prior across a similar volume of auctions. There were 1,257 homes taken to auction last week, increasing slightly on the 1,178 held the previous week. While one year ago, a higher 1,748 auctions were held with a 69.9 per cent success rate. And the number listed for auction, but not taken to auction rose again.
Melbourne returned a final auction clearance rate of 59.9 per cent across 613 auctions last week, increasing on the 56.2 per cent over the week prior when fewer auctions were held (559). Sydney’s final auction clearance rate came in at 55.2 per cent last week, rising on the week prior when the city returned the lowest reading since Dec-2012 with only 46.9 per cent of auctions successful. Auction volumes were virtually unchanged over the week with a total of 407 held. As usual the performance across the smaller auction markets was mixed last week, with clearance rates improving in Adelaide and Brisbane, while Canberra, Perth and Tasmania saw clearances rates fall week-on-week.
The Gold Coast region was the busiest non-capital city region last week with 49 homes taken to auction, although only 33.3 per cent sold. Geelong was the best performing in terms of clearance rate with 61.5 per cent of the 32 auctions successful.
This week, the final week of July will see a total of 1,430 homes taken to auction; a slight increase on the 1,257 auctions held last week as at final figures, although lower than the 1,987 auctions held on the same week last year. They say that while it is not unusual to see auction activity cool off throughout the winter period, this year has seen weekly volumes trend lower when compared to the equivalent June- July period last year. With clearance rates at their lowest levels since 2012 there is some clear reluctance in the auction market as capital city dwelling values soften. Melbourne is set to be the busiest auction market this week, with 746 homes scheduled for auction, while in Sydney, 443 homes are scheduled for auction this week. Across the smaller auction markets, Brisbane and Perth will see a higher volume of homes taken to auction this week, while Canberra and Tasmania have fewer scheduled auctions and activity across Adelaide will remain steady.
Prices are still weaker in most markets, and this trend is likely to continue. And the averages mask significant differences across individual locations. For example, at the Sydney SA4 level, units in the Baulkam Hills and Hawkesbury areas have fallen 19% from their peaks, while houses in the City and Inner South have fallen 13.6%, and 10.5% in the Inner West. Prices fell by 10.6% in Ryde, 8.7% in North Sydney and Hornsby and 6.8% in Blacktown. Once again this underlines the importance of getting granular when it comes to the property market.
And remember that the household debt to GDP ratio in Australia is very high, on an international basis, at 121.7%, just behind Switzerland. Canada in at 100%, the UK at 86.7% and the USA 78.7%. We are full of debt. And our baseline modelling and household surveys signal more weakness in the months ahead, and those spruiking a soft landing and an imminent recovery seems to be missing the obviously tighter credit tightening, selective discounting for some lower LVR refinances, and the impending issue of Interest Only refinancing. Combined these forces will remain potent.
Welcome to the Property Imperative weekly to 21th July 2018, our digest of the latest finance and property news with a distinctively Australian flavour.
By the way if you value the content we produce please do consider joining our Patreon programme, where you can support our ability to continue to make great content. Here is the link.
Watch the video, listen to the podcast, or read the transcript.
It’s important to look past the headlines and examine the data, because we need to see the truth beneath.
Let’s start with the housing market this week. Auction clearance rates and volumes continue to fall and Sydney recorded the lowest clearance rate the city has seen since December 2012. CoreLogic says that last week saw 1,178 homes taken to auction across the capital cities, returning a clearance rate of 52.0 per cent. Compare this with 52.6 per cent across 1,411 auctions last week and 69.4 per cent on 1,627 homes this time last year.
Melbourne’s final clearance rate came in at 56.2 per cent across 559 auctions last week, similar to the previous week when 631 auctions were held and a clearance rate of 56.1 per cent was recorded. This time last year auction volumes were higher across the city with 756 homes going under the hammer returning a clearance rate of 74.9 per cent.
Sydney’s final clearance rate dropped to 46.9 per cent last week across 408 auctions, the lowest clearance rate the city has seen since December 2012. In comparison, 552 auctions were held across Sydney over the previous week returning a clearance rate of 50.1 per cent while this time last year, 609 homes went under the hammer, returning a clearance rate of 69.2 per cent.
Across the smaller auction markets, clearance rates improved everywhere except Brisbane. In terms of volumes, Adelaide was the only city to see an increase with an additional 8 homes taken to auction over the week. Of the non-capital city markets, the Hunter region recorded a 70.6 per cent final auction clearance rate across 17 results, followed closely by Geelong where 70.4 per cent of the 27 auction results were successful.
CoreLogic says auction activity is expected to remain relatively subdued this week with 1,155 homes scheduled for auction across the combined capital cities, similar to last week. And they also reported that home prices slid further across all the centres other than Brisbane, down another 0.11% in the past week. So absolutely no indication of any improvement. Today I had the chance to visit five auctions in our area, none sold, and no-one serious made any bids at three of the events.
But this should come as no surprise, as credit is still less available than a few months ago. Indeed, around forty percent of households seeking to refinance their mortgages have been knocked back compared with just 5% a year ago. We discussed these findings as part our analysis of Household Financial Confidence, which overall was lower again – see our post “Household Financial Confidence On The Blink Again” . The June 2018 edition of the index, which draws information from our rolling household surveys, registered just 89.7, well below the 100 neutral setting and down from 90.2 last month. Debt remains a major issue, with mortgages being the front line. Households remain highly leveraged. Some households with lower Loan to Value ratios have been able to switch to other, cheaper loans. We also continue to see many households adding to their overall debt via credit cards, or other loans. The new positive credit environment which commenced 1 July 2018 will change the game ahead and credit may become harder to source for some. On the other hand, households continue to dip into their savings to maintain lifestyle and budgets. Significantly more than one third of households with an owner occupied mortgage had savings LESS than the equivalent of one month’s mortgage repayment. The other two thirds had significantly larger resources which would insulate them in a down turn, at least for a time.
CoreLogic has looked at the changes in property values by area from their peaks, with Perth showing a 28% fall alongside Darwin, Brisbane down 12.5%, Adelaide down 7.4%, Canberra down 6.8%, Sydney down 5.3% and Melbourne down 0.9%. And over the past decade, house values fell on average 27% across Mackay, in Queensland, and more than 34% across the WA outback. These are big falls, and puts the movements in Sydney and Melbourne into perspective – or perhaps provides a better view of where we are headed.
S&P Global Ratings did a job on the banks this week, saying they recently negatively revised their view of the Australian banking sector’s industry risk. Developments over the past two years in the Australian banking sector, including information coming out of hearings at the ongoing Royal Commission, highlight some weaknesses in the effectiveness of regulation in the banking sector, and the conduct, governance, and risk appetite shown by Australian banks. This is a big deal, as we discussed in our post “And Now For The Bad News, At Least For The Banks”.
In addition, The latest S&P Ratings SPIN index to May 2018, based on their portfolio of mortgage backed securities showed a further move up in defaults compared with last month, from 1.36% to 1.38%. There were rises in New South Wales of 0.02%, Queensland of 0.04% and Northern Territory up 0.52%. Significantly, the larger hikes were seen in the major bank portfolios, with the prime spin rising from 1.36% last month to 1.38% in May. There was a rise in 61-90 day past due loans, from 0.22% last time to 0.25%. While these moves are small, arrears are now as high as they were back in 2011, and interest rates are much lower today, so this highlights the risks in the system. This does not appear to be a seasonal issue either; it is more structural.
In addition, personal insolvencies were higher again, according to the Australian Financial Security Authority who released their statistics for 2017–18 and the June quarter 2018. The data reveals a sharp rise in total personal insolvencies to the highest level since the Global Financial Crisis a decade ago, with record high insolvencies reached in WA and NT, and debt agreements also hitting an all-time high. The pressure on households continues to bite.
Even the RBA minutes, out this week discussed the problem. And the latest SQM Research data on rentals also showed that Sydney vacancy rates are the highest in 13 years, at 2.8%, potentially putting more pressure on property investors in city.
We also ran some alternative mortgage scenarios this week, showing that even if incomes started to move up, to nearer 3% that’s 1% higher than now, the number of households struggling with their finances would remain well above the long term trends. We remain, as a nation, highly exposed to debt, especially if interest rates rise. You can watch our video on this analysis “Alternative Mortgage Stress Scenarios”.
Even CBA’s Gareth Aird, their Senior Economist, in a fairly bullish piece, admitted that for many households, the number one headwind that they face with respect to consumption is debt repayment. Australia has one of the most indebted household sectors globally. Debt to income ratios have risen from around 148% in mid-2012 to a record high of 190% in Q 2018. This measure includes all households regardless of whether they actually have a mortgage. For households that have a mortgage, that figure is significantly higher. It has increased steadily as interest rates have come down despite lower rates making it easier to repay debt. Basically growth in the net flow of credit (i.e. new credit less repayments) has been higher than growth in income. He says a high debt burden relative to income acts as a constraint on future household consumption growth. It means that interest payments as a share of income are higher than otherwise. And of course the principal must be paid too. This leaves households with less income that can be spent on goods and services. And it means that households have a much greater sensitivity to interest rate changes. From a demographic perspective, it is younger households feeling the debt burden most acutely. There are also about $120bn of interest only loans in aggregate that are scheduled to roll over to principle and interest (P&I) loans annually over the next three years. Borrowers shifting to P&I loans will face higher monthly loan repayments. Could not have put it better myself.
The plight of households in the current environment even reached New York in an excellent piece in the New Your Times. “Australian Housing Costs Rival New York’s, but Boom May Be Ending“. I was quoted extensively: “We are on the edge of a precipice,” said Martin North, principal analyst for Digital Finance Analytics, an independent research and advisory firm. “All of the forces that have driven the home sector and the debt sector higher in the last 20 years are all coming to a critical inflection point.” “Almost everywhere you look, you can see icebergs,” Mr. North said. Signs of stress are showing. Mr. North, the analyst from Digital Financial Analytics, estimates that of 3.5 million mortgages where the owner lives in the home, almost a third of the households have incomes close to or less than their expenditures. He predicts that at least 50,000 homeowners may default in the next 12 months.
If you want to get deep and dirty into our analysis, and the potential consequences for Australian Households, and mitigation strategies, then you might want to watch the recording of our Live Stream from last Tuesday. It’s just over the hour in length, and we have some excellent interactions in the chat room. In fact there are two versions available, the live edition, including real-time chat, and the odd technical glitch (helps to turn the sound on), or the slightly shorter version, at higher quality and tidied up, but without the chat. You can choose. We plan more live events down the track. The links are below.
The apparent bright spot this week was the latest employment data which was above market expectations. The number of people employed rose 50,900 from May to June in seasonally adjusted terms, which was well ahead of forecasts of around 16,500. And that wasn’t just a lot of new part-time jobs. Full-time employment rose by 41,200. On a year-on-year basis that represents an increase in employment of 2.8%. But even then, the number of people unemployed fell from 715,200 in May to 714,100 in June. This is explained by the participation rate – the proportion of people participating or trying to participate in the paid labour market. The participation rate rose from 65.5% in May to 65.7% in June, leaving the unemployment rate unchanged at 5.4%. The Australian labour force participation rate is actually pretty high. A useful comparison is the United States – probably the world’s most robust labour market – where the current rate is 62.9%. The key point is that if more people are going to come into the labour market when it looks better – as they have been consistently – then a continued reduction in the unemployment rate is going to require creating a whole lot more jobs. And in any case the basis for counting employed people is suspect. We discussed this in our post “And Now for The Good News”. Little sign of wages growth at the moment.
The local stock markets had a pretty good week, again, with the ASX All Ords up 0.35% on Friday to 6,377. The S&P ASX 100 was up 0.38% to 5,168, encouraged by the employment data, and the economic news from China. Westpac, the largest investment mortgage lender was up 0.67% to 29.90, but well below its 12 month highs, and CBA rose 0.68% to 75.90, but again well below prices from a year ago. The overhang from the Royal Commission, tighter funding, and higher risks explain why they are priced down.
Looking across to the US markets, the earnings season was in full flight for the week and the majority hit or beat Wall Street expectations. The Down Jones Industrial was down 0.3% to 25,058 on Friday and the S&P 500 fell a little to 2,801. The Volatility Index, the VIX was also a little lower, but remains above its level last year. The financial sector continued to perform well. Morgan Stanley led the broker-dealer reports and Goldman Sachs also topped estimates, although concerns about its succession plan hit the stock later in the day. But even so, these stocks are off their 12 month highs, and Macquarie Bank, in comparison, has been performing more strongly in our local market up 0.84% on Friday to 125.40.
On the tech-heavy NASDAQ, which fell just a little on Friday, down 0.07% to 7,820, it was a tale of two techs as a momentum stock fell short of what investors wanted and an old stalwart came through. Netflix tumbled at the start of the week after the company missed expectations on new subscribers, a key metric for the streaming company. Netflix added 5.14 million subscribers in the latest quarter, shy of analysts’ expectations for more than 6.2 million. But after the bell on Thursday, Microsoft reported second-quarter earnings that beat consensus thanks to cloud services revenue.
The prospect for the path of U.S. interest rates took an interesting turn at the end of the week. At first things seemed to jibe with market expectations that the Federal Reserve will raise rates once and possibly twice before the year is out. At his Humphey-Hawkins testimony before the Senate Banking Committee and the House Financial Services Committee, Federal Reserve Chairman Jerome Powell reiterated the central bank should gradually increase interest rates.
But President Donald Trump shook some of the market’s confidence, saying on Thursday he’s “not thrilled” about the Fed hiking rates and going into more specifics on Twitter on Friday.
The tweets had little overall impact on the market forecasts for upcoming rate hikes. But they did take the legs from the dollar on Friday. The U.S. Treasury Department has long had a policy of simply stating that a strong dollar is in America’s best interest.
The yield curve continues to converge across the long and short term, and this has often been seen as an early warning of trouble ahead. This from Bloomberg.
The 30-year bond is sitting at 3.03% and the 3 Month at 1.98%. The 3 Month LIBOR rates remained above 2.3% and the 10 year benchmark is at 2.9%, just a little off its highs, and this also reflected in a lower BBSW rate in Australia, suggesting a small fall in margin pressure for the banks locally compared with a few weeks ago.
Trade-war concerns took a back seat through most of the week, but were revived on Friday and could weigh more heavily next week, despite another full earnings calendar. President Trump said in an interview on CNBC that he is ready to impose tariffs on $500 billion worth of Chinese goods to the U.S. if China does not back down on its trade policies. “I’m not doing this for politics, I’m doing this to do the right thing for our country” he said on CNBC’s “Squawk Box.” “We have been ripped off by China for a long time.”
In fact, Moody’s highlighted that already the trade-wars is hitting base metal prices, yet is hardly mentioned. Since worries surrounding a trade war came to the fore, the base metals price index has sunk by 13.0%. The copper futures are well down from their highs a couple of months back, as is steel. This could crimp Australian GDP in the months ahead. And both Gold and Silver were weaker, suggesting that at the moment “risk” investors are preferring the US Dollar.
It’s also worth noting the Chinese Yuan slide against the US dollar and the Australian Dollar and some are suggesting that this is a sign of the Chinese Government answering the Trade wars by taking their currency lower (so reducing the cost of their goods in the local economies). The Aussie Dollar continues to drift lower against the US Dollar, and we expect this to continue, indeed one economist suggested it could end up around 60c in the months ahead.
Crude oil prices posted a second-straight weekly decline and may continue to weigh on energy stocks, as they have of late. On the New York Mercantile Exchange crude futures for September delivery rose $1.30 to settle at $70.46 a barrel Friday. Investors continue to weigh up the prospect of a global shortage in supplies, despite Saudi Arabia’s pledge to hold off flooding the market with more output. That said, crude oil prices were supported on Friday by the plunge in the dollar following Trump’s remark about the greenback and other currencies.
Bitcoin lifted a little, and continues in a less volatile mode, though well below earlier highs.
Finally, for today, another lens on the debt bomb, as featured in my recent discussions with Economist John Adams, including those on the debt bomb itself, the international debt bubble and more recently the meaning of money. We have more planned, so watch out for those, and there is also dedicated web page on the DFA blog. Again the link is below.
The McKinsey Global Institute says that since the GFCs, many large corporations around the world have shifted toward bond financing as commercial bank lending has been subdued. Today, 19 percent of total global corporate debt is in the form of bonds, nearly double the share in 2007. Annual nonfinancial corporate bond issuance has increased 2.5 times, from $800 billion in 2007 to $2 trillion in 2017. The global value of corporate bonds outstanding has increased 2.7 times since 2007 to $11.7 trillion, doubling as a share of GDP.
The average quality of blue-chip borrowers has declined. In the United States, almost 40 percent of nonfinancial corporate bonds are now rated BBB, just one notch above speculative-grade “junk bonds.” Growth in speculative-grade bonds has been particularly strong. Globally, the value of corporate high-yield bonds outstanding increased from $500 billion in 2007 to $1.9 trillion in 2017. In the coming five years, and unprecedented amount of these bonds will come due. Bond issuance by companies in China and other developing countries has soared. The value of China’s nonfinancial corporate bonds outstanding rose from $69 billion in 2007 to $2 trillion at the end of 2017, making China one of the largest bond markets in the world. Outside China, growth has been strongest in Brazil, Chile, Mexico, and Russia.
From 2018 to 2022, a record amount of bonds—between $1.6 trillion and $2.1 trillion annually—will mature. Globally, a total of $7.9 trillion of bonds will come due during those five years, based on bonds already issued. However, some bonds have maturities of less than five years and may still be issued and come due during that period. If current issuance trends continue, then as much as $10 trillion of bonds will come due over the next five years. At least $3 trillion of this total will be from US corporations, $1.7 trillion from Chinese companies, and $1.7 trillion from Western European companies.
Now overlay the rising interest rate environment, and you can see the problem. Such high leverage will cost the global economy dear, and sooner rather than later.
We get a fair smattering of media coverage relating to our research, as listed in our media section. But, I wanted to draw your attention to an article in the New York Times “Australian Housing Costs Rival New York’s, but Boom May Be Ending“.
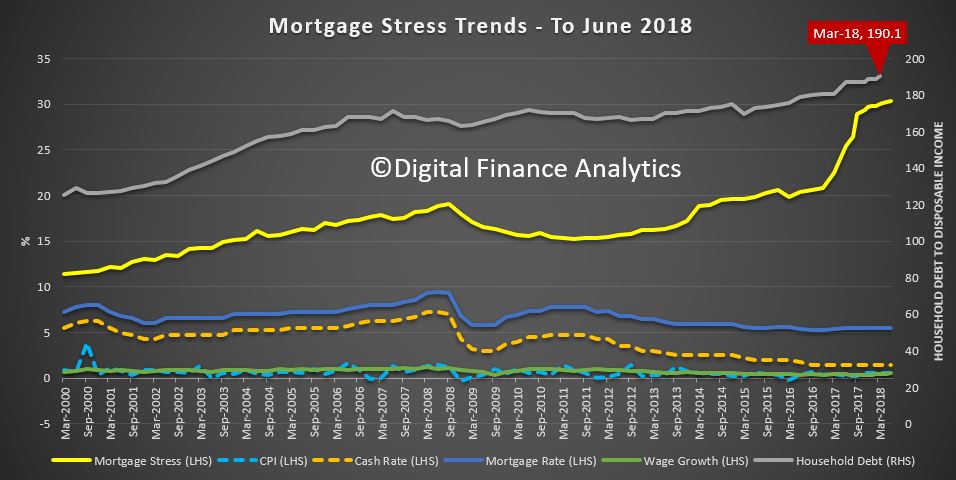
“We are on the edge of a precipice,” said Martin North, principal analyst for Digital Finance Analytics, an independent research and advisory firm. “All of the forces that have driven the home sector and the debt sector higher in the last 20 years are all coming to a critical inflection point.”
“Almost everywhere you look, you can see icebergs,” Mr. North said.
Still, signs of stress are showing. Mr. North, the analyst from Digital Financial Analytics, estimates that of 3.5 million mortgages where the owner lives in the home, almost a third of the households have incomes close to or less than their expenditures. He predicts that at least 50,000 homeowners may default in the next 12 months.
