Australia’s anti-dumping system has become tool for protecting industries which aren’t competitive. Over time federal government has cranked up penalty charges on imports, such as steel, deemed unfairly under-priced, to protect these businesses. It’s Australian consumers who bear the cost.
In its latest Trade and Assistance Review, the Productivity Commission found a pronounced spike in anti-dumping duties. The average duty on imports considered “dumped” (sold below market prices) was 5% each year between 2006 and 2011. Between 2012 and 2015 it rose 15%.
This is running against the global trend. The World Trade Organisation (WTO) reported last year that among G20 economies, increases in anti-dumping duties was abating.
The rules of the WTO allow members to impose duties on imports if they are found to be sold at prices less than the cost of the product and in quantities that distort the import market.
Typically, such imports in Australia include steel, power transformers, heavy machinery, food products, plastics, paper and other metals. How these duties are imposed is determined by the Anti-Dumping Commissioner.
Free market economists query the concept of dumping. If a product is put on the market by a business at a price below cost, is that not a standard commercial practice to offload excessive inventories or to flood the market with goods in order to build a market presence?
The WTO rules are loose enough to provide plenty of room for interpretation of what can be classified as dumping. One problem with this is that blocking imports assessed as under-priced and harming local producers is common during recessions.
The WTO began analysing the incidence of imposition of new trade restrictions including anti-dumping measures after the Global Financial Crisis. It found they multiplied three or four times.
When governments cut tariffs, as the Hawke Government did in the late 1980s, political pressure to impose new restrictions on cheaper imports was expected. So it set up an independent regulator (the Anti-Dumping Authority) to rule if imports were unfairly-priced and undermined Australian policy to open markets. Strict criteria were set.
But as tariffs started to reduce, Australian farmers and manufacturers pressed the Howard Government to loosen them and the Authority was abolished.
Responsibility for assessing complaints was shifted from an independent regulator to a Minister or senior official accountable to a Minister. This opened a channel for political pressure.
And over time, the interpretation of what was a “dumped” product was progressively expanded. The amount of time defendants had to respond to claims of dumping was also progressively reduced diminishing their opportunity for equal hearing.
The Gillard Government went further, creating an Anti-Dumping Commissioner. It is now official government policy endorsed by the Coalition government that the Commission is to “level the playing field”. Incredibly, this is now official terminology.
The Productivity Commission assessed that rulings by the Commissioner distinctly favoured domestic producers.
Australia’s anti-dumping system has become a protectionist tool. The Commission reports the average duty imposed over the last six years was 17%, the median 11%. Where Australia still imposes tariffs, the average is 5%.
Former Prime Minister Tony Abbott helps a worker at Independent Steel Company in Queanbeyan, Thursday, May 31, 2012.Lukas Coch/AAP
Liberal National Party Governments have been as receptive to this as Labor Governments. As Prime Minister, Tony Abbott wanted the system toughened and advocated reversal the onus of proof when importers were accused of dumping. Legal common sense prevailed and this was dropped.
Instead, the then relevant Minister, Christopher Pyne, announced a tightening of procedures to assess dumping. According to the former Assistant Minister for Science, Karen Andrews, the Commission would also monitor trends which pointed to dumping. This came at the time of the serious financial problems facing the steel works in Wollongong and Whyalla.
The Government has negotiated important Free Trade Agreements with Australia’s Asian neighbours. If the commitments in those agreements to reduce tariffs are obviated by subsequent decisions by the Anti-Dumping Commission to impose new higher duties on imports, this would undermine Australia’s credibility as a promoter of growth through open markets.
Australia should not forget steel from China, a target of anti-dumpers, is made from Australian iron ore and Australian coal which are much larger industries and earners for Australia than its steel industry. The coal and iron ore industry workforce combined is 98,000 and the workforce at Bluescope and Arrium is 10000.
Cutting tariffs in the nineties gave Australia the highest consistent growth rate of any OECD country for over 25 years. As global growth slows, what is the sense of reintroducing protection in Australia?
Author: Alan Oxley, Chair, APEC Study Centre, expertise international trade law, economics, Asian regional development, RMIT University
Australia’s banks have always enjoyed a lucrative income from credit card “interchange fees”, the charges that the banks levy on merchants’ sales. These fees amount to AU $2.5 billion a year which are ultimately passed on to consumers.
Unwilling to share any of this revenue with Apple, all but ANZ and American Express have refused to adopt Apple Pay. Instead, four of the largest banks, NAB, Westpac, Commonwealth and Bendigo and Adelaide have asked Australia’s competition regulator, the ACCC, for permission to act collectively to negotiate with Apple over access for their own digital wallet products on its phones, tablets and watches.
The banks, along with their industry representatives are claiming that they are taking this action in the interest of providing “Australians with real choice and better outcomes”. They are also allegedly concerned about security and standards surrounding the way in which customers add their cards to Apple Pay.
Even if granted, the likelihood of Apple negotiating access to the underlying payment mechanisms in the phone to the Australian banks is zero. Ceding on this would not only require Apple to create the mechanisms by which third parties could integrate with the hardware and software in their devices but it would essentially be giving up on the substantial global revenue derived from Apple Pay that is only set to grow.
Giving in to Australian banks, which in total represent a small fraction of their overall Apple Pay earnings, would mean opening up access to Apple Pay to every bank globally. Something that Apple would never do. Apple would be more likely to forego Australia altogether before taking that radical a step.
If anyone had an anti-competitive complaint to make, it would be Google and Samsung whose Apple Pay alternatives, Android Pay and Samsung Pay are also not compatible with the iPhone platform. The fact that they haven’t complained about this as such is because it wouldn’t be worth their while competing with Apple Pay which is integrated into the underlying operating system.
The banks would like to claim that their own technology somehow would be better than using Apple Pay. The banks’ tap and pay apps however require opening them up and entering a PIN, logging in or using a fingerprint login, rather than simply holding the phone against the tap and pay terminal with your thumb on the home button. The banks’ apps have also been historically beset with issues and delays in supporting new versions of Android in particular.
Perhaps Apple should not feel particularly victimised however. The Commonwealth Bank, Westpac and NAB have rejected any support for Android Pay or Samsung Pay as well.
ANZ is the only Australian bank to have taken on Apple Pay after originally being part of the other banks’ initiative to collectively bargain with Apple. The move by ANZ CEO Shayne Elliott to be the bank to adopt the latest mobile digital technology is a smart one because it has clearly differentiated ANZ as a technological leader in this space. Elliott claims that the support of Apple Pay has attracted new customers to the bank.
ANZ’s and American Express’s support for Apple Pay and Android Pay has actually given customers what they want. What they want is to be able to use what large numbers of other people in other countries can use. Being part of the “Apple” or “Samsung” or “Android” group forms part of a user’s self and social identities and fulfils a psychological need of relatedness. Being excluded from this group by banks whose predominant consideration is profits will only cause dissatisfaction and resentment amongst their customers.
ANZ’s acceptance of Apple Pay will presumably also weaken the case of the other banks that they are being disadvantaged by Apple’s closed payment system. The brinkmanship of the banks will come to a head next year when the NSW transport system starts trialling the use of tap-and-pay cards to pay for travel. If the experience in London is anything to go by, this will drive even greater use of mobile tap-and-pay which for iPhone or Apple Watch users benefits only ANZ, American Express and Apple.
Author:David Glance, Director of UWA Centre for Software Practice, University of Western Australia
A six year legal battle came to an end yesterday when the High Court ruled in favour of ANZ Bank, finding by a 4-1 majority that the bank could enforce late payment fees on credit cards.
The lead plaintiff in the class action was Mr Paciocco, who opened two MasterCard accounts with the bank. One card had a credit limit of A$18,000 the other had a A$4,000 limit.
Mr Paciocco was late in meeting his monthly repayments on a number of occasions, and was required to pay late payment fees. The fee was initially $35, with the bank later reducing it to $20. Mr Paciocco was not the only ANZ customer who was late in repaying their credit card debts. During the financial year ended September 2009 the bank had around two million consumer credit card accounts. It charged late payment fees on around 2.4 million occasions, for which it received $75 million.
Mr Paciocco claimed the bank could not enforce the late payment fees because they were “penalties”. Australia’s common law will not allow a party to a contract to enforce a penalty amount under a contract. The question the High Court grappled with was what precisely did the common law understand a penalty to be. Rather annoyingly the Court has returned to the bad habit of each of the five judges hearing the case writing a separate decision. Each judge’s decision covers much of the same ground as the others, with subtle differences here and there. This makes it rather difficult to discern any coherent majority view on any particular issue.
In any event, the Court appeared to agree that a “fee” amounts to being a penalty if it is in the nature of a punishment for non-observance of the credit card contract. That is, it is a penalty if the fee is out of all proportion to the costs or loss caused to the bank by the customer’s late repayment. One view was that a fee becomes a penalty if it is extravagant, exorbitant or unconscionable. That definition sets a very high hurdle for bank customers to surmount when trying to prove a fee is a penalty.
Having decided what a penalty is, the judges were required to determine whether the fee/penalty charged was out of all proportion to the resulting losses caused to the bank. ANZ admitted the late payment fees were not a genuine pre-estimate of the losses it suffered as a result of the late repayment. The Court, however, found the mere fact there was no pre-estimate of the losses to the bank did not automatically mean it was a penalty.
Experts differ
Two expert witnesses gave evidence before the lower courts about the costs to the bank of a customer making a late repayment. One witness estimated the average cost to be $2.60. The other expert took into account a range of factors including the “loss provision costs, regulatory capital costs and collection costs” to the bank, and arrived at a much higher figure.
The Court then debated which of the experts had adopted the correct methodology. The majority found in favour of the second witness, the minority judge found the correct figure was closer to that calculated by the first witness, and therefore found the late repayment fee to be a penalty.
The majority also considered whether the bank had acted unconscionably or unjustly under the provisions of relevant legislation, and concluded that the bank had not breached the legislation.
The case confirms that a person alleging a requirement under a contract to make a certain payment amounts to a penalty must jump a very high bar. He or she must establish that the amount being imposed is extravagant, exorbitant or unconscionable.
The case also illustrates the difficulty in calculating the costs to the bank of customers making late repayments. The onus is on the customer to show the bank is acting extravagantly. It is somewhat disappointing for the many bank customers who are subjected to late payment fees that the Court favoured a costing methodology that itself was arguably extravagant and exorbitant.
Author: Justin Malbon, Professor of Law, Monash University
Late last year a Productivity Commission report found including the family home in the means test for the age pension could deliver the government A$6 billion in much-needed revenue.
Despite this, in the lead-up to the federal election, both major parties shied away from reform. Neither was willing to consider rolling back preferential treatment of the family home. This includes capital gains tax exemptions, first home owner grants and the family home’s exemption from the pension means test.
Home ownership is an important source of emotional security, which offers a strong rationale for exempting the family home from the pension means test. But as the population ages and the government’s fiscal problems grow, there’s increasing policy interest in tapping into older people’s accumulated housing wealth to support retirement.
The case for means-testing the family home
Exempting owner-occupied housing from capital gains tax can have adverse equity and efficiency impacts. The family home exemption results in the payment of income support to those with substantial wealth tied up in their principal residence. Public funds are not therefore targeted at those in most need.
The exemption of housing assets in means tests advantages pensioners with most of their wealth stored in the family home relative to those with the same wealth holdings, but spread across a more diversified portfolio. Policymakers describe this as being “horizontally inequitable” – where people of similar origin and intelligence do not have equal access to wealth.
The current system also causes inefficiencies in housing markets. It encourages “empty nester” older households to live in houses that are large relative to their household size. For income-poor older Australians, this can have perverse consequences. Equity released from downsizing could generate income to help meet acute spending needs in old age.
At the same time, wealth portfolios dominated by housing leave owners over-exposed to house price risks that they cannot hedge. Means-testing the family home would cause future homebuyers to scale back their housing investments. As a result, they would be more likely to hold more balanced wealth portfolios.
The case against means-testing the family home
The problem is, older Australians choosing to downsize or access some sort of equity-release product face tax penalties under the current system.
The net proceeds on downsizing are an assessible asset that can reduce income-support payments, while stamp duty eats into the proceeds. And a lack of suitable housing options frustrates many would-be down-sizers who want to stay living in their local communities. Equity-release products also expose owners to investment and credit risks because interest rates are variable and house prices can fall.
Encouraging people to tap the value in their home instead of accessing welfare payments requires stable housing asset values and continuing high rates of home ownership. However, there is already clear evidence of declining rates of home ownership and increasing indebtedness. These trends are not restricted to young Australians; they are also evident among those approaching retirement.
And if in future we witness the sharp declines in house prices that many countries suffered during the global financial crisis, housing equity will prove to be an unreliable asset base for welfare needs.
Is there a pathway to reform?
The challenges facing older Australians who downsize or access home-equity products can be mitigated by the introduction of financial instruments or government-backed schemes that allow owners to hedge house price risks. Stamp-duty exemptions could reduce the financial costs of downsizing.
It also needs to be recognised that current pensioners made their home purchase and investment decisions on the basis of tax-transfer rules that were expected to remain in place. In light of this, grandfathering provisions would need to be part of any reform package. This would enable transitional arrangements, preventing major disruption in housing markets and the lives of current pensioners.
It is important to note if budget savings are the main motivation, the government should look at reforming housing tax concessions. These concessions are largely received by higher-income older home owners. Curbing these concessions would be a more equitable way of achieving budget savings while also improving the resilience and efficiency of housing markets.
Authors: Rachel On,Deputy Director, Bankwest Curtin Economics Centre, Curtin University; Gavin Wood. Professor of Housing, RMIT University.
The government is still consulting on superannuation after concerns raised by backbenchers over changes made in the budget. However these changes are more important than ever, as evidenced by the 2016 HILDA statistics on wealth and superannuation.
The statistics highlighted changes in the distribution of wealth of Australians since the survey commenced in 2001. The most significant assets held by most Australians continue to be their family residence and superannuation, but policy changes over the time of decade the survey have changed the balance of those investments.
More concerning is the finding that wealth inequality has increased. The data adds strength to the argument that superannuation reforms are overdue, with a small number of wealthy people able to accumulate wealth in superannuation and investment property.
In Chapter 5 of the report, which discusses household wealth, the authors note that superannuation will soon overtake the family home as the major asset owned by Australians. This is the result of two separate trends: increases in superannuation balances and lower net wealth in housing.
Looking at the HILDA data, it’s not unexpected to see that younger age cohorts have experienced the strongest growth in superannuation assets.
Prior to 1993 superannuation was very different to the current system. According to Treasury data in 1986 53.5% of Australian full time employees did not have superannuation coverage, and over 80% of those who did, were members of a defined benefit scheme, which would not generally be reported as an asset. By 2000, 96.9% of full time employees had superannuation coverage, with 86% of those employees in accumulation type funds.
The superannuation guarantee has been a significant contributing factor in the importance of superannuation as a household asset. Notably, the phasing in of the rate of the superannuation guarantee shows in account balances. As can be seen from the HILDA report the increased rate of superannuation guarantee after 2002 has resulted in higher superannuation balances for people at the same age in successive surveys.
The increase in housing values is the second trend which has altered the mix of assets. Over this time residential house prices rose significantly, with ABS data showing an increase in the Residential Property Price Index across eight capital cities from 69.0 in September 2003 to 120.2 in Dec 2014.
Given that in the 2002 data the major asset of Australians was the family home, homeowners benefited disproportionately from the increased value of housing. Even with the significant increases in superannuation, for older Australians the proportion of wealth held in housing has been maintained as their total wealth has increased.
The HILDA data shows that most age cohorts, including all except the oldest retirees, have seen increases in their superannuation accounts over time. Policy changes effective from 2007 have supported superannuants through tax exemptions and high contribution levels.
Another trend contibuting to this is that people are retiring later. The change in the pension age to 67 has been accompanied by a trend for people to work longer. Not only are they deferring withdrawals from their superannuation fund, but they are also continuing to contribute during this time.
As noted in the Productivity Commission report last year there is some evidence of withdrawals at the time of retirement, but these are generally used to pay outstanding debts, including mortgages against the family home.
Others convert their superannuation at retirement into other financial investments. This cements the family home as the most significant asset held by retirees.
The more concerning finding for policy makers is that wealth inequality has increased, and that superannuation holdings and investment properties are factors in this inequality. HILDA data shows that in 2014 the mean superannuation balance of the top 10% of people aged 50 to 69 was $991,268, up from $650,619 in 2002, compared to $210,798 in 2014 for the sixth to ninth decile and $13,719 for the bottom 50% (although a significant number of retirees in this age group do not have any superannuation balance).
There is a strong correlation between high superannuation balances, income and non-superannuation wealth. People in the top decile have access to higher levels of income to make higher levels of concessional contributions, and the ability to find the funds to make non-concessional contributions into a tax preferred investment environment.
As has been noted previously, the current superannuation system allows high income and high wealth individuals to over-accumulate in tax preferred superannuation, which increases wealth inequality as well as intergenerational inequality.
The Government proposals to restrict the level of contributions and to reduce the amount that can be retained in a tax free environment are important tools to address increasing levels of wealth inequality in our community.
Author: Helen Hodgson, Associate Professor, Curtin Law School and Curtin Business School, Curtin University
Whether it’s by coincidence or causation, the financial collapse of 2008 and 2009 has resulted in growing angst over income inequality.
Millions of workers disappeared from the workforce and have yet to return. This has magnified the gap between households at one end of the income spectrum and the other.
While this growing concern over the existing income distribution has emerged as a debating point in the worlds of public policy and politics, it’s been a challenge to pinpoint the optimal way to redistribute income to reduce inequality.
Our aim here is not to provide one. Alas, as with beauty and issues of fairness, the optimal distribution lies in the eye of the beholder. Nevertheless, most would agree that reducing the inequality gap is a worthy goal. Understanding what is causing the growing gap between rich and poor is key to figuring out how to reduce it.
Is it driven by natural causes such as age that can’t be easily effected by policy? Or is inequality rooted in more malleable factors like education or tax policy?
A statistical analysis of 53 countries that emerged from a graduate student’s research project provides some clues. And the analysis begins with what social scientists call the Gini coefficient.
Gini in a bottle
The Gini, developed by Italian statistician Corrado Gini in 1912, is a measure of income inequality applicable to both small and large populations, from households to countries.
The Gini coefficient is measured on a scale of zero to one. A Gini of zero indicates that everyone in the defined group shares income equally. This outcome is not necessarily good, however, as everyone in the group could be equally poor or destitute. A Gini of one means that one worker earns all the income and everyone else zero. This outcome is not necessarily bad, as many households depend upon the earnings of a single individual assuming the group is a household.
The Gini Index tracks which societies are the most unequal, and the Central Intelligence Agency lists some of the latest data on its World Factbook. Using just the most recent data on this site, Slovenia ranks as the least unequal with a Gini of 0.24 in 2012, while South Africa suffers from the most inequality, at 0.63 in 2013.
The latest data on the U.S. puts it somewhere in the middle, at 0.41.
‘Natural’ causes of inequality
In an attempt to shed some light on which forces or conditions in the economy affect income inequality, we analyzed how a variety of socioeconomic variables affect the differences between each country’s Gini coefficient.
Initially we looked at how just one variable, age, affected the Gini of 30 countries. We expanded this to 53 relatively developed countries in various continents and 10 variables.
Our analysis showed that the median age of the population appears to have a significant influence on the differences in Gini coefficients, which varies inversely with the median age of the population. That is, older populations are less unequal (have a lower Gini) than younger ones, probably because as individuals age there is less disparity in their incomes. Retirement from productive endeavors is an obvious leveler of income differences. In addition, the incentive to pursue ever-higher incomes diminishes as workers approach retirement, producing the age-earnings curve.
Age is one of the ways income disparity can be attributed to a “natural” cause, thus representing a challenge to policy makers hoping to reduce inequality, and was the most significant variable in our analysis.
Similarly, our analysis shows that greater GDP growth and the percentage of the population employed in the agriculture sector are negatively related to the Gini. That is, countries with higher economic growth or a greater the share of its workers engaged in agriculture have less inequality.
For the most part, the measures identified above can generally be attributed to environmental forces and normal human behavior and are thereby not easily affected by short-term policy. They explain most of the variation among countries in the Gini coefficient. In other words, these findings suggest most inequality is more or less hardwired into our societies and only long-term trends (in policy, demographics, etc.) can affect them.
Where policy can play a role
Our analysis did find that some variables more directly linked to short-term policy choices played a role in explaining the Gini differences among countries.
Among these, the variable that influenced inequality the most was tax policy. In particular, the higher the overall tax rate in terms of revenues as a share of GDP, the lower the Gini. This may help explain why countries like Switzerland and France, which have high tax rates on the wealthy, suffer from less income inequality than the U.S., which has relatively low ones.
But taxation can be a double-edged sword, as taxes may act as a deterrent to productive (income and job creation) behavior. Fortunately, it’s possible to design tax policy that encourages economic growth in the short term while raising government revenue in the long term.
Another policy variable that affects the Gini coefficient is investment. Our analysis showed that increasing investment in productive assets leads to greater income inequality. This seemingly counterintuitive result arises because investment expenditures produce GDP growth at a lag while detracting from current consumption.
The last significant variable we considered is unemployment, which, as you’d expect, leads to more income equality. Although this finding is intuitive (as were our results on aging and growth), it is comforting to learn that statistical analysis confirms what common sense dictates.
Four variables we tested – inflation, years of schooling, GDP per capita and government deficits (as a percent of GDP) – had no measurable influence on income inequality.
Together, these factors explain roughly three-quarters of the differences in the Gini among the 53 countries in our review. In other words, variables we didn’t consider are responsible for a quarter of the deviation in income inequality in these countries. Understanding what those factors are will require further review.
Leveling inequality
Putting these results into perspective suggests that some income inequality emanates from environmental forces and normal human behavior. However, public policy may exert a positive influence on reducing income inequality through economic policy that promotes economic growth, lower unemployment, greater labor force participation and appropriate tax policy.
Although by and large GDP growth is a natural variable that can’t be directly affected by policy makers, it’s still arguably the most important factor in reducing income inequality. Tax and regulatory policy, for example, are indirect ways to influence growth as significant and sustained economic growth has been shown to be among the biggest levelers of income inequality.
We believe public policy would best be structured toward that end.
Author: Dale O. Cloninger, Professor Emeritus, Economics & Finance, University of Houston-Clear Lake
Poverty in Australia has declined, welfare reliance has stabilised and long-term poverty is becoming rare – but overall economic wellbeing is no longer improving, and households wealth has remained static, despite rising property prices, according to Australia’s most respected longitudinal study of economic wellbeing.
And there is a rapidly growing wealth divide between generations, with median wealth increasing by 61% among people aged 65 and over, compared to just 3.2% among people aged 25 to 34, since 2001.
This is the picture from the latest statistical report of the Household, Income and Labour Dynamics in Australia (HILDA) Survey, collected by the Melbourne Institute of Applied Economic and Social Research. Collected every year, HILDA is Australia’s only nationally representative household longitudinal study, and has followed the same individuals and households since 2001.
Stagnating household incomes and wealth
Perhaps best summarising the experience of Australian households since 2001 is the path taken by median income, shown in the figure below. The HILDA data shows that in the early years of this century, the median household income (after taxes, and adjusted for both inflation and household size) grew strongly.
However, since 2009 growth has stalled, with the median income stagnating at approximately $45,000.
HILDA data on household wealth, collected every four years since 2002, shows a somewhat similar pattern. Median household wealth grew strongly between 2002 and 2006, but has since grown very little – despite continued increases in house prices.
Measures of average economic wellbeing of Australian householdsHILDA Survey, Release 14.0
In some respects, Australia has handled this slowdown quite well. There has been relatively little change in income inequality since 2009, and measures of poverty have actually declined slightly in recent years. For example, the percentage of the population with an income less than half the median income was 10.3% in 2014, down from its 2007 peak of 13%.
Decline in welfare reliance
Furthermore, while HILDA shows that the large decline in welfare reliance among working-age people between 2004 and 2008 was arrested by the 2008 global financial crisis, welfare reliance has increased only slightly since 2008.
Nonetheless, it is clear that overall economic wellbeing is no longer advancing as it was prior to the global financial crisis. Financial pressures have also increased for families using child care and for those with private health insurance. These markets have experienced substantial real price increases, effects of which have been exacerbated by government policies which in recent years have acted to reduce subsidies.
HILDA correspondingly shows that households’ expenditure on these items has been rising faster than their incomes.
Winners and losers
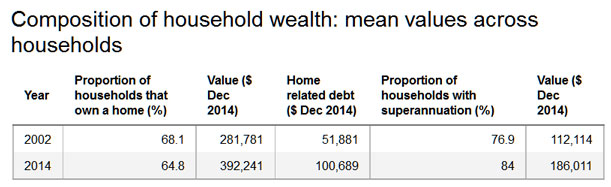
There are, moreover, some concerning trends evident in the HILDA wealth data. The proportion of adults who are home owners has declined from 57% in 2002 to less than 52% in 2014, and on current trend will be below 50% by next year. There is an important intergenerational dimension to this decline: home ownership has declined from 39% to 29% among people aged 25 to 34, from 63% to 52% among people aged 35 to 44, and from 76% to 67% among people aged 45 to 54. There has been almost no decline in home ownership among older age groups.
Associated with this, but also strongly connected to changes in superannuation holdings and to a lesser degree, investment property ownership, has been a growing divide in wealth between the young and old.
Between 2002 and 2014, median wealth grew by 39% among people aged 55 to 64 and by 61% among people aged 65 and over. By contrast, median wealth grew by only 3.2% among people aged 25 to 34, 7.4% among people aged 35 to 44 and 10.8% among people aged 45 to 54.
HILDA also shows that particular groups in the community have continued to experience high rates of disadvantage over the entire period since 2001. Most notably, people with disability, poor general health or poor mental health have not fared well economically, and poverty rates among children living in lone-parent households have consistently been above 20%.
Long-term disadvantage
The longitudinal nature of the HILDA data further provides important insights into the prevalence and determinants of persistent or long-term disadvantage. Long-term poverty is in fact relatively rare, with 85% of poverty spells lasting three or fewer years.
That said, poverty is considerably more likely to be long term for people with disability, Indigenous people, immigrants from non-English speaking countries, the elderly, single people, people living in rural areas, and people with low levels of education.
Perhaps most surprising are HILDA’s findings on welfare reliance over the longer term. While only around 18% of people aged 18 to 64 receive income support payments in any given year, nearly 45% of people in this age range received income support at some stage in the 14 years to 2014.
Indeed, nearly 70% of all working-age people were at some stage in a household that received income support payments. Contact with the welfare system is therefore very high, but is typically only for relatively short periods, suggesting the welfare system in many cases works as a temporary safety net rather than as a long-term income source.
In 2014, new questions on “material deprivation” were included in the HILDA Survey to provide more direct information on the groups in the community faring worst economically. Among the findings were that 12% of households did not have $500 in savings for an emergency, 8% did not have home contents insurance because they couldn’t afford it, and 5% could not afford dental treatment when needed.
Consistent with findings using more traditional income-poverty measures, rates of deprivation were found to be highest among lone-parent families, Indigenous people and people with severe disabilities.
The more direct material deprivation approach does reveal, however, that the elderly have very low rates of deprivation, despite having high rates of income poverty. This suggests that income needs are lower for the elderly, for reasons such as their high rates of (outright) home ownership.
Implications for future policy
The detailed picture of the economic lives of Australians that is provided by the HILDA Survey is necessarily somewhat complicated. It is nonetheless clear that the current trajectories of income and wealth are in general much lower than in the early years of this century.
The HILDA Survey data suggest that the effects of this slowdown have to date been relatively equitably distributed, notwithstanding some concerns about trends in the wealth distribution. Of course, there is no guarantee that this will continue to be the case in future, particularly in the context of the need to reduce the government deficit.
The form that deficit-reduction policies take will be profoundly important to the distribution of economic wellbeing over coming years.
Author: Roger Wilkins, Professorial Research Fellow and Deputy Director (Research), HILDA Survey, Melbourne Institute of Applied Economic and Social Research, University of Melbourne
Britain’s housing market is in a sorry state. With house prices forecast to fall, house building grinding to a halt and buyers pulling out of purchases amid job security fears, post-Brexit uncertainty has been worsened by the contrasting “visions” that won the vote.
These opposing visions are now evenly represented in Theresa May’s cabinet. The more liberal Leave campaign wanted greater economic freedom, with less government and “Brussels bureaucracy”. Its supporters have quickly retreated from any pledge to bring down immigration, which would compromise access to the EU single market.
The others in the Leave side, however, are happier to resist market forces, even accepting some short term sacrifice of living standards to restore “sovereignty”, and a sense of community they view as eroded by too much free movement. For these “grassroots” Leavers, concerned about social cohesion and quality of life, lower house prices are a key Brexit bonus. Controls on arrivals from the EU and strict barriers against refugees are intended, in part, to reduce the demand for homes and related public services.
This could, in turn, make housing more affordable to existing residents, with wages rising as fewer compete for available jobs. And if the economy slows, interest rates will fall further, potentially improving mortgage affordability.
Will Brexit lead to a buyers market?Toby Melville/PA Archive/Press Association Images
Houses could well become easier to buy if, as both factions promised, average incomes now rise due to “unshackled enterprise” and less competition for jobs. Those pursuing homes to live in may also find there are fewer rival buyers treating property as just another investment. Rule changes in April had already quelled buy-to-let demand. Absentee foreign buyers who had inflated prices in and near London might now look to buy in other capitals that will remain within the EU.
Making housing more expensive has been central to economic recovery strategy since 2010. This is because rising prices benefit homeowners, who are still a large majority of voters. Many younger voters priced out of the market will now hope that affordable housing can be part of May’s version of Conservatism. But while her swift installation might dispel the uncertainty that stalled pre-referendum investment – including housing starts – her new economic plans will have to rule out a sustained drop in prices, as this would hit household spending too hard at a time when other sources of demand are also weakening.
Households are already approaching a level of borrowing which proved unsustainable before 2008. So longer-term house price growth is unlikely to exceed national income growth, which most forecasters calculate will slow down as the UK starts its slow path out of the EU.
And even if Brexit does not restrain production and income growth, it is likely to weaken house buying demand by hitting the profitability of banks, whose recovery from crisis is still being slowed by tougher regulation, new entry and alternative forms of business borrowing.
So while many landlords suspect that Brexit will end the long escalation of housing costs both for buyers and renters, this is unlikely to make it any easier for the average household to find an affordable home.
The housing market has felt the immediate effect of Brexit chill.David Cheskin/PA Archive/Press Association Images
This is because although rising investment might speed up residential building and renovation, it would leave house builders vying for resources with commercial construction and other industries – even if the general labour supply is not constrained by lower immigration.
In short supply
The long run up in house prices reflects a chronic failure to build enough new homes, often traced to restrictive planning laws that reflect local concerns much more than eurocratic meddling.
To ensure profit, developers always have an incentive to release new homes more slowly than the market needs them. And neither local authorities nor housing associations are currently able to fill the gap. So while the estimated 11m adults and 3m children in inadequate accommodation in England indicates a real need for more houses to be built, the market is far from ready to deliver them.
How will a change in borders impact the labour market?Shutterstock
Although, this influx of people might actually help to boost labour supply and allow construction to quicken – but only if building firms can hire them. Housebuilders’ sagging share prices in the wake of the referendum suggest they might not.
And although lower immigration from the EU would eventually ease demand for housing, it would also reduce access to those legendary Polish builders, who will be hard to replace with local labour.
Always hazardous, economic forecasting is especially uncertain in relation to housing because buyers’ and suppliers’ finances are in line for both positive and negative shocks, on an uncertain timescale. But as a sharp fall in prices will only occur if the economy turns downwards, it would not bring the boost to affordability that Generation Rent awaits.
Author: Alan Shipman, Lecturer in Economics, The Open University
If the food industry is not in crisis, it certainly contains an increasing level of complexity and associated risks. A recent analysis suggested 50% of US food production is wasted, with global estimates above 30%.
Retailers want perfect produce, leading to wastage occurring throughout the food supply chain. They also seek low prices, leading to industrialisation of processes.
Food scares such as mad cow disease (BSE) and cross contamination mean many consumers have less trust in their food, increasingly seeking information on authenticity and production practices.
Over 80% of antibiotics used in the US are used in food production. Farming practices lead to environmental issues and may exacerbate to climate change. Alternate “real world” models are being developed to address some of these issues. For instance, farmers’ markets can reduce food miles, and demonstrate localism. Gleaning, where people collect leftover crops from farmers’ fields after they have been commercially harvested, is becoming popular. There is ever increasing legislation and standards, though these tend to be national or regional, and often onerous to implement.
Recent developments in the digital economy could help. Among these are a growing use of sensors providing information to allow more intelligent practices to reduce costs and improve flexibility. Real time temperature monitoring and smart fridges in homes can help reduce waste. But a relatively new innovation, the blockchain, is seen by many as offering significant opportunities within agricultural supply chains.
Blockchains are the technology that underpin cryptocurrencies like bitcoin, but they have uses other than currencies. They record information in a distributed ledger in a way that is both secure and immutable; by being distributed among many users these ledgers are resilient with no single point of failure, and they can be (depending on design), transparent to all users.
Blockchains and trust
Described by the Economist as “the trust machine”, blockchains provide supply chain transparency and data integrity, allowing a visible assurance of authenticity.
A number of startups are exploring the potential for blockchains in agriculture. Most notable is Provenance.org, a small UK B2B software startup using the blockchain to establish the authenticity of high value goods, including food. They are experimenting with proving the supply chain of tuna caught in Indonesia being delivered to Japanese restaurants. They will use information on sensors or RFID tags and local certification, recorded in the blockchain, to track the fish along its journey from “hook to fork”; creating in the words of one of their founders, a “reputation system”.
Other software firms are developing similar off the shelf solutions for global tracking. Innovators are researching ways in which DNA can be recorded and tagged to an animal, and recorded in the blockchain. This information can easily be made available to end users and customers using mobile phones and apps.
BlockCrushr Labs is a Canadian startup addressing issues of local food poverty and is using the currency and transparency aspects of blockchain technology to increase donations to homeless people, and also to ensure these donations are responsibly spent.
Farmshare is using blockchain to evolve community-supported agriculture, where a local “currency” can be used to purchase locally produced food within a natural community.
Farmers continue to look for ways to certify their crops.U.S. Department of Agriculture/Flickr, CC BY
A wireless sensor firm, Filament, is developing sensors to monitor crop health and recording results in a blockchain. Others are embedding sensors in the harvested crop to record temperature and humidity. These make it easier to trace damaged crops. Linking these sensor records to other connected equipment in the internet of things, such as transport and storage coolers ensures end to end monitoring and safe handling.
Skuchain is developing improved barcodes and RFID tags, and blockchain technology with the aim of protecting end to end global supply chains against counterfeiting.
Firms such as sandwich chain Subway have pledged to remove antibiotics and preservatives from their ingredients. If the wish to deliver these promises, a transparent blockchain where product origin and contents are visible to all would seem to be a suitable approach.
We may typify these proofs of concept and ideas as using the blockchain to provide a permanent audit trail, where visibility leads to accountability and trust, without the need to establish local reputation. This philosophy is obviously not restricted to agriculture.
However blockchain solutions have their own limitations. Principal among these are the need to ensure a tight coupling between the product and its digital representation, and the ongoing need for some form of reputable local certification system in the first mile to, for example, establish the fact of ethical practices.
The inevitable mixing of products and supply chains is another factor complicating easy adoption and implementation. For these reasons current proofs of concept tend to be high value and low volume, and often stimulated by strong social motivations of their founders. Blockchains can only be part of a wider solution, and may remain limited to niche markets where establishing provenance can command higher returns.
Author: Phil Godsiff, Senior Research Fellow, University of Surrey
In 2008, short of sending a suitcase full of cash, there was essentially just one way for an individual to send money between, say, the United States and Europe. You had to wire the money through a mainstream financial service, like Western Union or a bank. That meant paying high fees and waiting up to several days for the money to arrive.
A radically new option arose in 2009 with the introduction of bitcoin. Bitcoin makes it possible to transfer value between two individuals anywhere in the world quickly and at minimal cost. It is often called a “cryptocurrency,” as it is purely digital and uses cryptography to protect against counterfeiting. The software that executes this cryptography runs simultaneously on computers around the world. Even if one or more of these computers is misused in an attempt to corrupt the bitcoin network (such as to steal money), the collective action of the others ensures the integrity of the system as a whole. Its distributed nature also enables bitcoin to process transactions without the fees, antiquated networks and (for better or worse) the rules governing intermediaries like banks and wire services.
Bitcoin’s exciting history and social impact have fired imaginations. The aggregate market value of all issued bitcoins today is roughly US$10 billion. The computing devices that maintain its blockchain are geographically dispersed and owned by thousands of different individuals, so the bitcoin network has no single owner or point of control. Even its creator remains a mystery (despite manyefforts tounmask her, him or them). Bitcoin’s lack of government regulation made it attractive to black markets and malware writers. Although the core system is well-secured, people who own bitcoins have experienced a litany of heists and fraud.
Even more than the currency itself, though, what has drawn the world’s attention are the unprecedented reliability and security of bitcoin’s underlying transaction system, called a blockchain. Researchers, entrepreneurs, and developers believe that blockchains will solve a stunning array of problems, such as stabilization of financial systems, identification of stateless persons, establishing title to real estate and media, and efficiently managing supply chains.
Understanding the blockchain
Despite its richly varied applications, a blockchain such as bitcoin’s aims to realize a simple goal. Abstractly, it can be viewed as creating a kind of public bulletin board, often called a “distributed ledger.” This ledger is public. Anyone – plebeian or plutocrat, baker or banker – can read it. And anyone can write valid data to it. Specifically, in bitcoin, any owner of money can add a transaction to the ledger that transfers some of her money to someone else. The bitcoin network makes sure that the ledger includes only authorized transactions, meaning those digitally signed by the owners of the money being transferred.
The key feature of blockchains is that new data may be written at any time, but can never be changed or erased. At first glance, this etched-in-stone rule seems a needless design restriction. But it gives rise to a permanent, ever-growing transactional history that creates strong transparency and accountability. For example, the bitcoin blockchain contains a record of every transaction in the system since its birth. This feature makes it possible to prevent account holders from reneging on transactions, even if their identities remain anonymous. Once in the ledger, a transaction is undeniable. The indelible nature of the ledger is much more powerful and general, though, allowing blockchains to support applications well beyond bitcoin.
Consider, for example, the management of title to a piece of land or property. Property registries in many parts of the world today are fragmented, incomplete, poorly maintained, and difficult to access. The legal uncertainty surrounding ownership of property is a major impediment to growth in developing economies. Were property titles authoritatively and publicly recorded on a blockchain, anyone could learn instantly who has title to a piece of property. Even legitimate anonymous ownership – as through a private trust – could be recorded on a blockchain.
Such transparency would help resolve legal ambiguity and shed light on malfeasance. Advocates envision similar benefits in blockchain recording of media rights – such as rights to use images or music – identity documents and shipping manifests. In addition, the decentralized nature of the database provides resilience not just to technical failures, but also to political ones – failed states, corruption and graft.
Smart contracts
Blockchains can be enhanced to support not just transactions, but also pieces of code known as smart contracts. A smart contract is a program that controls assets on the blockchain – anything from cryptocurrency to media rights – in ways that guarantee predictable behavior. A smart contract may be viewed as playing the role of a trusted third party: Whatever task it is programmed to do, it will carry out faithfully.
Suppose for example that a user wishes to auction off a piece of land for which her rights are represented on a blockchain. She could hire an auctioneer, or use an online auction site. But that would require her and her potential customers to trust, without proof, that the auctioneer conducts the auction honestly.
To achieve greater transparency, the user could instead create a smart contract that executes the auction automatically. She would program the smart contract with the ability to deliver the item to be sold and with rules about minimum bids and bidding deadlines. She would also specify what the smart contract is to do at the end of the auction: send the winning bid amount from the winner to the seller’s account and transfer the land title to the winner.
Because the blockchain is publicly visible, anyone with suitable expertise could check that the code in the smart contract implements a fair and valid auction. Auction participants would only need to trust the correctness of the code. They wouldn’t need to rely on an auctioneer to run the auction honestly – and as an added benefit, they also wouldn’t need to pay high auctioneer fees.
Handling confidentiality
Behind this compelling vision lurk many technical challenges. The transparency and accountability of a fully public ledger have many benefits, but are at odds with confidentiality. Suppose the seller mentioned above wanted to conduct a sealed-bid auction or conceal the winning bid amount? How could she do this on a blockchain that everyone can read? Achieving both transparency and confidentiality on blockchains is in fact possible, but requires new techniquesunder development by researchers.
Another challenge is ensuring that smart contracts correctly reflect user intent. A lawyer, arbiter or court can remedy defects or address unforeseen circumstances in written contracts. Smart contracts, though, are expressly designed as unalterable code. This inflexibility avoids ambiguity and cheating and ensures trustworthy execution, but it can also cause brittleness. An excellent example was the recent theft of around $55 million in cryptocurrency from a smart contract. The thief exploited a software bug, and the smart contract creators couldn’t fix it once the contract was running.
Bitcoin is a proof of concept of the viability of blockchains. As researchers and developers overcome the technical challenges of smart contracts and other blockchain innovations, marveling at money flying across the Atlantic will someday seem quaint.
Authors: Ari Juels, Professor of Computer Science, Jacobs Technion-Cornell Institute, Cornell Tech, and Co-Director, Initiative for CryptoCurrencies and Contracts (IC3), Cornell University; Ittay Eyal, Research Associate, Computer Science and Associate Director, Initiative For Cryptocurrencies and Contracts (IC3), Cornell University.