Super Tops $2 Trillion

APRA released their quarterly superannuation stats today. Superannuation assets totalled $2.0 trillion at the end of the March 2015 quarter, up by $115 billion from December. Self Managed Super Funds continued to power ahead, both in number of funds (up by 5,911 funds) and value (up $26.6 billion), though relative share fell slightly.

Over the 12 months from March 2014 there was a 14.3 per cent increase in total superannuation assets. The total value lifted $115 billion in the last 3 months.

Total assets in MySuper products totalled $420.2 billion at the end of the March 2015 quarter. Over the 12 months from March 2014 there was a 23.1 per cent increase in total assets in MySuper products.

There were $23.7 billion of contributions in the March 2015 quarter, up 4.4 per cent from the March 2014 quarter ($22.7 billion). Total contributions for the year ending March 2015 were $101.6 billion.

Outward benefit transfers exceeded inward benefit transfers by $641 million in the March 2015 quarter.

There were $14.4 billion in total benefit payments in the March 2015 quarter, an increase of 9.2 per cent from the March 2014 quarter ($13.2 billion). Total benefit payments for the year ending March 2015 were $57.5 billion.

Net contribution flows (contributions plus net benefit transfers less benefit payments) totalled $8.7 billion in the March 2015 quarter, a decrease of 1.4 per cent from the March 2014 quarter ($8.8 billion). Net contribution flows for the year ending March 2015 were $39.3 billion.

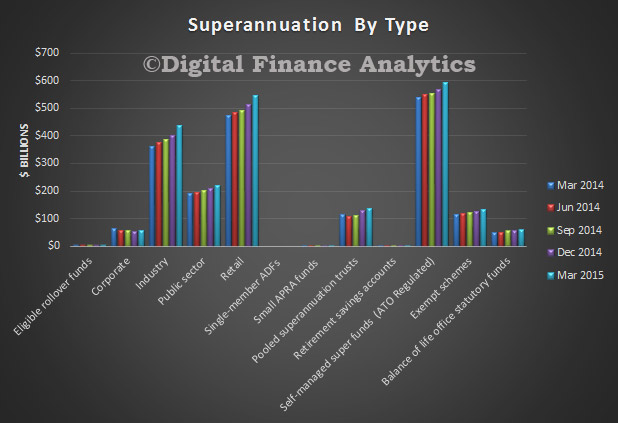
Looking at the splits, the trend growth was strong in industry, retail and SMSF.

SuperByTrendTypeMar2015
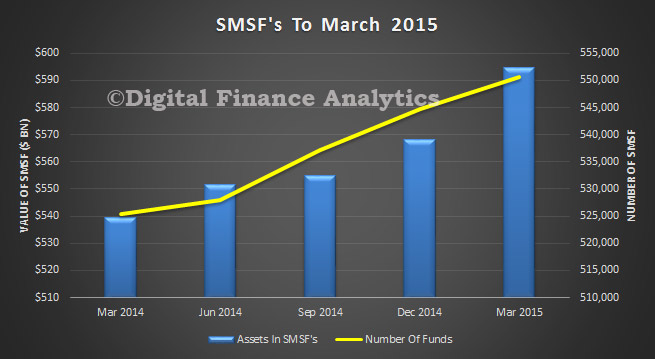
Looking at SMSF, both asset values and number of funds show a steady rise.

SMSFa-Mar-2015
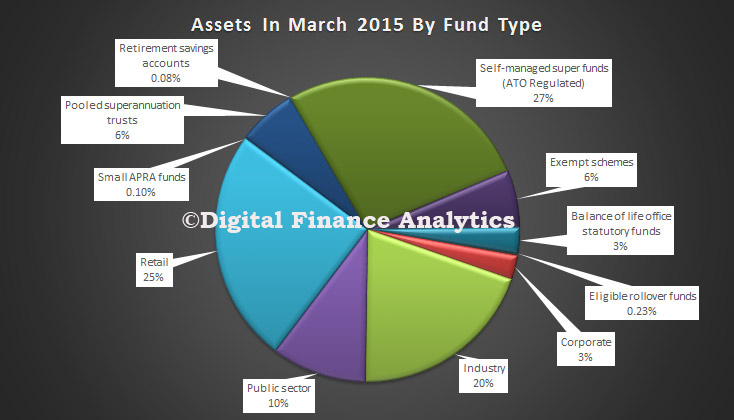
However whilst 27% of all superannuation funds are now held in SMSF, this decreased by 1% from a year ago.

SuperSplitsMar2015The annual industry-wide rate of return (ROR) for entities with more than four members for the year ending March 2015 was 13.0 per cent. The five year average annualised ROR to March 2015 was 8.0 per cent.

As at the end of the March 2015 quarter, 52 per cent of the $1.35 trillion investments for entities with at least four members were invested in equities; with 24 per cent in Australian listed equities, 22 per cent in international listed equities and 5 per cent in unlisted equities. Fixed income and cash investments accounted for 32 per cent of investments; 19 per cent in fixed income and 13 per cent in cash. Property and infrastructure accounted for 12 per cent of investments and 4 per cent were invested in other assets, including hedge funds and commodities.

High Super Fees Erode Returns By 5% – Grattan Institute

The latest report from the Grattan Institute – an independent think tank dedicated to developing high quality public policy for Australia’s future – is on superannuation. It reconfirms fees are too high, savers are getting lower returns than they should, and further reforms are needed urgently. We concur. You can read DFA analysis on super here.  As the balances on super accounts grow ever bigger, the imperative for significant reform builds.

Grattan Institute’s 2014 report, Super Sting, found that Australians are paying far too much for superannuation. We pay about $21 billion a year in fees. That report proposed that government reduce fees by running a tender to select funds to operate the default accounts used by most working Australians.

The Murray Financial System Inquiry came to similar conclusions to those in Super Sting. Its 2014 report finds there is not strong competition based on fees in the superannuation sector. It recommends a “competitive mechanism”, or tender, to select default products, unless a review held by 2020 shows the sector has become much more efficient.

This report analyses superannuation fees and costs in depth. It shows that there are excess costs in both administration and investment management. It evaluates recent policy initiatives to lower fees and recommends further reforms. Our new analysis confirms the conclusions of our previous report. In both default and choice funds, administration fees are too high, and take a toll on net returns. There is little evidence that funds that charge higher fees provide better member services. There are too many accounts, too many funds, and too many of them incur high administrative costs. We pay $4 billion a year above what would be charged by lean funds. Investment fees are also too high. Many funds do not deliver returns that justify their fees. Cutting fees to what high-performing, lean funds charge could save more than $2 billion a year. In sum, superannuation could be run for much less than the $16 billion currently charged by large funds (self-managed super costs another $5 billion).

The superannuation industry argues that its $21 billion costs are not excessive, and will fall over time. It opposes a tender for default accounts based on fees, claiming that it would reduce investment quality and net returns. But current initiatives to reduce costs are not enough. The Stronger Super reforms to reduce administration costs and make default products transparent will cut total default fees by about $1 billion. The Future of Financial Advice reforms could yield benefits for choice account holders. But even if regulators pursue these initiatives with zeal, they will leave billions on the table. If remaining excess costs are not removed, they will drain well over 5 per cent – or $40,000 – out of the average default account holder’s fund by retirement. Excess costs in choice superannuation are even larger.

Government must act to close accounts, merge funds and run a tender to select default products. The tender would save account holders a further $1 billion a year, and create a benchmark to force other funds to lift their game. A high performing superannuation system will take the pressure off taxpayers and give Australians greater confidence in their retirement.

Early Access To Super Is On The Rise

The Department of Human Services released their 2013-14 Annual Report. One topic of note is the rise in the early release of superannuation savings.

According to the DHS, Superannuation cannot generally be accessed before a person reaches their preservation age. In some limited circumstances the law allows for early access to superannuation. Most of the grounds under which early access is permitted are administered directly by the superannuation funds. These include:

  • severe financial hardship
  • terminal illness
  • permanent incapacity
  • balances of $200 or less
  • permanent departure from Australia

The DHS is responsible for assessing applications for the early release of superannuation on compassionate grounds. These include payments for:

  • medical or dental treatment for you or your dependent
  • transport for medical or dental treatment for you or your dependent
  • arrears on your mortgage to prevent your home being sold by your lender
  • modification to your home or vehicle to accommodate a severe disability for you or your dependent
  • palliative care for a terminal illness for you or your dependent
  • expenses associated with your dependent’s death, funeral or burial

The regulations of compassionate grounds are set out in Australian law. While early access to superannuation is possible it is always subject to strict legal criteria. Applications must be supported by evidence. You must not be able to meet the costs by other means, such as savings

There was 7% uplift in withdraws, from last year, but the increase in applications was not matched by a rise in approvals by the department. Two-thirds of all applications were approved in full or part, with the total value of early payouts rising only 3.8%, or $5.4 million, to $151 million. The average payment approved by the department rose only two per cent to $12,874 from $12,643 in 2012/13. This is small beer relative to the $1.85 billion in super held by Australians and will reduce the chatter about the rising hardship levels amongst households. The main motivation is to pay down the mortgage, and this is confirmed by our household surveys.

DHS Chart

ASIC Says Life Insurance Industry Needs Higher Standards

ASIC today released their review of activity in the Life Insurance Industry, and finds that consumers interests are not always given priority. The $44bn industry touches superannuation, annuities, and other elements, as shown in a diagram reproduced from the report. We have previously highlighted the issues around annuities. They found that high upfront commissions are more strongly correlated with non-compliant advice, and we think that it is another case, like FOFA of product sales being dressed up as advice.

ASICLifeInsuranceOct2014

An ASIC review of life insurance advice has found that the industry needs to improve the quality of advice and ensure that the interests of consumers are given priority. ASIC’s review of more than 200 advice files from large, medium and small Australian financial services (AFS) licensees found that 63% were compliant. However, more than one third (37%) of the advice consumers received failed to comply with the laws relating to appropriate advice and prioritising the needs of the client. ‘This is an unacceptable level of failure, and the life insurance industry is now on notice to lift standards and professionalism. Both insurers and advice firms need to work on delivering a consistently better service for consumers’, ASIC Deputy Chairman Peter Kell said.

‘Life insurance is a key product through which consumers manage risk for themselves and their families. It is therefore important that both the products and the advice meet the consumer’s requirements. ‘There is both a need and a demand for quality life insurance advice, and our report provides examples of advisers delivering a service that meets the needs of their clients. However, this result must be achieved on a more consistent basis’, Mr Kell said. ASIC’s report sets out the various commission models that are used to remunerate advisers in the life insurance sector. The report found that high upfront commissions are more strongly correlated with non-compliant advice, including in situations where the recommendation is to switch products.

‘The industry as a whole needs to consider how remuneration and compliance practices can better support good quality outcomes for consumers’, Mr Kell said. Affordability of insurance is an important issue for consumers, and ASIC’s report includes cases where clients were recommended insurance cover that was likely to be very difficult to afford given their financial circumstances. ASIC’s report confirmed that the high rate at which life insurance policies are lapsing warrants consideration by the life insurance industry to ensure that industry practices are sustainable.

ASIC has made a number of recommendations for insurers, AFS licensees, advisers and their professional associations, including a focus on how to ensure client interests are met and balancing the issue of affordability versus cover. Mr Kell said, ‘ASIC is committed to working with the industry to address the problems we’ve identified and to improve outcomes for consumers.’ Following the surveillance work and the conduct that has been uncovered ASIC has commenced follow-up investigations in certain cases which are ongoing. ‘Where inappropriate advice was provided we are considering enforcement action or other regulatory action’, Mr Kell said.

However, DFA believes that this is part of a wider issue with consumer advice in Financial Services. The problem is the various elements within a consumer’s financial portfolio will fall under different regulatory environments, which are just not consistent. If its mortgage related, then the advice is centred on whether the loan is suitable or not (no best client interest here) and commissions are rife ; if its financial planning related, the FOFA, offers some safeguards, and also significant gaps around general advice, as we discussed recently. Now life insurance is another problematic area. It is time for some joined up thinking. A consumer will require financial service advice across multiple products including loans and investments, but all part of a single financial portfolio. There should be consist consumer-centric processes, irrespective of the products being touted. We applaud ASIC for again championing the interests of the consumer, but there is so much more to be done.

The solution is simple. Separate advice from product sales (a.k.a general advice). Exclude any incentive payments for those providing advice. Clearly disclose any product fees (including trading and transaction fees). Job done.


Super Balances Now Up To $1.85 trillion – APRA

APRA just published their Quarterly Superannuation Performance data to June 2014. Superannuation assets totalled $1.85 trillion at the end of the June 2014 quarter. Over the 12 months to June 2014 there was a 15.3 per cent increase in total superannuation assets. Over the June 2014 quarter, total superannuation assets increased by 2.6 per cent.

SuperJune2014 There were $27.6 billion of contributions in the June 2014 quarter, up 5.9 per cent from the June 2013 quarter ($26.1 billion). Total contributions for the year ending June 2014 were $95.0 billion. Outward rollovers exceeded inward rollovers by $531 million in the June quarter. There were $14.7 billion in total benefit payments in the June 2014 quarter, an increase of 8.3 per cent from the June 2013 quarter ($13.6 billion). Total benefit payments for the year ending June 2014 were $55.3 billion. Net contribution flows (contributions plus net rollovers less benefit payments) totalled $12.4 billion in the June 2014 quarter, an increase of 15.1 per cent from the June 2013 quarter ($10.8 billion). Net contribution flows for the year ending June 2014 were $37.3 billion.

The number of entities with assets of more than $50m fell by 3 in the last 12 months, from 213, to 210.

The self managed super fund sector, according to the ATO, accounted for 30.05% of all assets.

SuperSplitJune2014The value of assets in SMSF continues to grow, standing at $557 billion (the red area), although the absolute percentage has fallen in the past year, from 30.8% to 30.05% (the blue line).

SuperSMSFSummaryJune2014

ASIC Warns On Super And Managed Investment Fees

ASIC today released a report into fee disclosure practices for super and managed investments.  The intention of the fee and cost disclosure requirements is to promote comparability of products. However, ASIC’s review of industry practices indicates that there is significant variation in the disclosure of fees and costs. A key driver of this variation is the frequent complexity of the operational and investment structures of funds. In addition, data quality and differences in the interpretation of the fee and cost disclosure requirements can also lead to variations in disclosed fees. As a result, DFA’s take on the report is that investors need to be very careful when comparing products. ASIC makes a number of significant observations. Remember this is a $2,338.8bn industry, and fees have a profound impact on the overall returns from an investment.

  • The reporting of fees and costs in underlying investment vehicles has been an area of significant concern. The fees and costs that are generally disclosed in a fund-of-funds arrangement are the fees and costs of the fund-of-funds manager, and not the fees and costs associated with the underlying funds. As a result, fees and costs may be understated by as much as 0.20%–0.40% annually.
  • The disclosure of indirect costs provides investors with a more accurate representation of the overall fee burden associated with each product and allows for increased comparability across funds.
  • Whilst difficult, APRA expects trustees to make all reasonable efforts to obtain information about their investments beyond the first non-connected entity.
  • The disclosure of management costs is an area of significant concern for ASIC. Anecdotally, it has been alleged that there are instances of costs being manipulated to present investors with a product that appears to be more financially attractive than it really is.
  • These disclosure practices can be fundamentally misleading because they reduce the amount disclosed as management costs and do not accurately portray the cost of individual products. They also prevent investors from being able to accurately compare superannuation or managed investment products against each other.
  • There is also a lack of clarity in the industry regarding how future performance fees should be determined and disclosed. Currently, a number of alternative methods are used to determine future performance fees, and this can result in significantly different projections across superannuation funds. One common practice is for superannuation funds to disclose the previous year’s performance fees as a reflection of what will occur in the current year. ASIC considers the adoption of this practice may lead to misleading results because it implies that past performance fees are indicative of future performance fees.
  • Inconsistency in the disclosure of fees in relation to the treatment of tax undermines the purpose of the Stronger Super reforms because it prevents investors from accurately and confidently comparing fee structures between superannuation funds.
  • The disclosure of fees net of income tax assumes that all investors receiving the PDS will be entitled to a share of the reduction in income tax resulting from the costs that the fees pay for. However, only investors who have received taxable income during the year into their superannuation account—such as positive investment returns or taxable contributions (e.g. employer contributions)—are entitled to a reduction in income tax. ASIC considers the disclosure of fees net of income tax to be misleading to investors who are not entitled to a reduction in income tax.
  • ASIC encourages industry to develop industry standards for good practice in fee and cost disclosure for superannuation funds and managed investment products.

We discussed the questions of fees in the light of FOFA recently. The ASIC report provides further evidence that improvements need to be made.

Super Fees Are Way Too High In Australia

In an interesting speech yesterday Dr David Gruen Executive Director Macroeconomic Group presented some startling data to the assembled company at the CEDA State of the Nation 2014 event. Citing the Gratton Institute report he said “in 2013, Australian superannuation fees ranged from approximately 0.7 per cent to 2.4 per cent of mean fund size, with fees averaging around $726 per year for a member with a balance of $50,000”. But more significantly, he also cited some international comparative data from the OECD “Although international comparisons are difficult, in 2011, Australia’s average superannuation fees were around three times those in the UK. In aggregate, Australians spend around $20 billion annually, or over 1 per cent of GDP, on superannuation fees”.

Now, looking at the international comparative data, available from the OECD Pension Funds Database, we find Australia is not only more expensive than the UK, but most other countries where super, or a pension equivalent exists, and good data is available. The OECD data is a ratio of expenses to assets, rather than fees. We see that Australia is consistently more expensive than other countries, other than Spain and Slovenia. New Zealand is lower, than Australia, slightly. Does the difference reflect the size of our superannuation industry, because whilst we have per capita, the largest super pools, we do not seem to be reaping scale benefits. Why is this? Could it have something to do with the industry concentration in the sector?

SuperFeesOECDDr Gruen goes on to say:

A microeconomic reform that permanently reduced costs across the economy by a few tenths of 1 per cent of GDP would be considered a significant and worthwhile reform. Significant reductions in superannuation fees would have widespread benefits for society as a whole.

This problem is a global one. In 2009, the Squam Lake Working Group – probably the most prestigious group of finance academics ever assembled, with representatives from a variety of different viewpoints, including Frederic Mishkin from Colombia University, Nobel Prize winner Robert Shiller, John Cochrane from the Chicago School and Raghuram Rajan, now the Governor of the Reserve Bank of India – had this to say:

‘High-fee funds argue that their fees are justified by superior performance. A large body of academic research challenges that argument. On average, high fees are simply a net drain to investors. While some investors might gain by selecting successful high-fee funds, the negative-sum nature of the process implies that other investors must lose even more. Most employees saving for retirement are poorly placed to compete in this game. They should not be forbidden from doing so, but disclosure of high fees and a “surgeon general’s warning” are appropriate.’6

The impact on fees of recent initiatives is unclear at this stage. In particular, the introduction of MySuper and Superstream should make the sector more efficient and push down costs — and there is some evidence that this is occurring. Nevertheless, there needs to be policy consideration of further options to increase competition and drive down costs. Given the stakes, this is an important area for the Financial System Inquiry to examine.

Finally, he makes an important point about the need to provide for income in retirement, rather than simply wealth accumulation, and a call for product innovation in this area.

The key focus of superannuation should be on the provision of retirement income, rather than primarily on wealth accumulation. As more Australians move into retirement, it will become increasingly important for the industry to provide the range of products that people need to manage the financial aspects of their retirement.

It will be increasingly important for the private sector to help manage longevity risk through income stream products such as insurance or pooled products. Most life insurance products do not address longevity risk and the individual immediate annuity market in Australia is small. At issue is the availability of a range of products that balance risk transfer and affordability and the identification of any industry, taxation or regulatory impediments to developing cost effective products that enable individuals to manage longevity risk.

Longevity risk therefore is an important issue, presenting an opportunity for innovation by the superannuation industry. It is also an important issue to get right given the rapidly rising numbers of retirees. In particular, we do not want longevity risk ‘solutions’ that lock retirees into inappropriately high fees and fail to provide sufficient incentives for the superannuation industry to become more efficient.

Our research into the Australian Annuities industry, which we summarised in an earlier post, highlighted that many households were not aware of how much they would need in retirement, were unaware of the average life expectancy, and that annuities were seen as a potentially risky, high cost and inflexible solution:

We asked about their attitudes to annuities. Most said they did not understand them, thought they would get ripped off, and were a poor choice because they wanted to keep control. They also made the point that governments might change the rules on them, and in any case nearly 80% said they would rely on government pensions to see them through.

The bottom line is that not many households are interested at the moment. Younger households might be, but of course later in life. So the demand side of the equation suggests that annuities will not be the product of choice for many anytime soon.

The broader issue of a mismatch between savings and income expectations, and future life expectancy is a bigger and more serious issue, as the government will not be able to afford to extend support to the every growing ranks of baby boomers who have exhausted their superannuation savings. This looks like a significant issue which requires significant changes in education and perhaps policy.

It will be interesting to see what transpires from the Financial System Inquiry, and whether we see further product innovation develop, alongside pressure to reduce fees. Given the big banks have a significant footprint in superannuation, we can expect opposition to fee reduction, and if fees do fall significantly, then pressure on profitability of the majors. Finally, it is worth noting that this speech was posted on the Treasury website!

The Superannuation Story, part 1

In our first post for the new year, we begin a multi-part examination of superannuation, using the recently released data from APRA on industry and fund level performance to June 2013, together with DFA’s own research. Superannuation has become big business, with total assets now worth over $1.62 trillion (compare this with the $5 trillion in residential property in Australia). Last year it grew by 15,7%, or $219.8 billion. So it is important to understand the industry, how funds are performing, and to discover if there are important segmented differences. Note that this excludes the self-managed superannuation sector, which is controlled by the ATO, and runs on a different reporting cycle; and very small funds. These funds rose by 15.5% to be worth $506 billion, representing. SMSFs constitute 31% of the total. We will come back to these later, but today we look at the bigger funds.

To start the analysis, lets look at overall returns across the funds. The average performance to June 2013 was 13.7% in the last 12 months. This is the best result since the GFC in 2007, and ahead of the long term average of around 6%. But this average masks important differences, as shown on the chart below, which is a simple plot of returns ranked from lowest, to highest. This is data from nearly 300 funds, so not all the individual funds are labelled, it is the range of performance, from negative performance, through to over 20% which is interesting. It does make a difference as to which funds your money is in!

Super-2013-1We did more detailed analysis of the top 200 funds. Here we show the 1-year data, and the smoother 5-year data by fund, stack ranked from lowest to highest. Again, not all funds are labelled. We see some funds performing much better than others, and some loosing over the 5-year view.

Super-2013-2If we take the top 50 funds by size, and plot the performance, we see that size does not seem to matter when it comes to performance. We have included 10-year performance data, though there are some gaps as not all funds are that old. Performance is quite often not sustained across the three time horizons as some funds appear to find it hard to maintain enduring good performance.

Super-2013-7

Funds are categorised by APRA into Industry Funds, Retail Funds, Public Sector Funds and Corporate Funds. The largest by value are Retail Funds (44%), then Industry Funds (34%).

Super-2013-4Membership is also spread across the fund types, with 49% in Retail Funds, and 41% in Industry funds.

Super-2013-5The average member balance varies by fund type. The average member in an Industry fund has the lowest balance ($27,173) compared with Retail ($30,161), Corporate ($120,273) and the Public Sector ($63,889).

Super-2013-6The final picture today, is the relative performance by fund type. Retail funds, whether you look at 1 year, 5 years or 10 years, are under performing. Reasons will include the need for the entity to make returns to shareholders, commissions paid to advisors, different fee structures, and innate process inefficiency.

Super-2013-3One last piece of data, there are over 28 million fund members, which means that many people will hold more than one superannuation account. We will come back to the significance of this later.

So, to conclude, we see that Industry funds perform better, that the size of the fund is not correlated to performance in the short or long term, and that there are wider variations in performance across funds, and funds types. All this leads to considerable complexity when individuals are thinking about their superannuation, and later we will use data from our surveys to compare and contrast. But its clear that not all Superannuation Funds are the same, caveat emptor (let the Buyer beware)!