Latest Edition Of The Property Imperative Released Today

The Property Imperative, Fourth Edition, published April 2015 is available free on request. This report which summarises the key findings for our research into one easy to read publication. We continue to explore some of the factors in play in the Australian residential property market by looking at the activities of different household groups using our recent primary research, customer segmentation and other available data. Specifically we look at the property investment juggernaut and how we are becoming a nation of  property speculators. It contains:

  • results from the DFA Household Survey to end March 2015
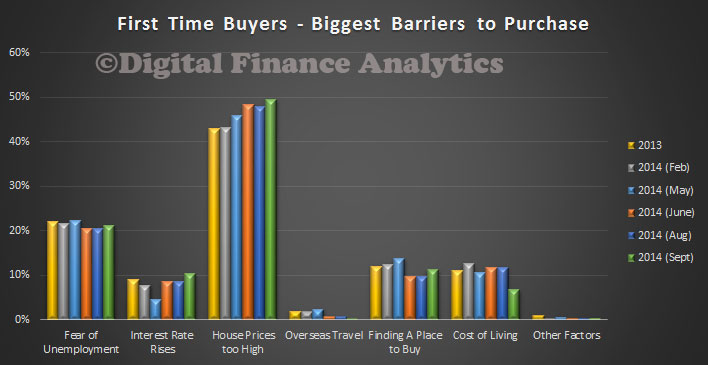
  • a focus on first time buyer behaviour and overseas property investors
  • an update of the DFA Household Finance Confidence Index

PropertyImperativeLargeGo here to request a copy.

From the introduction:

This report is published twice each year, drawing data from our ongoing consumer surveys and blog. This edition dates from April 2015.

The Australian Residential Property market is valued at over $5.4 trillion and includes houses, semi-detached dwellings, townhouses, terrace houses, flats, units and apartments. In the past 10 years the total value has more than doubled. It is one of the most significant elements driving the economy, and as a result it is influenced by state and federal policy makers, the Reserve Bank, Banking Competition and Regulation and other factors. Residential Property is therefore in the cross-hairs of many players who wish to influence the economic fiscal and social outcomes of Australia. The Reserve Bank (RBA) has recently highlighted their concerns about potential excesses in the housing market is on their mind, when considering future interest rate cuts.

According to the Reserve Bank (RBA), as at February 2015, total housing loans were a record $1.43 trillion , with investment lending now at a record 34.4%, and representing more than half of all loans made last month. There were more than 5.2 million housing loans outstanding with an average balance of about $241,000. Approximately two-thirds of total loans were for owner-occupied housing, while one-third was for investment purposes. 36.9% of new loans issued were interest-only loans. This report will explore some of the factors in play in the Australian Residential Property market. We will begin by describing the current state of the market by looking at the activities of different household groups leveraging recent primary research and other available data. We also, in this edition, feature recent research into first time buyers and foreign investors; and look at household finance confidence.

Digital Disruption and P2P Lending

DFA research was featured in a Sydney Morning Heald feature today “Banks look vulnerable as lucrative loans market gets personal online” by banking reporter Clancy Yates. The article nicely highlights some of the interesting and potentially disruptive plays in the evolving Australian market, including the peer-to-peer lending sector.

Latest DFA Survey – House Prices Expected To Rise [Still]

Today we continue our analysis of the DFA household survey data to March 2015 by looking at the cross segment comparative data. We use the DFA segment definitions and have updated our models to take account of changes in population, and property purchase type. The proportion of households who are excluded from property rose again, and the investment sector continues to grow strongly. The current distribution of households by segment are shown below.

HouseholdsMar2015There is still significant expectation that house prices will continue to rise in the next 12 months, despite the recent gains, though Sydney centric households are most bullish. Investors have high expectations, and as we will see when we drill into this segment, capital gains are top of mind. Down traders are relatively less confident of prices continuing to rise, which explains why this segment still wants to sell now, to crystalise recent gains.

PricesRiseMar2015Looking at plans over the next 12 months, more investors are piling in, so we would expect to see this translate into further momentum in the investment sector. Last month more than half of loans were for investment purposes.

TransactMar2015In terms of borrowing plans, investors, up-traders and first time buyers are the most likely to borrow. Those down traders who are thinking of grabbing an investment property are quite likely to gear, to take advantage of tax breaks.

BorrowMore-Mar2015We see that up-traders, first time buyers and want to buys are most likely to be saving to buy, although the lower returns on deposits are proving to be a real problem for many.

Buy-Mar2015Finally, segments have different propensities to use a mortgage broker. Whilst refinancers, and first time buyers are most likely to use a broker, we also see a continued rise in the number of portfolio investors using a broker. However we see in the survey data a high level of dissatisfaction from this segment with the quality and range of advice from brokers as their needs are more complex, and many brokers tend to focus on simple binary transactions. We think there is an opportunity for brokers to better tailor their services to portfolio (a.k.a. more sophisticated) customers.

BrokerMar2015Next time we will look at the segment specific data drawn from the surveys.

Property Momentum On The Slide

We just updated the DFA household surveys, with data to end November, and there are some interesting transitions in play, which taken together with potential action on foreign buyers, suggests we will see property momentum easing in the next few months. This actually may be a “get out of jail card” for the RBA and provide reasons why macroprudential may not be required after all, and why interest rates may need to be cut further next year, not lifted. Today we look at our cross segment summaries. You can read about our segment definitions and survey approach here. This update will later be incorporated on the next edition of the Property Imperative Report.

We begin with the updated estimate of the number of households by DFA segment. We find that there are 6.5 million households who are property active, and 2.25 million households who are property inactive (meaning they live in rentals, with family, friends or other accommodation). Those who are inactive continues to increase, with 26% of all households in this group now.

Of those who are active, we split them out into those with owner occupied property, those with investment property, and those who invest via SMSF. This is the national picture, to end November 2014. Of those households who are property active, 68.2% are owner occupiers, 31% have investment properties, and 0.8% have property investments via SMSF.

SegmentCountsDec2014Looking at the cross segment results, we are seeing a steady decrease in those saving in order to enter the property market. This includes the Want-to-Buys and the First Timers, the latter who are to some extent active in market exploration. Up-Traders and Down-Traders are saving a little more, but the lack of momentum in savings means households are less likely to try and enter the marker later. Three factors have influenced this trend. First, low deposit interest rates, second lower disposable incomes, and third, a view that prices are so high they will never be able to enter the market.

SavingDec2014Looking at the need to borrow, we see a continual rise in the demand for loans from those expecting to transact. Only Down-Traders are less likely to borrow. The need to borrow more is a reflection of higher prices in many states, though as we highlighted yesterday, there appears to be a change in the wind with regards to property prices. Lending for investment property will continue, so we may see additional controls on this type of lending coming though in due course as part of the regulatory review, but overall demand is unlikely to grow significantly beyond this.

BorrowMoreDec2014In our surveys, we see a consistent lowering of expectations, across the segments in relation to whether prices will rise in the next 12 months. Property investors are also a little more sanguine on house price growth, though still more optimistic that owner occupiers. That said, more than half across the board still are expecting a further rise, despite stretched loan to income ratios and high benchmarks.

PriceExpectationsDec2014So, turning to question of whether households will transact in the next year, we see falls in several significant segments – Portfolio Investors, and Down-Traders are most likely to transact. In sheer volume terms, it is the Down-Traders who are most likely to keep the property ship afloat as they attempt to liquidate some of the capital locked away in their property. We see a supply/demand re-balancing ahead, and as a result, a slowing in house price growth. If investors get cold feet, prices will fall from current levels.

Transact12MonthDec2014In the next few days we will delve into our segment specific results.

Household Ratios By Segment

Yesterday DFA posted the most recent RBA household ratios showing that overall debt for households is higher than its ever been. Today we take the argument further, with detailed analysis across our segmentation, looking at loan to income ratios. The DFA segmentation positions households on a multi-factorial basis, including demographics, wealth and life-stage. The data here is the average across Australia by segment, there are significant state variations, which we won’t cover today. We see that the average is around 137. However, first time buyers have a more adverse ratio well above 200, and young families, just below 200. On the other hand, suburban families have a ratio around 100, and down traders are even lower. So my point is (once again) that averages can hide a world of differences. It is also worth noting that different household segments tend to live in different suburbs, so the net economic impact on an area will be different. One final point, the incomes are current ones (to take account of falling incomes in real terms) for our segments.

HouseholdRatiosSegmented

RBA Comments On Housing Have Impact – DFA Survey

We have updated our household surveys with the results for September. This forward-looking research revealed some significant changes in sentiment amongst households thinking of transacting, and many of these changes can be traced to recent comments made by the RBA in respect of investment housing. Our approach to household segmentation and our surveys is described in an earlier post.  Today we will discuss some of the most important recent findings, which updates the results from our Property Imperative report.

So first we look at which segments are most likely to transact in the next 12 months. The changes over time are significant, with first time buyer ever less likely to purchase whilst investors, especially portfolio investors, more likely to buy. The impact of down-traders (remember there are more than one million households in this category) are also significant.

Transact12MonthsSept2014Demand for mortgage funding sits firmly with certain segments, especially investors, first time buyers and up-traders. Note that the bulk of down-traders do not need to borrow. This goes some way to explaining why house prices are moving faster than loan growth, and why investment loans are making up a large proportion of lending, especially in Sydney.

BorrowMoreSept2014We found that first time buyers are still saving hard, though chasing ever higher prices, want-to-buys are saving less now, seeing the aspiration of owning a property evaporating fast.

SeekingtoBuySept2014We found that across the board, there was a little less certainty on house prices growth, though generally investors remain more bullish.

HousePriceRisesSept2014The want-to-buys find the biggest barrier relates to the high price of housing. No change here.

WantToBuysSept2014This barrier is also echoed in the first time buyer segment, with 50% seeing price as the main issue, the highest result in recent times.

FTBuyersSept2014Many refinancers will have now locked in at low rates, as the main reason is to reduce monthly outgoings. The proportion locking in at fixed rates is down a little.

RefinanceSept2014We found that up-traders are still active, and there was an increase in those in this segment who are motivated by the prospect of capital appreciation, which is now running ahead, just, of buying to get more space. As shown above, the proportion of up-traders ready to transact is down a little.

UptradersSept2014Down-traders continue to seek to sell and buy smaller, driven by a quest to release capital for retirement, and for increased convenience. They were slightly more likely to incorporate an investment property in their strategy. We think the impact of down-traders on the market is understated by many observers, but the continuing release of capital from larger property, and buying smaller, plus investment, aligns with the growth in investment property demand, and yet lower rates of financing elsewhere.

DownTradersSept2014Looking at investors, we see continued interest, driven by the tax-efficient nature of investment lending (a.k.a negative gearing, and SMSF investing). They remain confident about capital appreciation into the future, though less strongly than previously.

InvestorsSept2014Finally, we looked at the potential barriers to investors, and we see a significant change. We ask about a range of barriers. One related to RBA warning, which this month have reach a new, high pitch. Investors are responding, and a proportion are concerned about potential regulatory changes. We also saw a tick up in the concerns about interest rates rising in coming months.

InvestorBarriersSept2014Overall then we still see demand strong, and focused in particular segments, especially investors and down-traders. However, the RBA warning are having an impact, even before they actually do anything to intervene further in the market. We do not believe that words alone will address the underlying systemic issues, but they can have a short term impact on sentiment, and may make some prospective purchasers think again – we therefore expect to see some small slowdown in coming weeks. That said, the market remains hot, and stoked by investors, and we believe there is a case for more direct intervention by the regulators. We also expect the RBA to keep up the verbal barrage.

Where Capital Growth In Property Lives

In the Opening Statement to House of Representatives Standing Committee on Economics today, Glenn Stevens made the following points:

  • not only are funding costs low, but banks want to lend and are competing to do so more actively than they have for some years;
  • net worth per household has risen by about $120,000 over the past two years;
  • the community’s monetary assets have risen by around 13 per cent – over $180 billion – over the same period;

It is worth reflecting on the fact the main reason for the increase in net worth is a bounce in the stock market, and lift in capital values of property, thanks to rising prices. After all real income is falling for many. In addition, the average hides the differences.

We have been looking at capital growth for the average household, across the states, and between the main urban centres and the rest of rest of the state. From our surveys we have been able to assess the relative growth in the value of property, over time, by marking property to market and comparing that with its purchase price. The chart below shows the relative growth in net capital value of property since 2004 (where our surveys start). It subtracts the original purchase price from the current value, to give a theoretical capital or wealth value. It shows that in the early 2000’s there was a similar level of growth in the cities and regional centres, but that more recently it has diverged. In the past 2 years, the average capital appreciation in the urban centres was $79,000, whereas in the regional centres, it was just $18,000.

AverageCapitalGrowthAllHowever there are significant variations across the states. In Sydney, households in the past 2 years, have on average enjoyed a lift in net worth of more than $230,000 thanks to price hikes, whereas Brisbane, Adelaide, and regional areas in SA and TAS have not experienced much of an increase at all.

AverageCapitalGrowth2YearsLooking at the longer term trends, across states, the situation gets even more interesting. Of course people have bought in at different times, but we can plot the overall capital growth trend. For example, In NSW, a household who bought in Sydney in 2004 and held the property would on average be nearly $300,000 better off now. If they had bought in early 2012, though they could have nearly earnt the same gain! All the action has been in the last couple of years, in Sydney itself. There have been a more gentle lift in regional NSW. Note that I have not corrected for inflation in any of the current calculations, if I did, the regional centres in NSW would have stood still.

AverageCapitalGrowthNSWIn VIC, the situation is somewhat similar. It is worth noting that compared to NSW, the correction in 2009 was less severe.

AverageCapitalGrowthVICTurning to QLD, there has been no capital growth in either Brisbane, or the regional centres since 2010. If you were to correct for inflation, it would be going backwards.

AverageCapitalGrowthQLDIn WA, growth peaked in 2010 in Perth, with a further small peak recently, whilst in the regional centres, values are falling in real terms, before inflation. We compared Perth and Sydney recently, in more detail.

AverageCapitalGrowthWALooking at SA, growth in Adelaide is back to 2011 levels, but in the regional areas, growth is still lower than in 2010.

AverageCapitalGrowthSAIn TAS, since a peak in 2010, both Hobart and regional centres are flat, before inflation.

AverageCapitalGrowthTASFinally, we look at the remaining states. Growth in Darwin has been sustained, whilst regional NT and Canberra are flatter since 2011.

AverageCapitalGrowthOtherSo, my conclusion is simple, some households especially in Sydney and Melbourne, may be experiencing the wealth effect halo of smugness, but many households across other states and regional centres are not enjoying capital growth. Indeed, for many there has been a reduction in true value, before inflation since 2011. It is unlikely therefore that we will see a sudden surge of consumer spending activity in response to the housing boom (which is not uniform across the country as we have shown). It is really a Sydney and Melbourne boom. The RBA may be waiting for a long time if they are expecting households to start spending big.


Trading Up and Trading Down – Latest Survey Results

We continue our series on the results from our latest household surveys. Today we look at those seeking to trade up, and trade down. These are important segments, as they are both shaping the market.

Looking at up-traders first, these are households looking to sell to buy a larger property. Over one million households fall into this category. There are a number of reasons why households might do this, more space is the single most significant, then comes consideration of the investment potential of their property. Other reasons include life-style changes or job changes. From a trend perspective, the investment aspects of property have become slightly more important.

UpTradersDFAJun14Turning to down-traders, there are about 1.2m households looking to sell with the prospect of buying a smaller property, and/or an investment property. Increased convenience is the most significant reason to move, followed by the wish to release capital for retirement, and next, a switch to an investment property. Other reasons to trade down include illness, death of spouse, and unemployment. From a trend perspective, the demand to release capital for retirement is stronger, whilst unemployment is less significant now. Down traders are less bullish on future property price growth than other sectors. Only 30% of down traders think prices will rise in the next 12 months, whereas across the market 60%+ of households think prices will rise further in coming months.

DownTradersDFAJun14We can look in more detail at households over 60 years. The largest group resides in New South Wales, then Victoria.

State60+DFAJun14Within this group, we find a considerable number of down traders, most of whom are looking to down shift into a smaller place for owner occupation, although some prefer investment properties.

DownTraders60+DFAJun14We can look at where and what they want to buy. We find that the most significant demand from down traders over 60 years is for property closer to the city, and that more than half of these households prefer a unit. About 6% would consider property in a retirement village setting.

DownTradersPropertyType60+DFAJun14We find that certain factors will strongly influence over 60 down-traders considering a retirement village. Here are some of the most important. Price is the most significant factor, followed by access and facilities.

DownTradersRetirementV60+DFAJun14Next time we will look at investors.

Latest First Time Buyer Intentions

We continue updating our findings from our household surveys. Today we look at households who desire to enter the market. We highlighted yesterday that there are more people excluded from the market, but what of those who would like to buy? We start with a summary of households by type. This is the national picture, by segment:

CountChartDFAJun14Here is the data which highlights the large number of want to buys, and the relative small number of first time buyers (defined as those actively seeking). We will discuss the other segments later.

CountDFAJun14Looking at the want to buys, we see the most significant barrier is the level of house prices, in trend terms this is becoming an even more significant issue. Whilst fears of unemployment have fallen a little, concerns about future interest rate rises are up a little and costs of living continue to be a barrier for some.

WanttoBuysDFAJun14Turning to first time buyers, we see high house prices stand out as a constraining factor, whilst finding a place to buy has eased, a little.

FTBDFAJun14We found that there has been a swing towards units, and further from the city. We also see a rise in those who are unsure of what or where to purchase. This is a national picture, and there is considerable state variation which I won’t cover here.

FTBTypeDFAJun14We see some first time buyers continue to consider an investment property alternative, as a way to at least get on the property ladder, even if its in an area in which they do not wish to reside. They are most likely to consider an investment property around edge of the city. Even here they may well be competing with overseas investors!

FTBLocaleDFAJun14Finally, today, we look at which segments are most likely to use a mortgage broker. First time buyers are a little more likely, and well over 50 per cent would consider a broker.

BrokersDFAJun14Next time we will look at some of the other segments.

Property Inactive Households Rise Again, As Market Outlook Slows

Today we start a series on our updated household surveys, which will in due course feed into our next edition of the Property Imperative, due be released later in the year. The current edition, is still available, but there are some significant changes in household intentions since then.

We run our surveys continually, and so incorporate new data each week. The results we will discuss relate to data up to 13th June. We start by looking at the mix of households who are property active and inactive. We define property active households as those who either own, or intend to own a property to live in, or are investing in property, or both. We find that 25.88% of households are inactive. These households will rent, live with family or friends, or have other housing arrangements.

InactivePieDFAJun14Looking at the inactive status trend, we see that more households than ever are excluded from the property market.

InactiveDFAJun14We also see some state variations, with the highest proportion of inactive households founds in Tasmania and South Australia, whilst households in Western Australia, then New South Wales and Victoria have a lower mix of those inactive. That said, the absolute numbers are still increasing in these states too. This is the continuation of a long term trend.

StateInactiveDFAJun14So, next we turn to the active households and begin to look at the more detailed data. We start by looking across our segments, later we will dive more deeply into specific segmental analysis. We start with saving activity trends over time. We see that first time buyers (defined as those seeking to buy for the first time) are still saving hard, but other segments are less inclined or less able to save to purchase a property. Want to buy households (defined as those who would like to buy, but who cannot), are less likely to save than in 2013.

Saving-DFAJun14 Looking at transaction intentions over the next 12 months, we see a significant fall in those investors expecting to enter the market. First time buyers are still being squeezed out, and those seeking to refinance an existing loan are now slightly less likely to transact. Down traders are still active (these are households seeking to sell to buy a smaller property, to release capital, or other factors), though we detect a slowing here too. Therefore we predict that demand for property will decline from recent levels in coming months. This is especially the case in New South Wales and Victoria.

Transact12MonthsDFAJun14 Looking next at borrowing intentions, we see that property investors and up traders are most likely to seeking funding. First time buyers are needing to borrow more also, though as highlighted above they are less likely to transact. Therefore we expect to see some ongoing demand for investment housing funding, but at lower levels than those we saw last year. Funding for owner occupation will likely grow more slowly.

BorrowMore-DFAJun14

Finally, today we look at house price growth expectations. Overall expectation are still quite bullish, but we see a general small fall in the households who believe that house prices will rise in the next 12 months. Down traders are the least bullish.

PrceExpectations12MonthsDFAJun14So our initial findings highlight that we expect momentum in the property market to ease in coming months, even before any interest rate rise. In fact we think that the fall in momentum may postpone potential rate rises, and may begin to turn expectations towards a rate cut, especially if the proposed budget cuts are passed, and the international political scene gets more unstable.

Next time we will start to look at segment specific factors, as each segment exists in its own micro market, and dynamics are quite different.