It seems that eventually mortgage rates will rise in Australia, as global forces exert external pressure on the RBA, and as the RBA tries to normalise rates (at say 2% higher than today). Timing is, of course, not certain.
But it is worth considering the potential impact. While our mortgage stress analysis takes a cash flow view of household finances, our modelling can look at the problem another way.
One algorithm we have developed is a rate sensitivity calculation, which takes a household’s mortgage outstanding, at current rates, and increments the interest rate to the point where household affordability “breaks”. We use data from our household survey to drive the analysis.

We have just run this analysis with data to end October 2017. We will explore the top line results, and then drill into some NSW specific analysis.
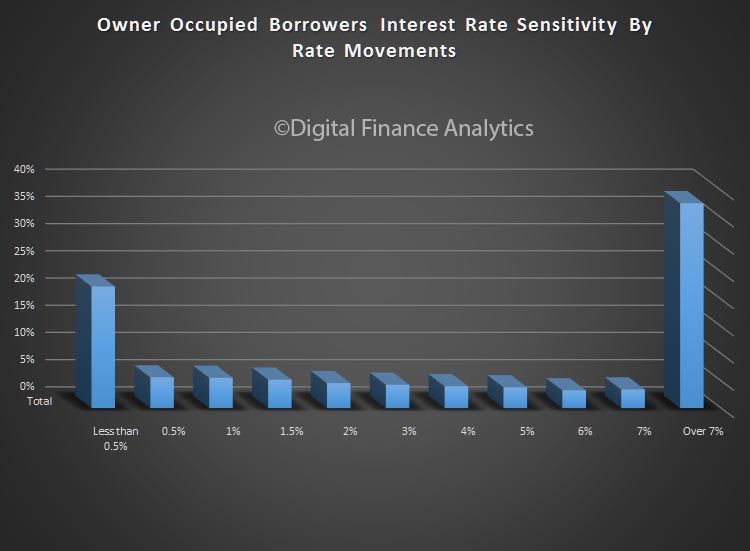
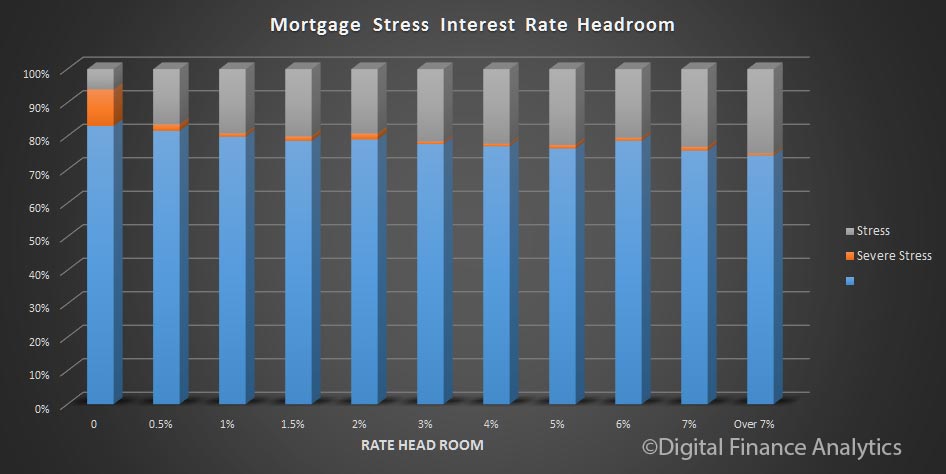
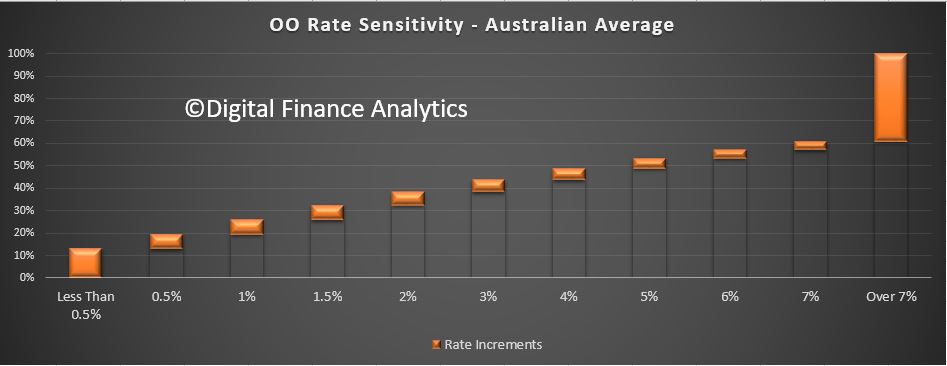
So we start with the average across the country. We find that around 10% of households would run into affordability issues with less a 0.5% hike in mortgage rates, and around another 8% would be hit if rates rose 0.5%, and a larger number would be added to the “in pain” pile, giving us a total of around 25% of households across the country in difficulty if rates went 1% higher. [Note that the calculation does not phase the rate increases in]. Around 40% of households would be fine even if rates when more than 7% higher.
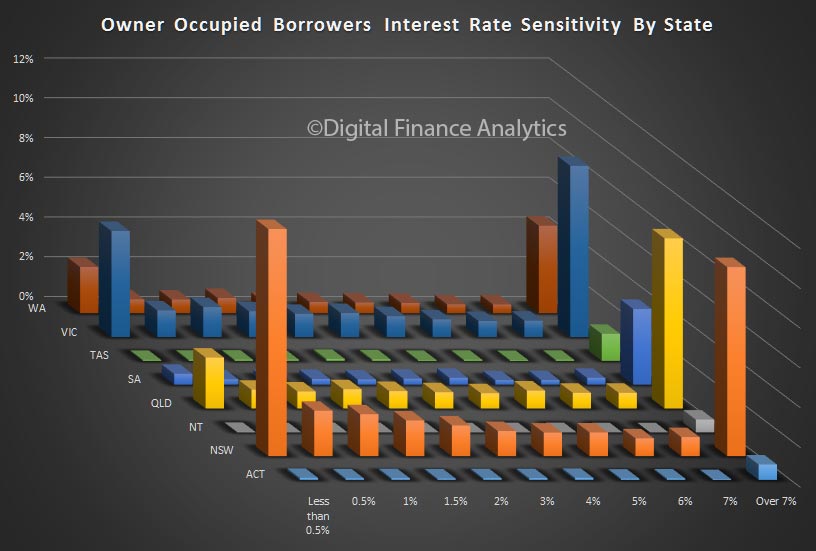
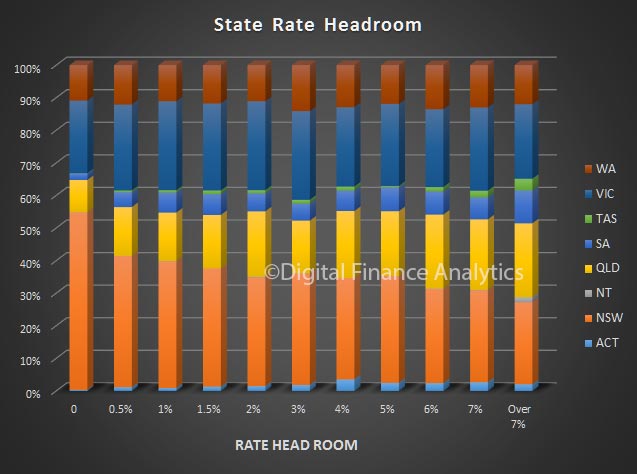
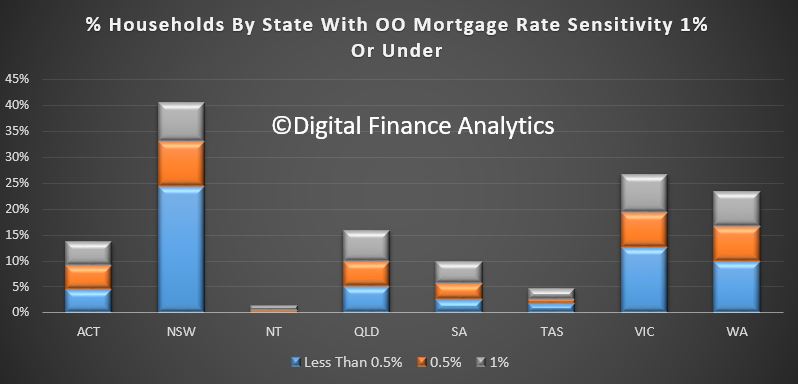
 We can run a similar calculation at a state level. The chart below shows the relative impact on less than 0.5%, 0.5% and 1% rate rises, giving a cumulative total. We find that around 40% of households in NSW would have a problem, compared with 27% in VIC and 24% in WA.
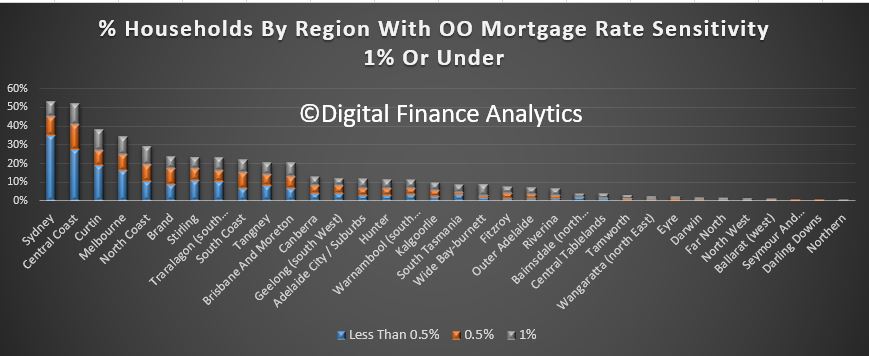
 We can also take the analysis further, to a regional view across the states. This reveals that the worst impacted areas would be, in order, Greater Sydney, Central Coast, Curtain and Greater Melbourne. These are all areas where home prices relative to income are significantly extended, thus households are highly leveraged.
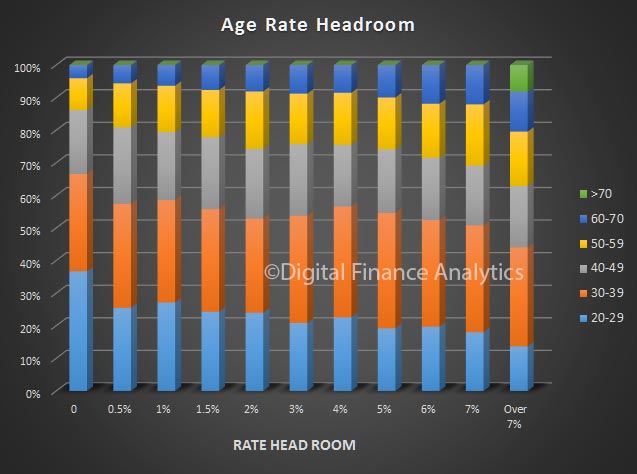
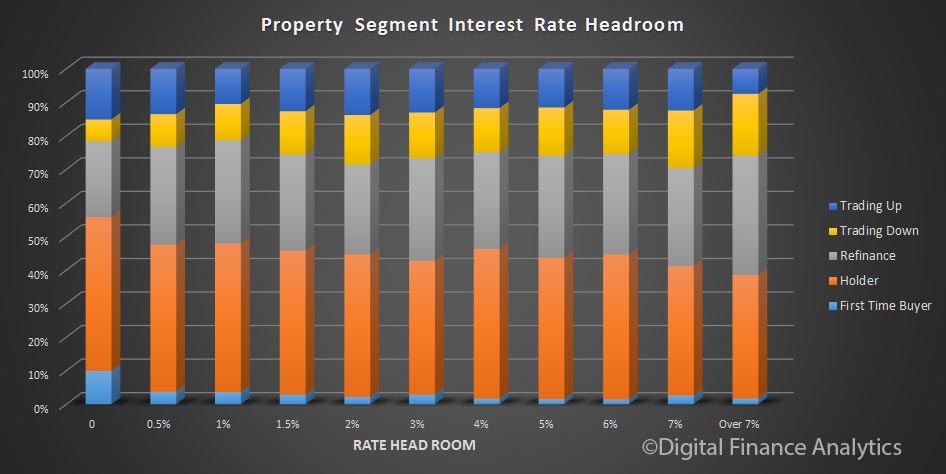
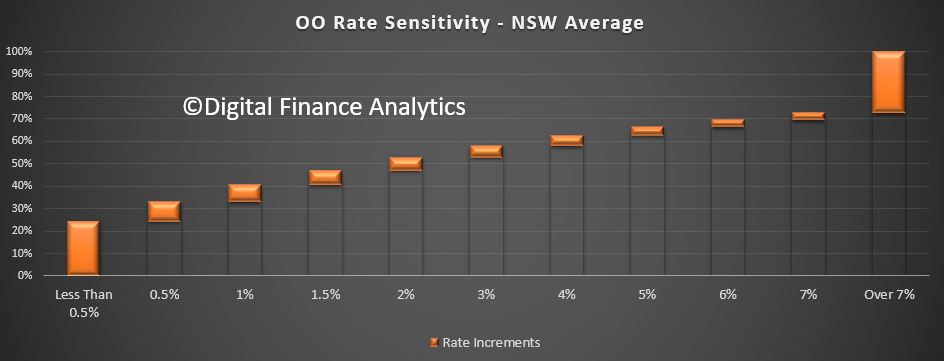
 Now lets look further at NSW. Here is the NSW footprint, including all the rate increase bands. More than 30% are protected even if rates are 7% or more higher.
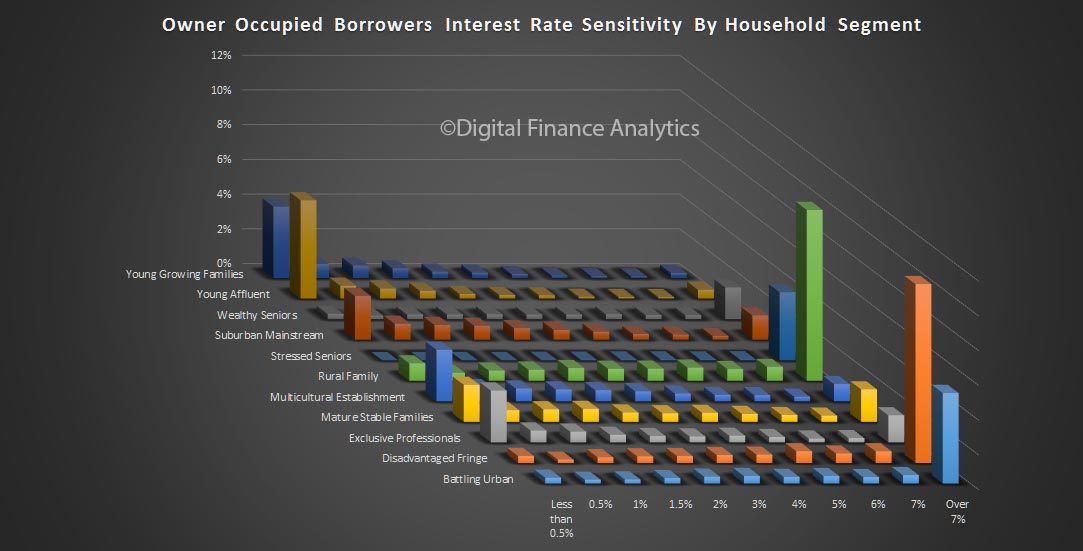
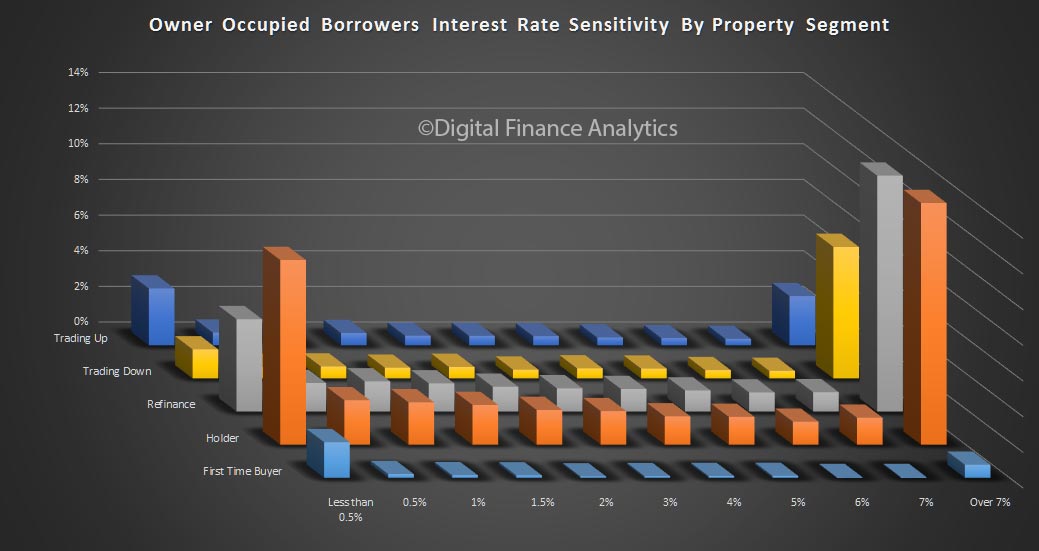
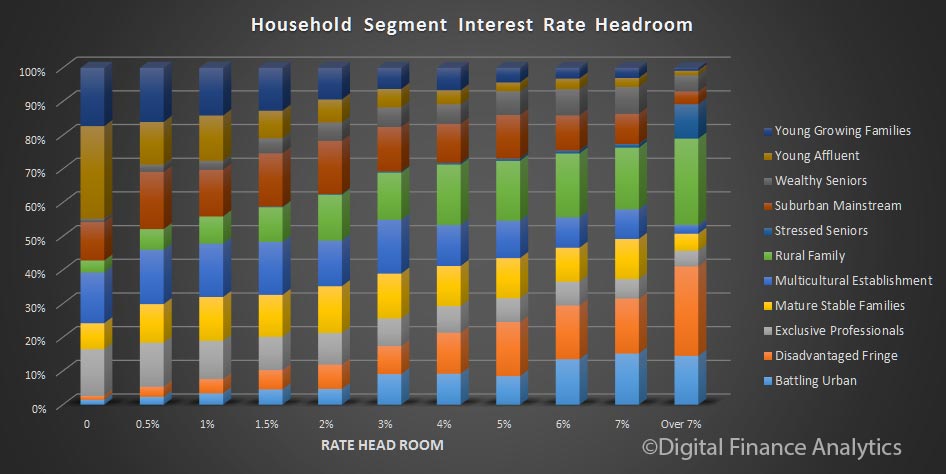
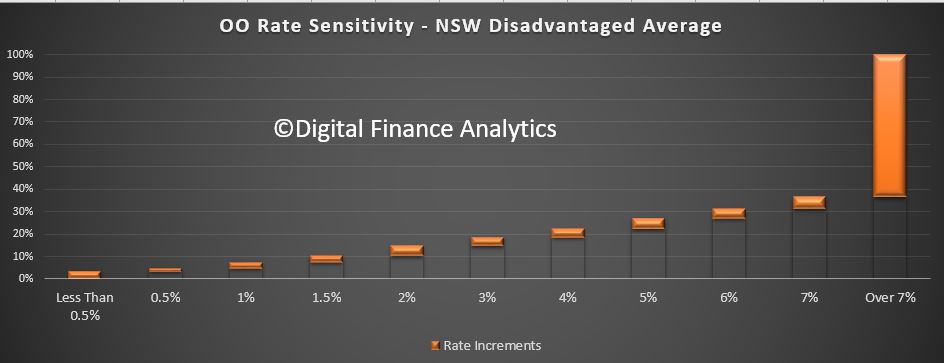
 We can look at the type of households, using our segmentation modelling. Many will expect households in the disadvantaged areas of Greater Sydney to be worst hit by rate rises. This however is not the case, simply because they have smaller mortgages, lenders have lent cautiously, and because these households are use to handling difficult cash flows. Despite this, around 8% of households would be hit hard by a 1% rise in mortgage rates, enough to be a problem, but probably a lower proportion than would be expected.
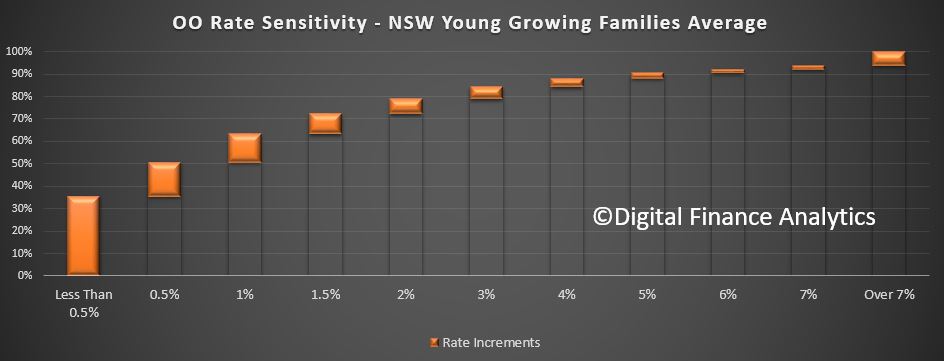
 However, young growing families have more of an issue (this will include a number of first time buyers), with around 35% in difficulty in the case of just a small rise, and more than 60% at risk at 1% higher than today. Loans are relatively large compared with incomes (which are not rising faster than cpi).
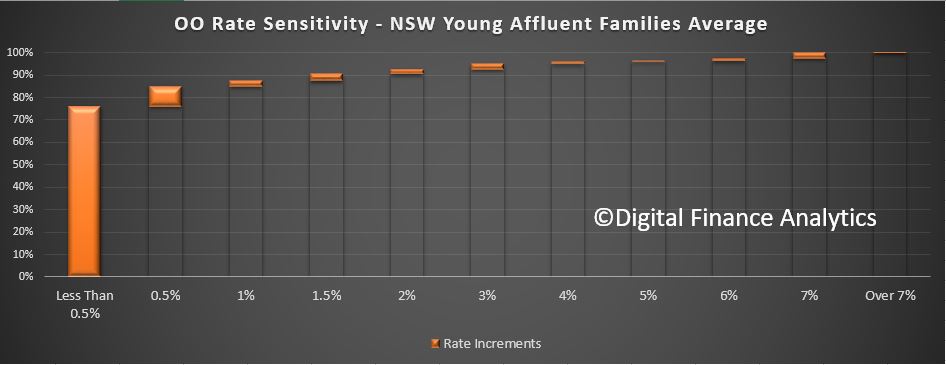
 But the segment with the most significant exposure is the Young Affluent household group. These households, which also includes some first time buyers, have larger incomes, but also larger mortgages, and are leveraged significantly, such that more than 70% of this group would struggle with a small rise. More than 85% would have issues with a 1% rate rise.
Many of these households have bought new high-rise apartments in the inner suburban ring, for example around Bondi, Wolli Creek and Hurstville.
 So, in a rate increase scenario, we think specific households and locations will be disproportionately hit. The banks should be incorporating this type of analysis in their risk scenario models and underwriting standards. We think some are still lending too generously. The ~7.25 rate floor is not enough to protect borrowers or the bank.