Population Now at 25.4 Million, with 62.5% Growth From Migration

Australia’s population grew by 1.5 per cent during the year ending 30 June 2019, according to the latest figures released by the Australian Bureau of Statistics (ABS).

ABS Demography Director Beidar Cho said: “The population at 30 June 2019 was 25.4 million people, following an annual increase of 381,600 people.”

Natural increase accounted for 37.5 per cent of annual population growth, while net overseas migration accounted for the remaining 62.5 per cent.

There were 303,900 births and 160,600 deaths registered in Australia during the year ending 30 June 2019. Natural increase during this period was 143,300 people, an increase of 0.5 per cent from the previous year.

There were 536,000 overseas migration arrivals and 297,700 departures during the year ending 30 June 2019, resulting in net overseas migration of 238,300 people. Net overseas migration did not change compared to the previous year.

Annual population change

The preliminary estimated resident population of Australia at 30 June 2019 was 25,364,300 people. This is an increase of 381,600 people since 30 June 2018 and 75,600 people since 31 March 2019.

The annual population growth rate for the year ended 30 June 2019 was 1.5%.

Annual population growth rate (a)(b), Australia

Graph: Annual population growth rate (a)(b), Australia

(a) Annual growth rate calculated at the end of each quarter.
(b) All data to 30 June 2016 is final. Estimates thereafter are preliminary or revised.


Components of population change

The growth of Australia’s population is comprised of natural increase (births minus deaths) and net overseas migration (NOM).

The contribution to population growth for the year ended 30 June 2019 was higher from NOM (62.5%) than from natural increase (37.5%).

Components of annual population growth (a), Australia

Graph: Components of annual population growth (a), Australia

(a) Annual components calculated at the end of each quarter.

Natural increase

The preliminary estimate of natural increase for the year ended 30 June 2019 was 143,300 people, an increase of 0.5%, or 700 people, compared with natural increase for the year ended 30 June 2018 (142,600 people).

Births

The preliminary estimate of births for the year ended 30 June 2019 (303,900 births) was lower by 700 births from the year ended 30 June 2018 (304,600 births).

Deaths

The preliminary estimate of deaths for the year ended 30 June 2019 (160,600 deaths) was lower by 1,400 deaths from the year ended 30 June 2018 (162,000 deaths).


Net overseas migration

For the year ended 30 June 2019, Australia’s preliminary net overseas migration estimate was 238,300 people. This was 100 people higher than the net overseas migration estimated for the year ended 30 June 2018 (238,200 people).

NOM arrivals increased by 1.6% (8,500 people) between the years ended 30 June 2018 (527,500 people) and 30 June 2019 (536,000 people).

NOM departures increased by 2.9% (8,400 people) between the years ended 30 June 2018 (289,300 people) and 30 June 2019 (297,700 people).

The preliminary NOM estimate for the June quarter 2019 (34,900 people) was 26.7% (12,700 people) lower than the June quarter 2018 (47,600 people).


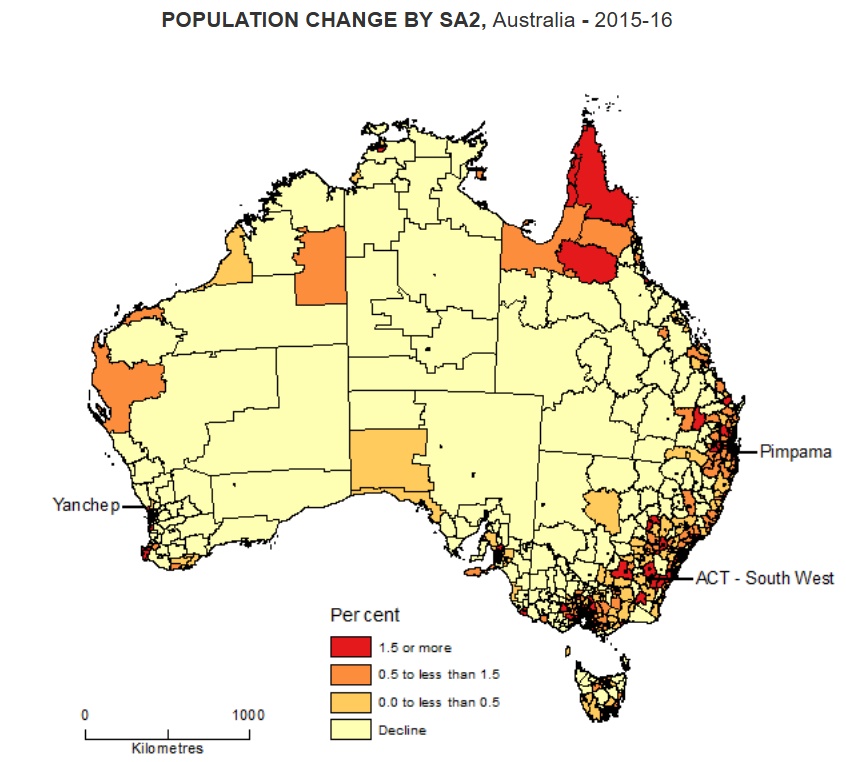
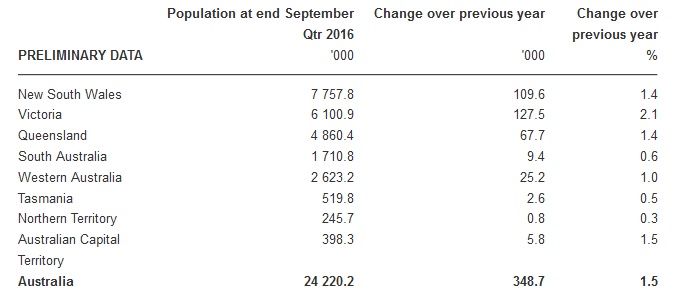
States and territories

At the state and territory level, population growth has three main components: natural increase, net overseas migration and net interstate migration (NIM).

Although majority of states and territories experienced positive population growth in the year ended 30 June 2019, the proportion that each of these components contributed to population growth varied between the states and territories.

For the year ended 30 June 2019, natural increase was the major contributor to population change in Western Australia and the Australian Capital Territory. Net interstate migration loss was the largest component of population change in the Northern Territory. NOM was the major contributor to population change in New South Wales, Victoria, Queensland, South Australia and Tasmania.

NIM gains occurred in Victoria, Queensland and Tasmania. All other states and territories recorded net interstate migration losses.


Natural increase

Births

Compared with the previous year, the number of births registered for the year ended 30 June 2019 decreased in half of the states and territories.

The largest percentage decrease was in Western Australia at 2.7%. This was followed by Victoria (2.2%), The Northern Territory (1.9%) and Queensland (0.5%).

The largest increase was in Tasmania at 4.0%, followed by the Australian Capital Territory (2.1%), New South Wales (1.8%) and South Australia (1.6%).

For more information, see table 10.

Deaths

Compared with the previous year, the number of deaths registered for the year ended 30 June 2019 decreased in half of the states and territories.

Tasmania had the largest percentage decrease at 5.2%. This was followed by the Australian Capital Territory (4.7%), Queensland (2.7%) and New South Wales (1.0%).

Increases occurred in Western Australia at 2.1% followed by the Northern Territory (1.7%) and Victoria (0.1%). South Australia had no change.

For more information, see table 11.

Preliminary estimates of births and deaths are subject to fluctuations caused by lags or accumulations in the reporting of birth and death registrations (for more information see Explanatory Notes 10-11).


Net overseas migration

Compared with the previous year, NOM decreased the most in New South Wales (4,800 people), followed by Victoria (3,700 people), the Australian Capital Territory (1,500 people) and the Northern Territory (100 people).

The largest increase was in Queensland (5,200 people), followed by Western Australia (3,900 people), South Australia (1,100 people) and Tasmania (10 people). For more information, see table 13.

NOM arrivals

The number of NOM arrivals for the year ended 30 June 2019 increased in Tasmania (9.1%), Queensland (5.5%), South Australia (5.1%), Western Australia (3.9%), Victoria (1.8%) and the Northern Territory (1.2%).

The largest percentage decrease in NOM arrivals was in the Australian Capital Territory (11.4%), followed by New South Wales (0.7%). For more information, see table 13.

NOM departures

Compared with the previous year, the number of NOM departures for the year ended 30 June 2019 increased in Tasmania (19.7%), Victoria (9.0%), the Northern Territory (3.8%), the Australian Capital Territory (3.6%), New South Wales (3.4%) and South Australia (1.5%).

The largest percentage decrease was recorded in Western Australia at 6.7%, followed by Queensland (1.0%). For more information, see table 13.


Net interstate migration

In the year ended 30 June 2019, Victoria, Queensland and Tasmania had net interstate migration gains. Queensland had the highest net gain with 22,800 people. This was followed by Victoria (12,200 people) and Tasmania (2,000 people). Net losses from interstate migration were in New South Wales (22,100 people), Western Australia (6,500), the Northern Territory (4,400 people), South Australia (4,000 people) and the Australian Capital Territory (200 people). For more information.

Annual interstate migration – arrivals, departures and net

FactCheck: is Australia’s population the ‘highest growing in the world’?

From The Conversation.

One Nation leader Pauline Hanson has proposed a plebiscite be held in tandem with the next federal election to allow voters to have “a say in the level of migration coming into Australia”.

Hanson has suggested cutting Australia’s Migration Programme cap from the current 190,000 people per year to around 75,000-100,000 per year.

On Sky News, Hanson said Australia is “the highest growing country in the world”.

The senator added that at 1.6%, Australia’s population growth was “double [that of] a lot of other countries”.

Are those statements correct?

Checking the source

In response to The Conversation’s request for sources and comment, a spokesperson for Pauline Hanson said the senator “talks about population growth in the context of our high level of immigration because in recent years, immigration has accounted for around 60% of Australia’s population growth”.

The spokesperson added:

Australian Bureau of Statistics migration data for 2015-16 show that Australians born overseas represent 28% of the population, far higher than comparable countries like Canada (22%), UK (13%) or the US (14%).

World Bank data for 2017 show that Australia’s population growth was 1.6%, much higher than comparable countries with immigration programs like Canada (1.2%), the UK (0.6%) and the US (0.7%).


Verdict

One Nation leader Pauline Hanson was correct to say Australia’s population grew by 1.6% in the year to June 2017. But she was incorrect to say Australia is “the highest growing country in the world”.

According to the most accurate international data, the country with the fastest growing population is Oman, on the Arabian Peninsula.

Senator Hanson said Australia’s 1.6% population growth was “double than a lot of other countries”. It is fair to say that Australia’s population growth rate is double that of many other countries, including the United States (0.7%) and United Kingdom (0.7%), for example.

Since Hanson’s statement, Australia’s population growth rate for the period ending June 2017 has been revised upwards to 1.7%. But Hanson’s number was correct at the time of her statement, and the revision doesn’t change the outcome of this FactCheck.

In terms of the 35 countries in the Organisation for Economic Cooperation and Development (OECD), Luxemberg was the fastest growing country in 2016, with Australia coming in fifth.

Caution must be used when making international population comparisons. It’s important to put the growth rates in the context of the total size, density and demographic makeup of the population, and the economic stage of the country.


How do we calculate population growth?

A country’s population growth, or decline, is determined by the change in the estimated number of residents. Those changes include the number of births and deaths (known as natural increase), and net overseas migration.

In Australia, both temporary and permanent overseas migrants are included in the calculation of population size.

According to Australian Bureau of Statistics data, Australia’s population grew by 1.6% in the year to June 2017 – as Senator Hanson said.

Since Hanson’s statement, Australia’s population growth rate for the period ending June 2017 has been revised upwards to 1.7%. But as said in the verdict, Hanson’s number was correct at the time of her statement, and the revision doesn’t change any of the other outcomes of this FactCheck.

That’s an increase of 407,000 people in a population of 24.6 million.

All states and territories saw positive population growth in the year to June 2017, with Victoria recording the fastest growth rate (2.4%), and South Australia recording the slowest growth rate (0.6%).


Read more: FactCheck: is South Australia’s youth population rising or falling?


Is Australia’s population the ‘highest growing in the world’?

No, it’s not.

There are different ways of reporting population data.

Population projections are statements about future populations based on certain assumptions regarding the future of births, deaths and migration.

Population estimates are statistics based on data from a population for a previous time period. Population estimates provide a more accurate representation of actual dynamics.

World Bank data for 2016 (based on population estimates) provide us with the most accurate international comparison.

According to those data, Australia’s growth rate – 1.5% for 2016 – placed it at 86th in the world. The top 10 ranked countries grew by between 3-5%.

How does Australia’s growth compare to other OECD countries?

Comparison of Australia’s average annual population growth with other OECD countries shows Australia’s rate of population growth is among the highest in the OECD, but not the highest.

This is true whether we look at annual averages for five year bands between 1990 and 2015, or single year data.

Looking again at the World Bank data, Australia’s rate of population growth for 2016, at 1.5%, was double that of many other OECD countries, including the United Kingdom (0.7%) and United States (0.7%).

Permanent vs temporary migration levels

Hanson has proposed a national vote on what she describes as Australia’s “run away rates of immigration”.

The senator has suggested reducing Australia’s Migration Programme cap from the current level of 190,000 people per year to 75-100,000 people per year. The expected intake of 190,000 permanent migrants was not met over the last few years. Permanent migration for 2017-18 has dropped to 162,400 people, due to changes in vetting processes.

The greatest contribution to the growth of the Australian population (63%) currently comes from overseas migration, as Hanson’s office noted in their response to The Conversation.

The origin countries of migrants are becoming more diverse, posing socioeconomic benefits and infrastructure challenges for Australia.

Sometimes people confuse net overseas migration (the total of all people moving in and out of Australia in a certain time frame), with permanent migration (the number of people who come to Australia to live). They are not the same thing.

Net overseas migration includes temporary migration. And net overseas migration is included in population data. This means our population growth reflects our permanent population, plus more.

Temporary migrants are a major contributor to population growth in Australia – in particular, international students.

In the most recent data (2014-15), net temporary migrants numbered just under 132,000, a figure that included just over 77,000 net temporary students.

The international student market is Australia’s third largest export.

Looking back at Australia’s population growth

Population changes track the history of the nation. This includes events like post-war rebuilding – including the baby boom and resettlement of displaced European nationals – to subsequent fluctuations in birth rates, and net overseas migration.

We can see these events reflected in the rates of growth from 1945 to the present.

The rate of population growth in Australia increased markedly in 2007, before peaking at 2.1% in 2009 (after the height of the global financial crisis, in which the Australian economy fared better than many others).

Since 2009, annual population growth has bounced around between a low of 1.4% and a high of 1.8%.

The longer term average for population growth rates since 1947 is 1.6% (the same as it is currently).

Interpreting population numbers

It’s worth remembering that a higher growth rate per annum coming from a lower population base is usually still lower growth in terms of actual numbers of people, when compared to a lower growth rate on a higher population base.

There can also be significant fluctuations in population growth rates from year to year – so we need to use caution when making assessments based on changes in annual rates.

Economic factors, government policies, and special events are just some of the things that can influence year-on-year population movements.

Other factors we should consider when making international comparisons include the:

  • total size of the population
  • population density
  • demographic composition, or age distribution, of the population, and
  • the economic stage of the country (for example, post industrialisation or otherwise).

Any changes to the migration program should be considered alongside the best available research. – Liz Allen


Blind review

The FactCheck is fair and correct.

The statement about Australia’s population growth rate over the year to June 30, 2017, is correct. The preliminary growth rate published by the Australian Bureau of Statistics at the time of Senator Hanson’s statement was 1.60%; the rate was subsequently revised to 1.68%.

It is also true that many developed countries have lower population growth rates than Australia, but some have higher rates. According to United Nations Population Division population estimates, Oman had the fastest growing population between 2014 and 2015 (the latest data available).

With regards to misinterpretations of net overseas migration, it should also be stated that some people think this refers to the number of people migrating to Australia. It is actually immigration minus emigration – the difference between the number arriving and the number leaving. – Tom Wilson

Author: Liz Allen Demographer, ANU Centre for Social Research and Methods, Australian National University; Reviewer
Tom Wilson Principal Research Fellow, Charles Darwin University


Sydney Population Now Over 5m

Sydney’s population has officially reached 5 million, according to figures released today by the Australian Bureau of Statistics (ABS).  This is one key reason why demand for property is so strong here.

ABS Director of Demography, Beidar Cho, said that at 30 June 2016, 5,005,400 people lived in the NSW capital – up 82,800 from the previous year.

“It took Sydney almost 30 years, from 1971 to 2000, to grow from 3 million to 4 million people, but only half that time to reach its next million,” she said.

Today’s figures show that Melbourne is Australia’s fastest growing capital city. Its population grew by 2.4 per cent in 2015-16, ahead of Brisbane (1.8 per cent) and Sydney (1.7 per cent). Australia’s slowest growing capital city was Adelaide, at below 1 per cent.

The fastest growing area in Australia in 2015-16 was ACT – South West, which grew by 38 per cent. This area includes the recently developed suburbs of Wright and Coombs. Other areas experiencing fast growth included Pimpama (35 per cent) on the Gold Coast, the coastal area of Yanchep (29 per cent) in Perth’s north and Cobbitty – Leppington (28 per cent) in Sydney’s outer south-west.

  • Australia’s estimated resident population (ERP) reached 24.1 million at 30 June 2016, increasing by 337,800 people or 1.4% since 30 June 2015. This growth rate was unchanged from 2014-15.
  • All states and territories experienced population growth between 2015 and 2016. Victoria had the greatest growth (123,100 people), followed by New South Wales (105,600) and Queensland (64,700).
  • Victoria also grew fastest, increasing by 2.1%, followed by New South Wales and Queensland (both 1.4%), the Australian Capital Territory (1.3%) and Western Australia (1.0%). The Northern Territory had the slowest growth (0.2%), followed by South Australia and Tasmania (both 0.5%).
  • The combined population of Greater Capital Cities increased by 276,500 people (1.7%) between 30 June 2015 and 30 June 2016, accounting for 82% of the country’s total population growth.
  • Melbourne had the largest growth of all Greater Capital Cities (107,800), followed by Sydney (82,800), Brisbane (41,100) and Perth (27,400).
  • Melbourne also had the fastest growth (2.4%), ahead of Brisbane (1.8%) and Sydney (1.7%).
  • Sydney’s population reached 5 million in 2015-16. While it took almost 30 years (1971 to 2000) for Sydney’s population to increase from 3 million to 4 million people, it took only another 16 years to reach its next million.

Population Growth Fuels Property Demand

Australia is experiencing its fastest growth in Net Overseas Migration (NOM) in four years, according to the latest figures released by the Australian Bureau of Statistics (ABS).

These new arrivals need somewhere to live, another factor in the elevated demand for property!

ABS Demography Director Beidar Cho said that in the year ending 30 September 2016, NOM increased by almost 9 per cent, adding 193,200 people to the Australian population.

“This is in contrast to the declines of NOM of over 10 per cent experienced during 2014 and early 2015,” said Ms Cho. “But the current growth of NOM is well short of the record during 2009, when over 300,000 people were added to the population.”

Compared with last year, Queensland had the fastest growing NOM, increasing by 19 per cent. New South Wales and Victoria remain popular destinations for migrants, growing by 11 per cent and 13 per cent respectively. Tasmania was the only other state or territory to see an increase of NOM compared to last year, increasing by 9 per cent.

Overall, Australia’s population grew by 348,700 people to reach 24.2 million by the end of September 2016.

Net overseas migration added 193,200 people to the population, and accounted for 55 per cent of Australia’s total population growth.

Natural increase contributed 155,500 additional people to Australia’s population, made up of 315,000 births and 159,500 deaths.

Over the year, net overseas migration was the major contributor to population change in New South Wales, Victoria and South Australia, whilst natural increase was the major contributor in all other states and territories.

Australian Population Now 23.3 Million

The ABS today published its latest population data, to December 2013. The preliminary estimated resident population (ERP) of Australia at 31 December 2013 was 23,319,400 people. This reflects an increase of 396,200 people since 31 December 2012 and 85,100 people since 30 September 2013. The preliminary estimates of natural increase recorded for the year ended 31 December 2013 (160,400 people) was 0.9%, or 1,400 people lower than the natural increase recorded for the year ended 31 December 2012 (161,800 people). The preliminary estimates of net overseas migration (NOM) recorded for the year ended 31 December 2013 (235,800 people) was 2.2%, or 5,400 people lower than the net overseas migration recorded for the year ended 31 December 2012 (241,200 people).

PopulationAustralia’s population grew by 1.7% during the year ended 31 December 2013.  Natural increase and NOM contributed 40% and 60% respectively to total population growth for the year ended 31 December 2013.  All states and territories recorded positive population growth in the year ended 31 December 2013. Western Australia continued to record the fastest growth rate of all states and territories at 2.9%. Tasmania recorded the slowest growth rate at 0.3%.

Population-DriversOverseas migration continues to be a major driver to population growth, contributing nearly twice that of local births. However, it is down 2.2% from the year before. We have updated our housing demand modelling accordingly.