We have updated our Core Market Models and scenarios with the latest household financial stress data to the end of September 2020.
We discussed this in our live show last night:
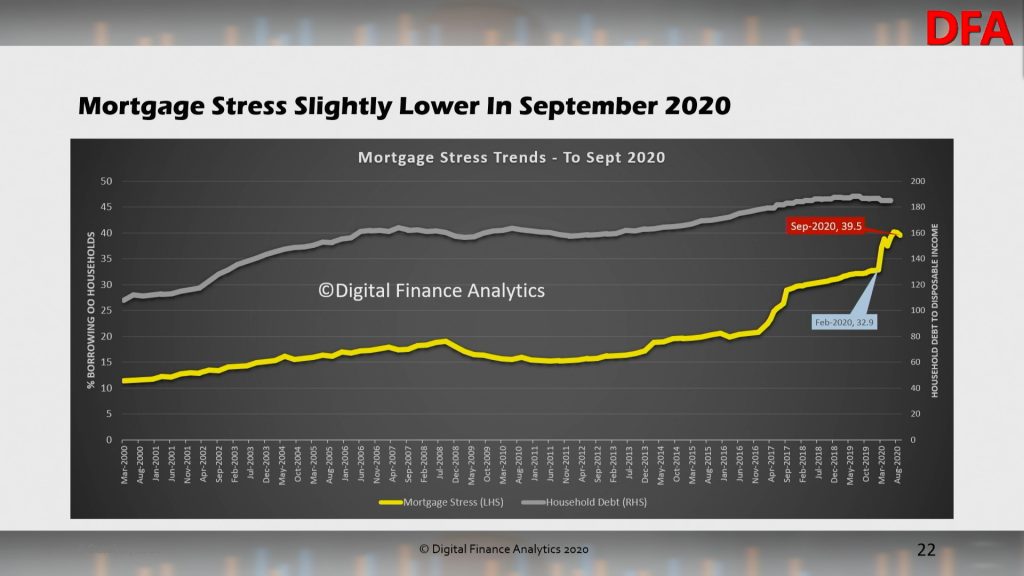
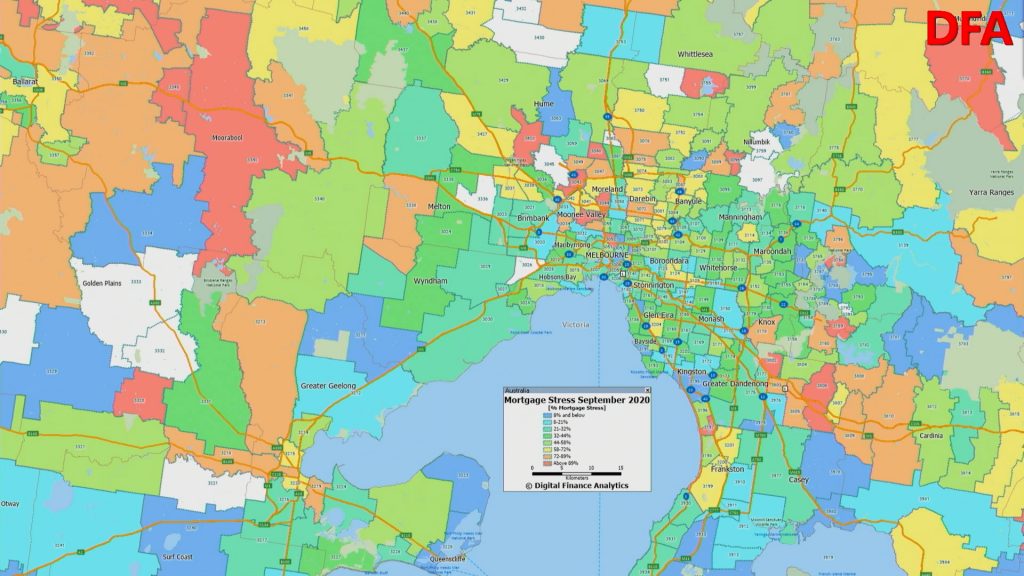
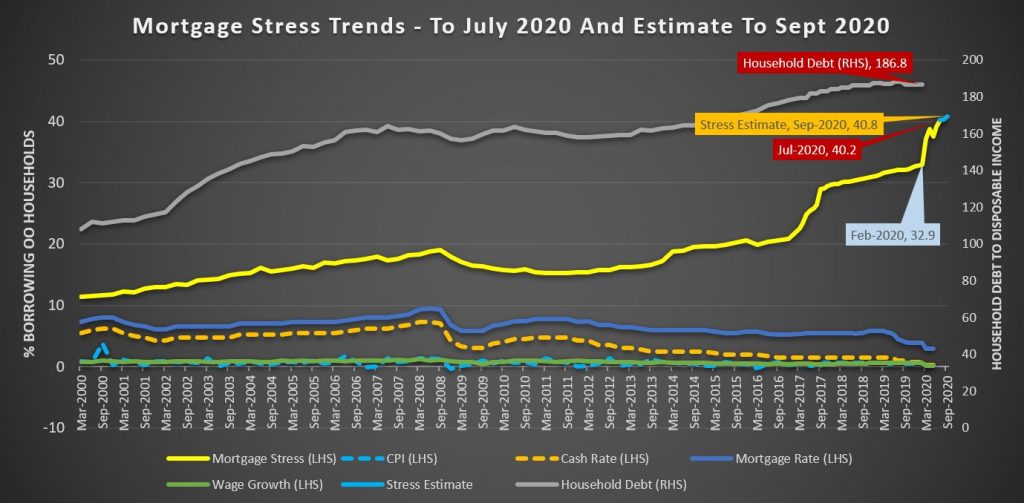
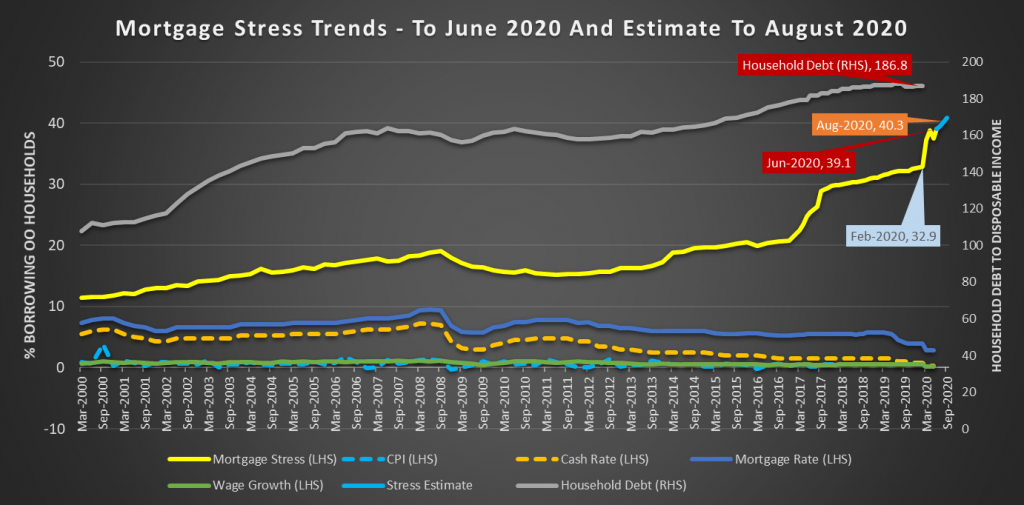
Overall mortgage stress eased back to below 40% of borrowing households at 39.5%. But it remains very high. This is measured in net cashflow terms.
The RBA household debt to income ratio eased back as loans are paid down.
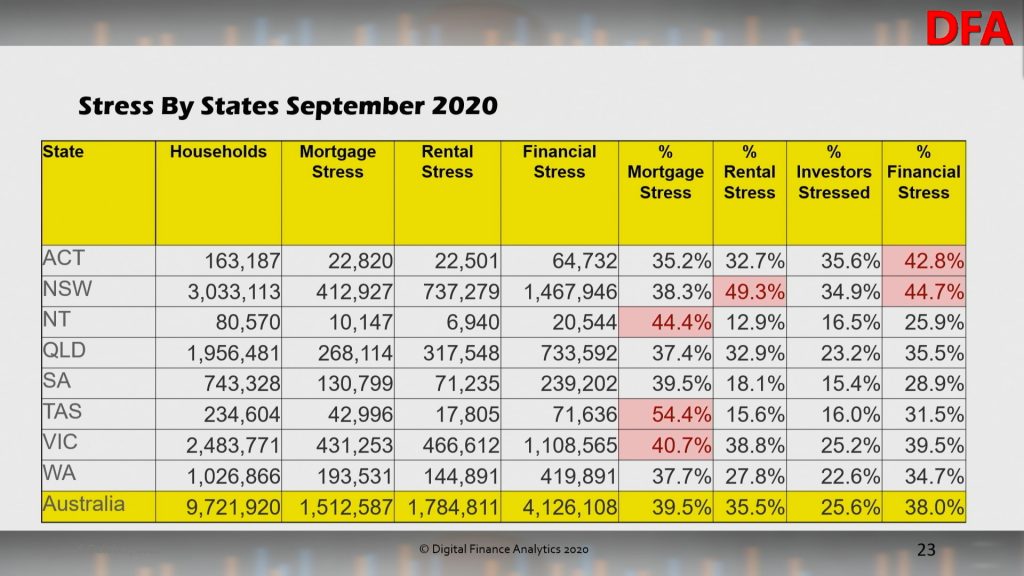
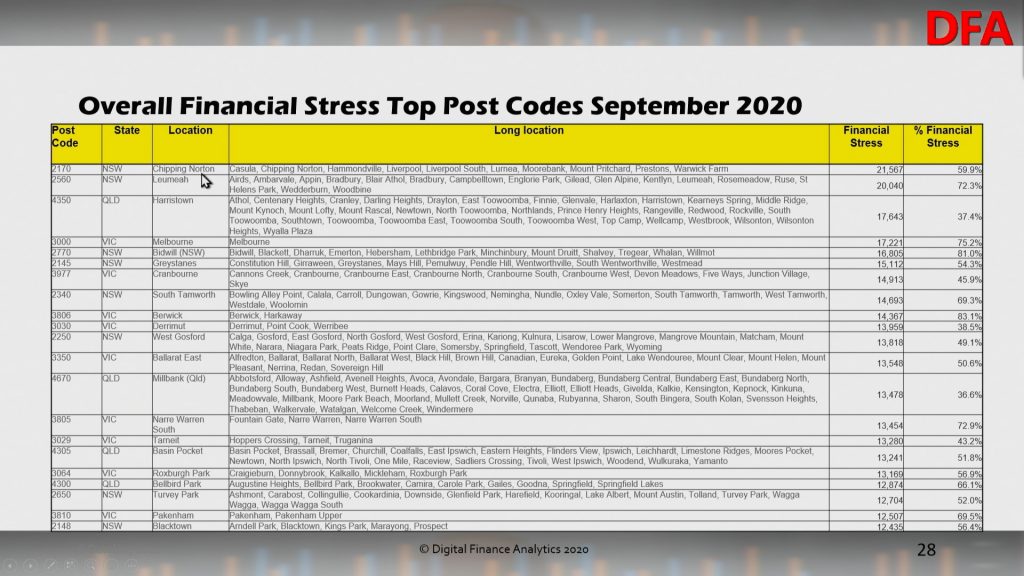
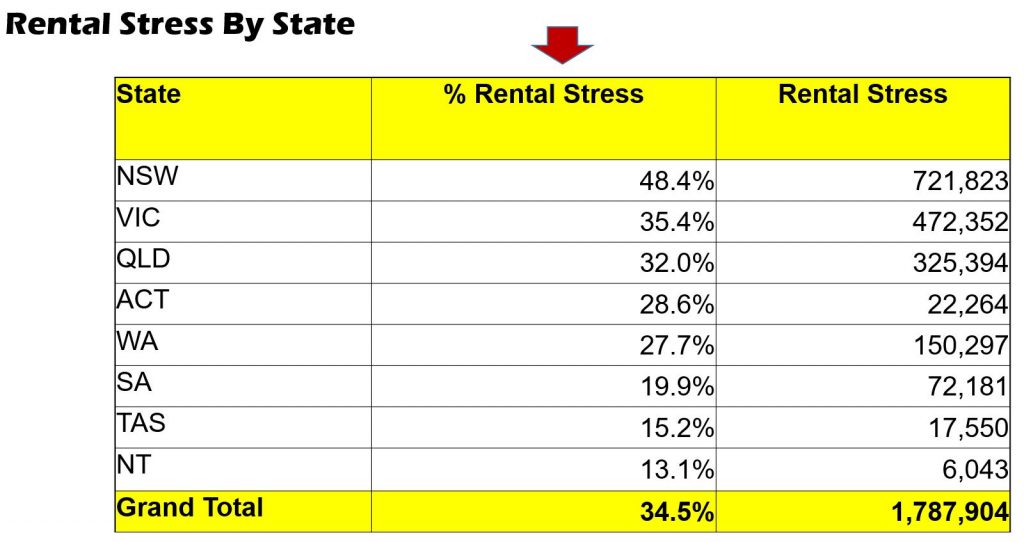
Across the states, mortgage stress is highest (in percentage terms) in Tasmania, NT and Victoria. Rental stress is highest in New South Wales. Overall financial stress (including mortgage, rental and investor stress) is highest in ACT and NSW.
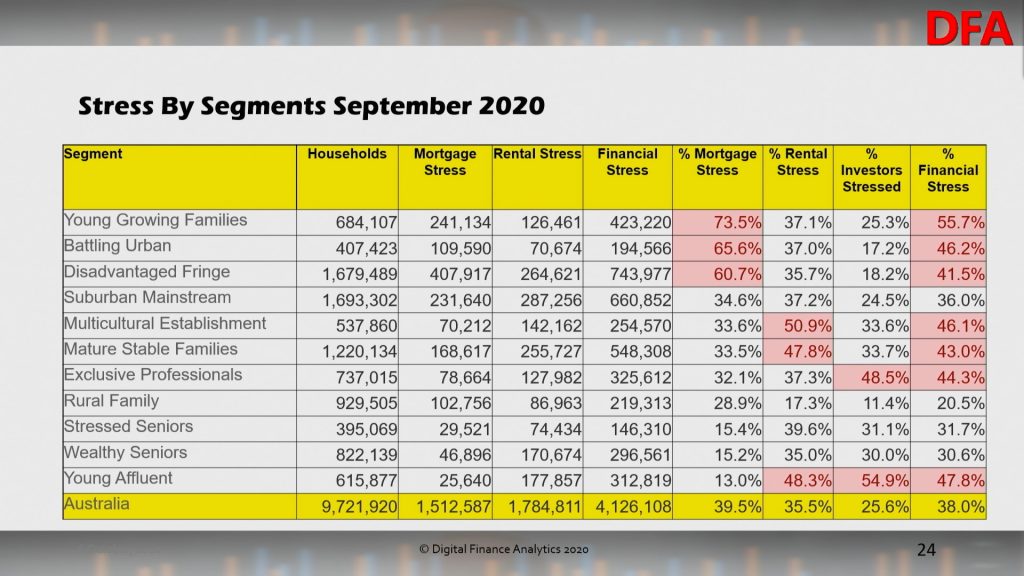
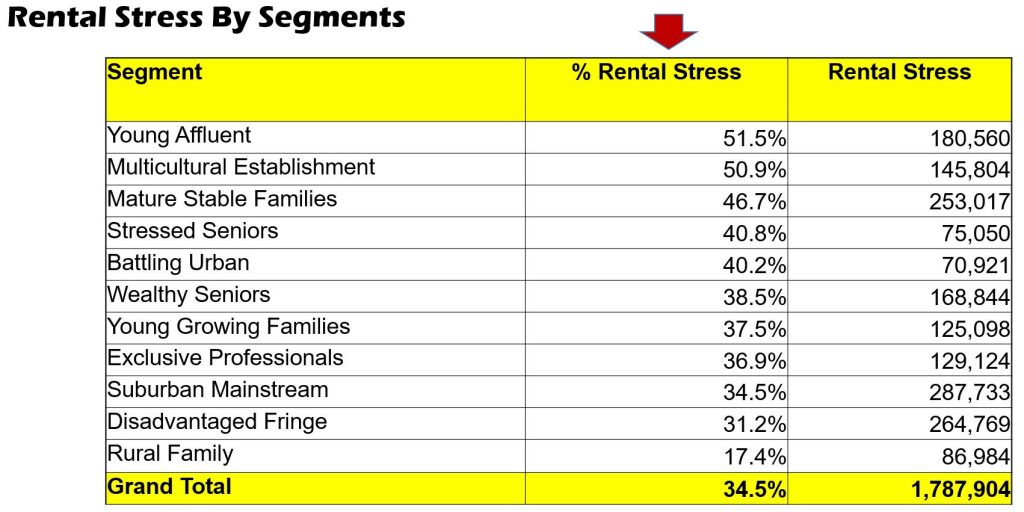
Across our household segments, young growing families (which include first time buyers) are most exposed, together with households on new estates on the edges of our towns and cities. Rental stress is highest among first generation migrants, while investor stress is highest among most affluent households who are highly leveraged into investment property.
As a result aggregate financial stress is dispersed across many of our segments, indicating this is a real structural problem.
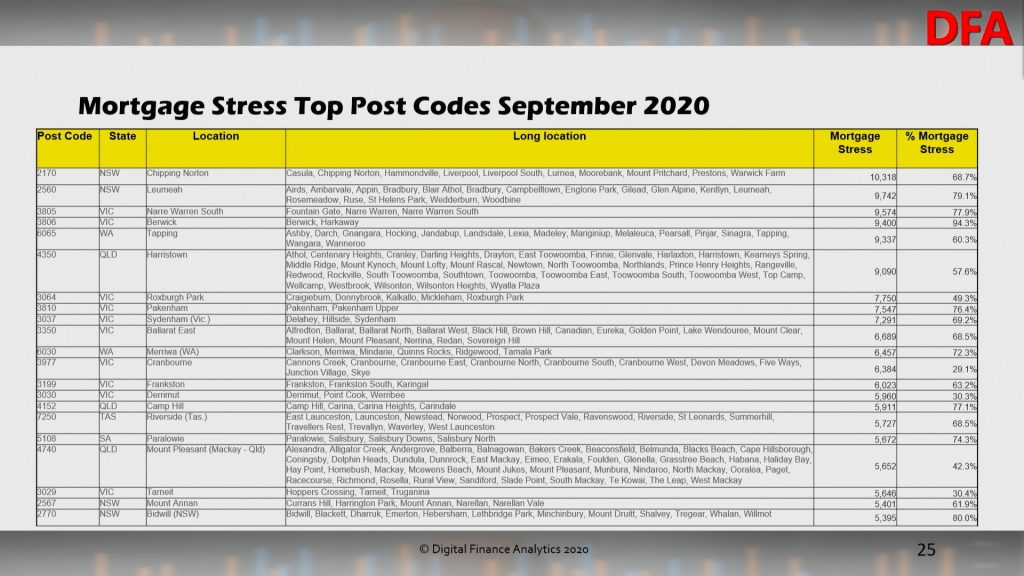
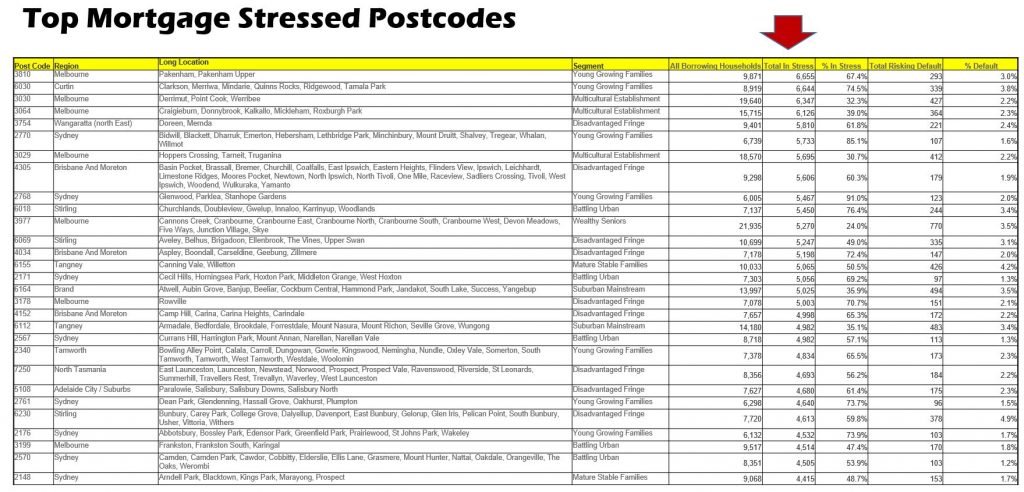
Top post codes by mortgage stress:
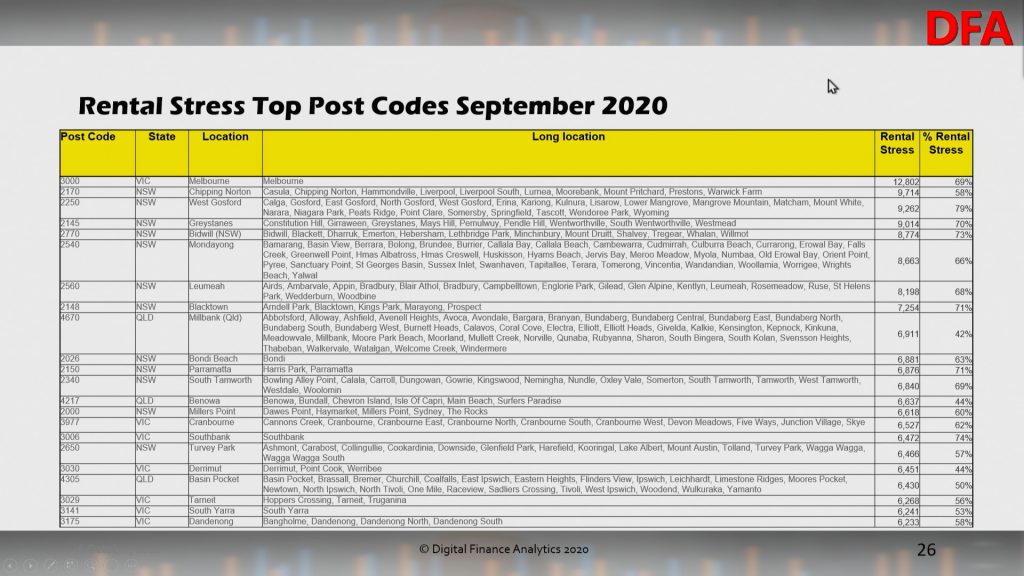
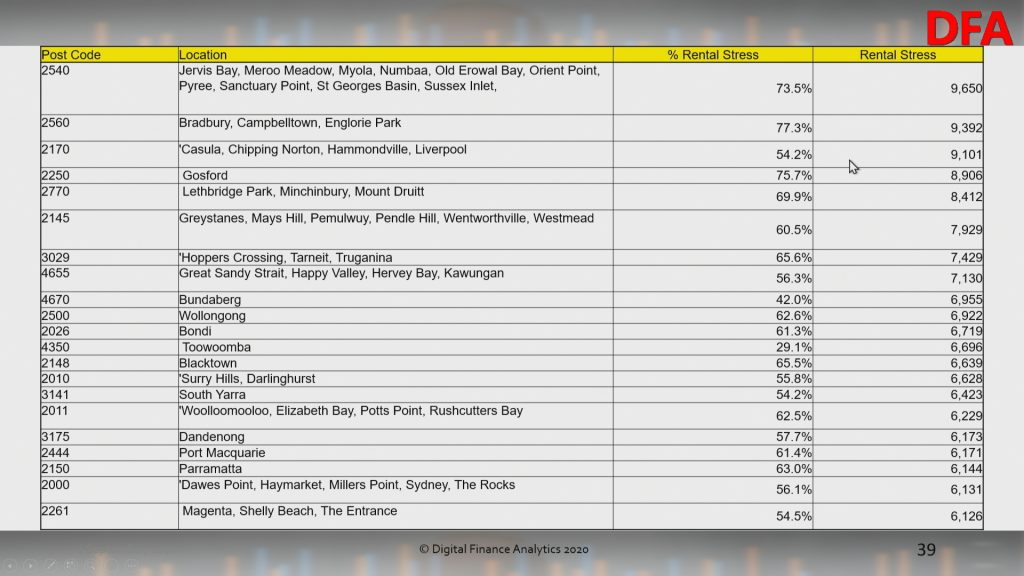
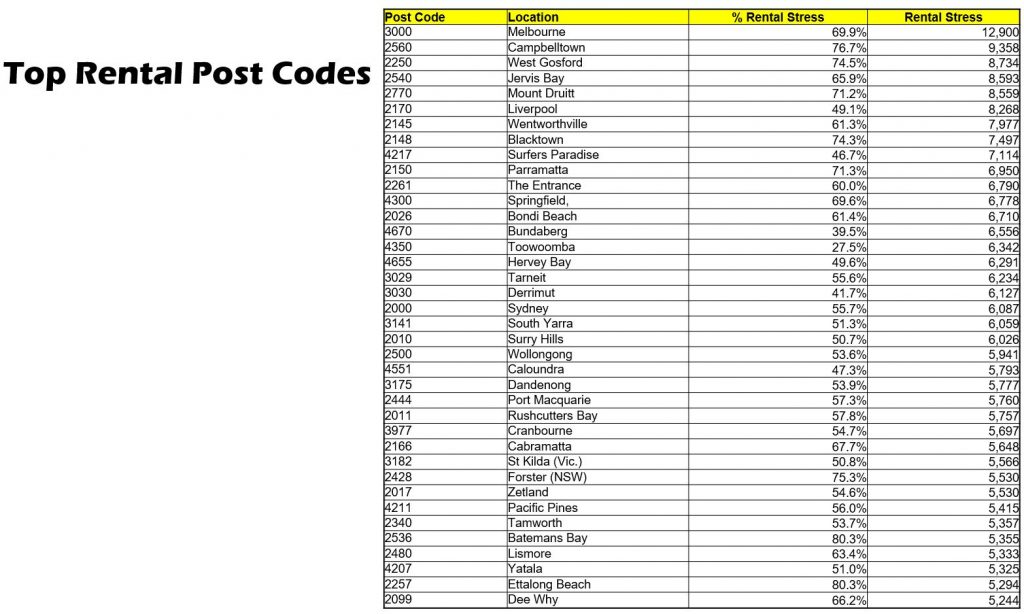
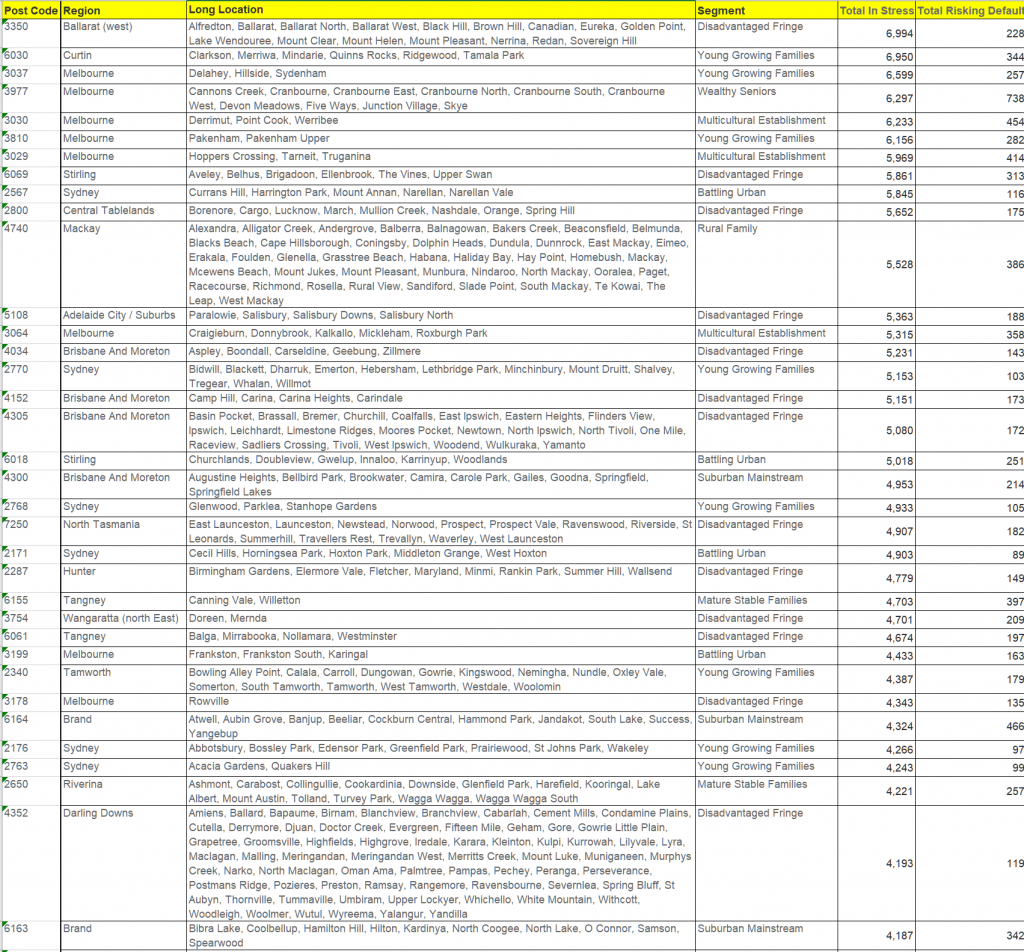
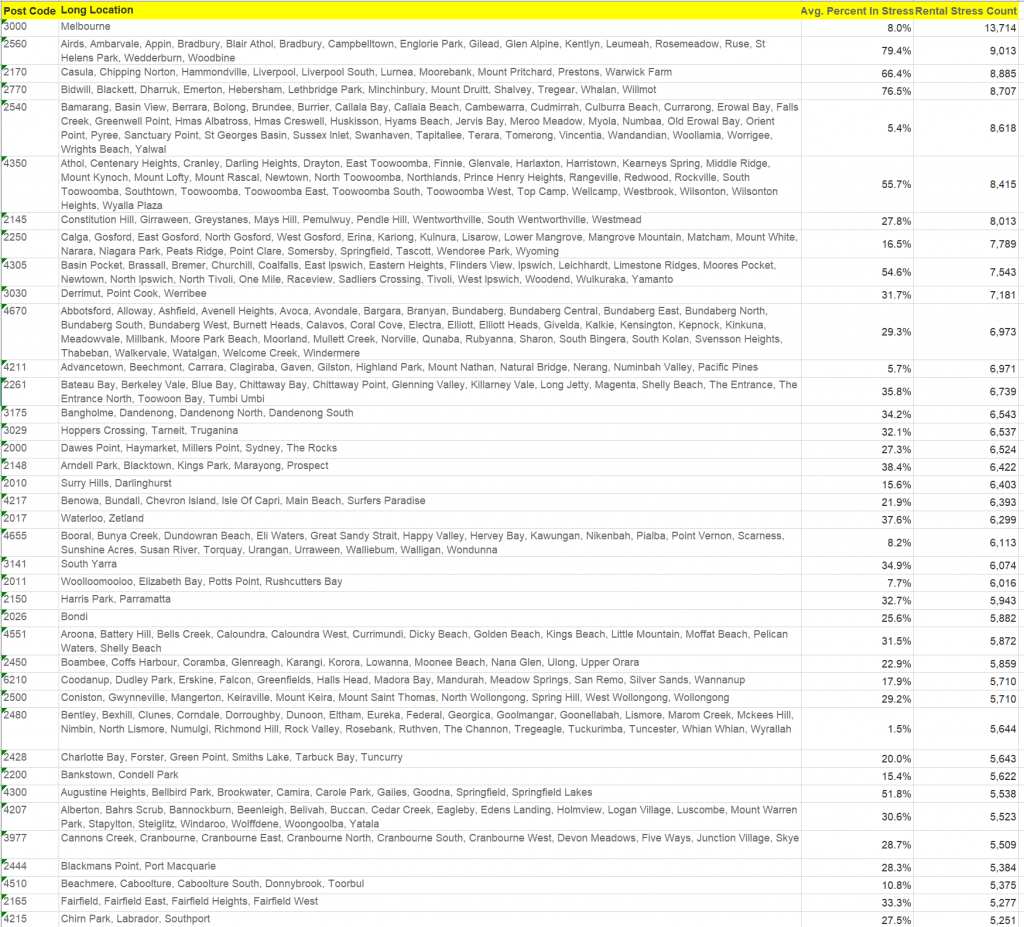
Top post codes by rental stress:
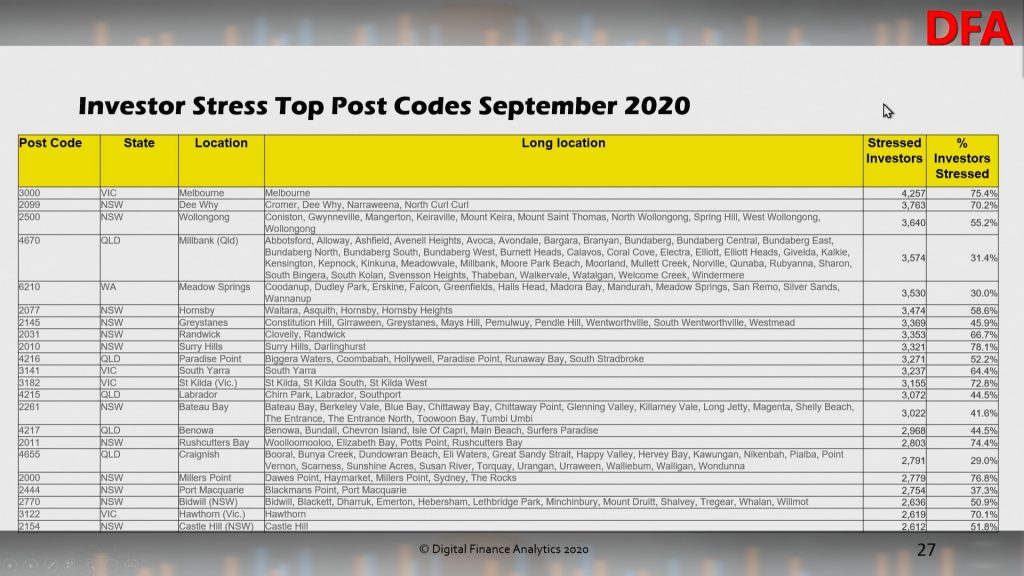
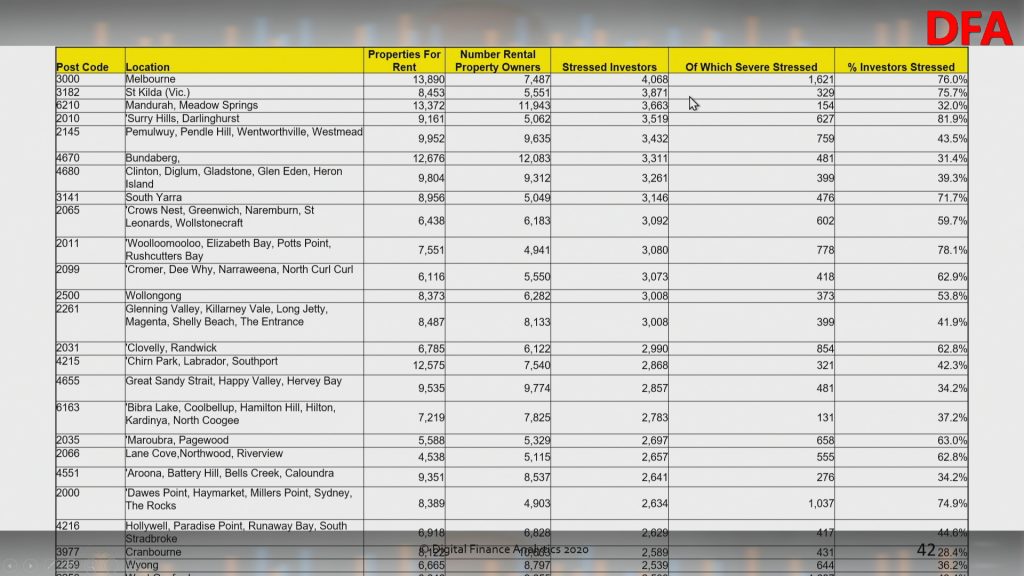
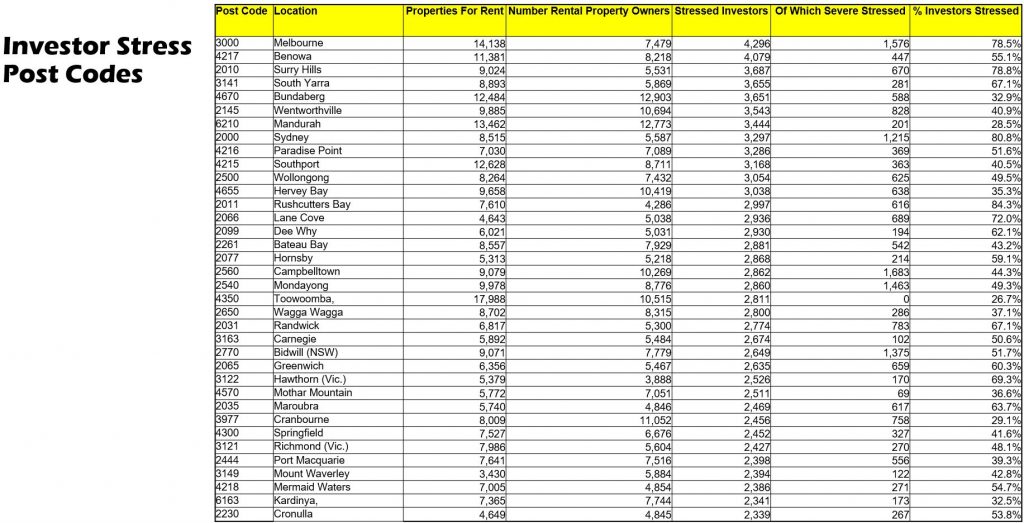
Top post codes by property investor stress:
Top post codes by overall financial stress:
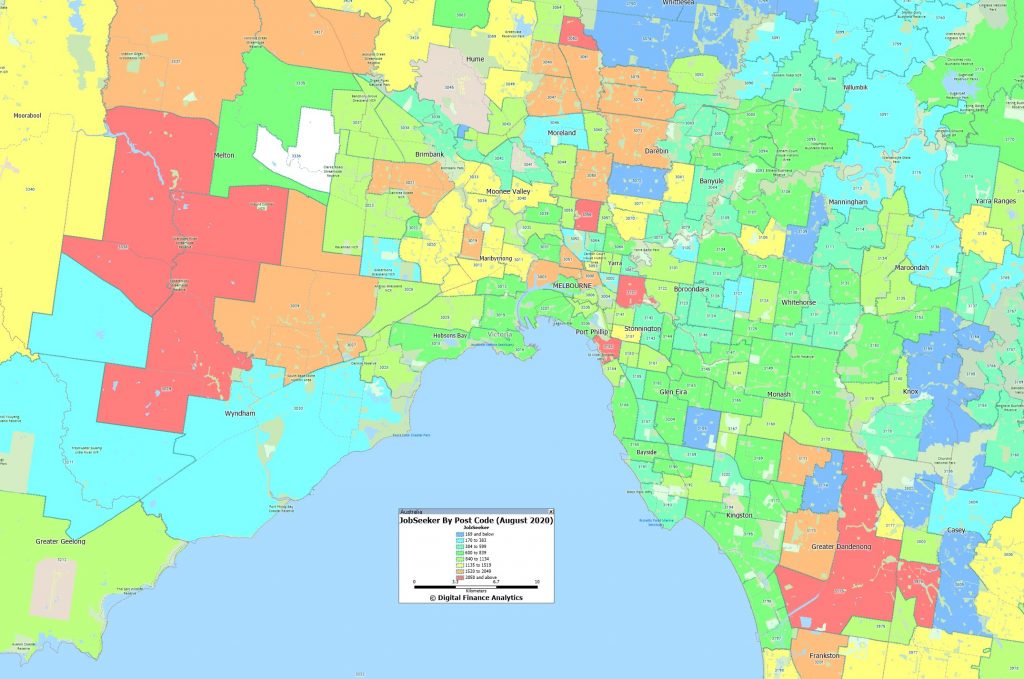
As we discussed in our post last night there is a strong correlation between mortgage stress and high counts of JobSeeker claims. Melbourne is an example:
As the mortgage repayment holidays dry up we expect stress to remain high even if job growth recovers. This is a structural issue which will not be solved with more generous lending standards. Only real income growth would assist, but this seems unlikely for some time to come.
Join us tonight at 20:00 Sydney for a live discussion on our latest research and analysis. You will be able to ask a question live via the YouTube chat. We will also have our post code tool online.
I discussed the latest from the Bankers Association on the arrangements for the mortgage and business loans deferment reviews which are now underway on ABC Illawarra today.
The August 2020 data from our surveys continues to tell a sorry tale of more households feeling the pinch, whether they are mortgaged, renting or investing. Within the numbers there was a slid in Victoria in particular reflecting the latest lock down and the rising pressure on business there.
We discussed this at length in our live show yesterday. Here is a link to the HD edition:
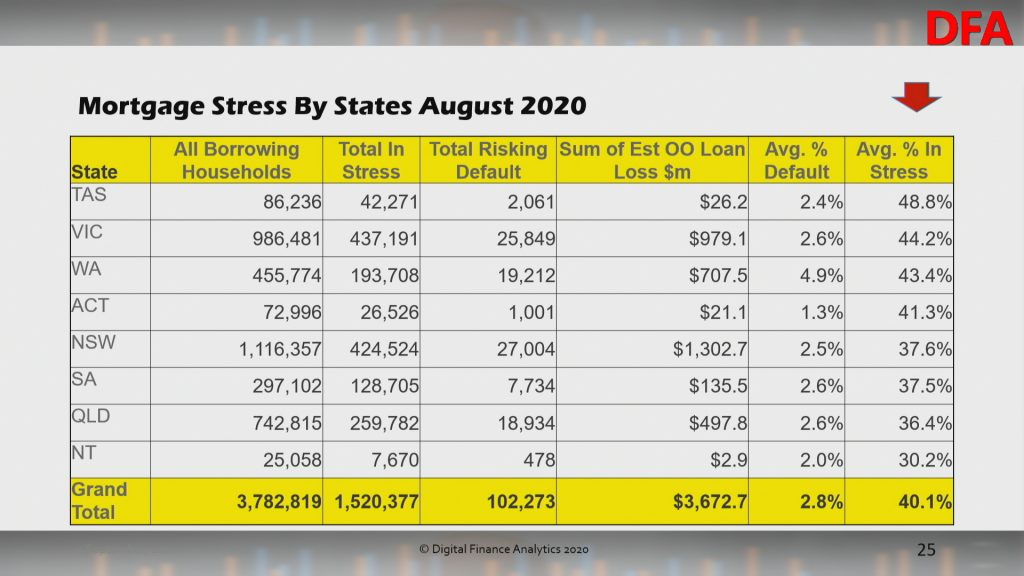
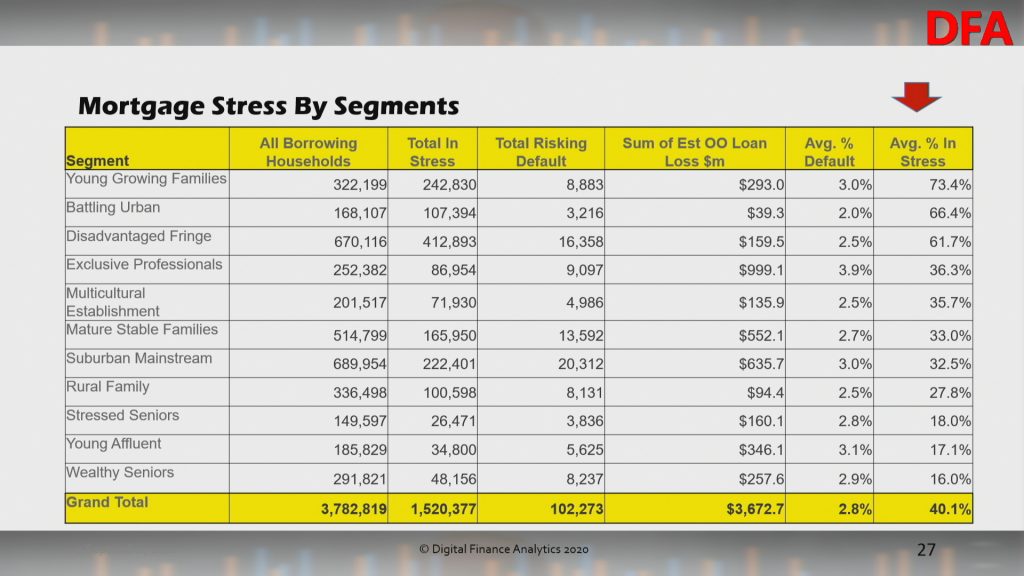
Overall mortgage stress came in at 40.1%:
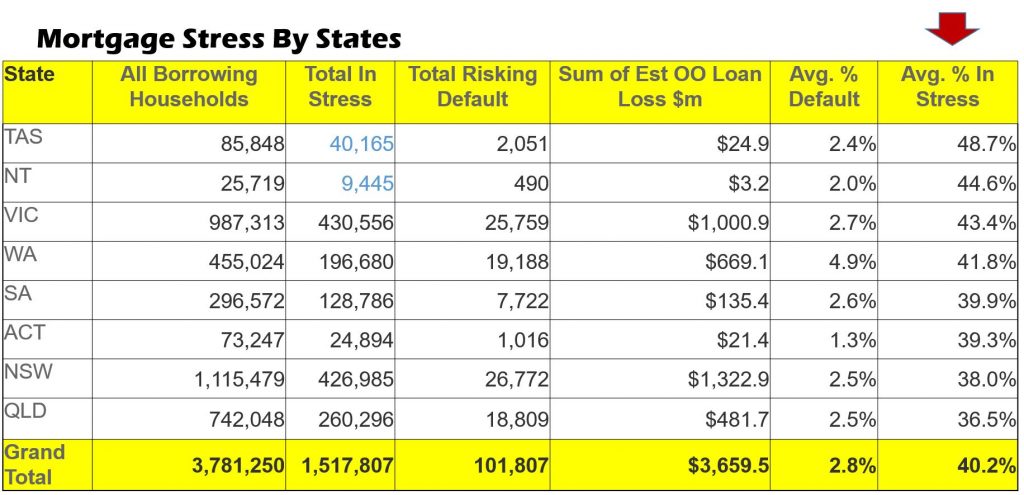
This equates to 1.52 million households, with TAS, VIC and WA leading the pack.
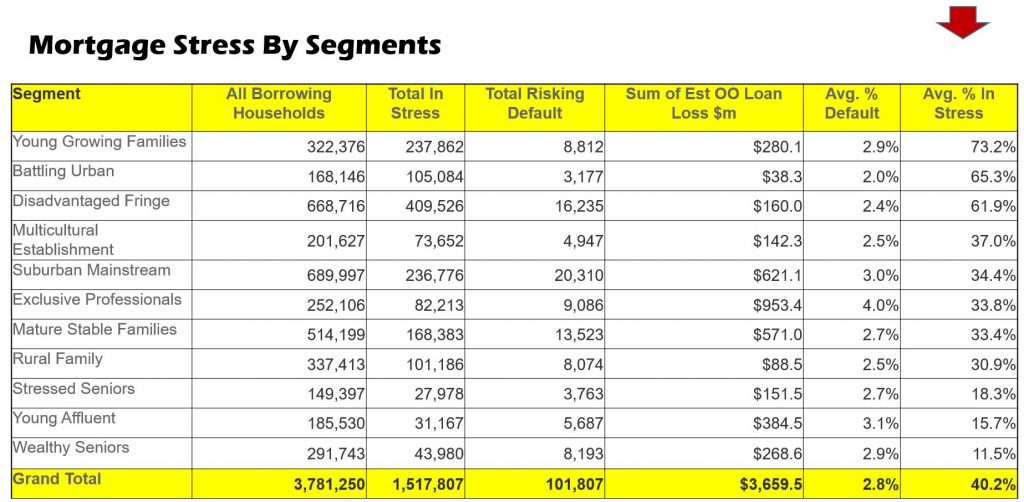
Young Growing Families, and Urban Fringe households are most strongly represented. This includes significant swathes of First Time Buyers.
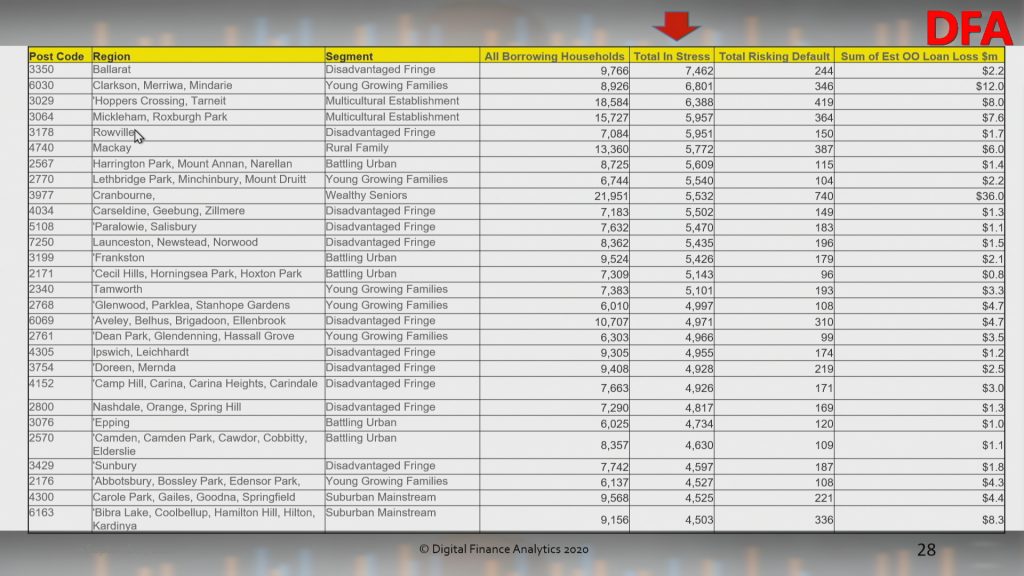
The post codes with the largest counts of stressed households coincide with areas of high recent development, where households have large mortgages, and VIC is over represented thanks to the lock downs.
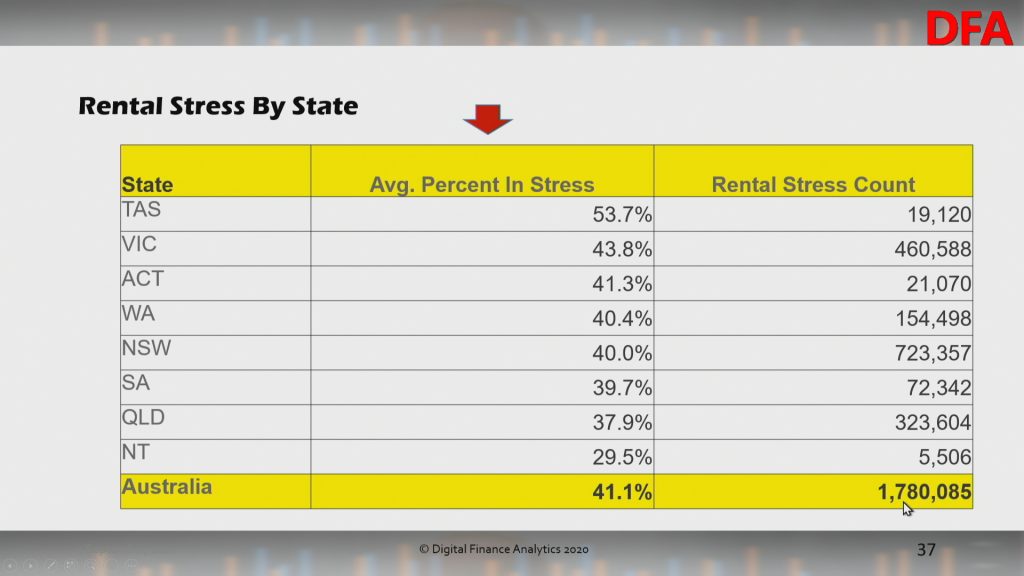
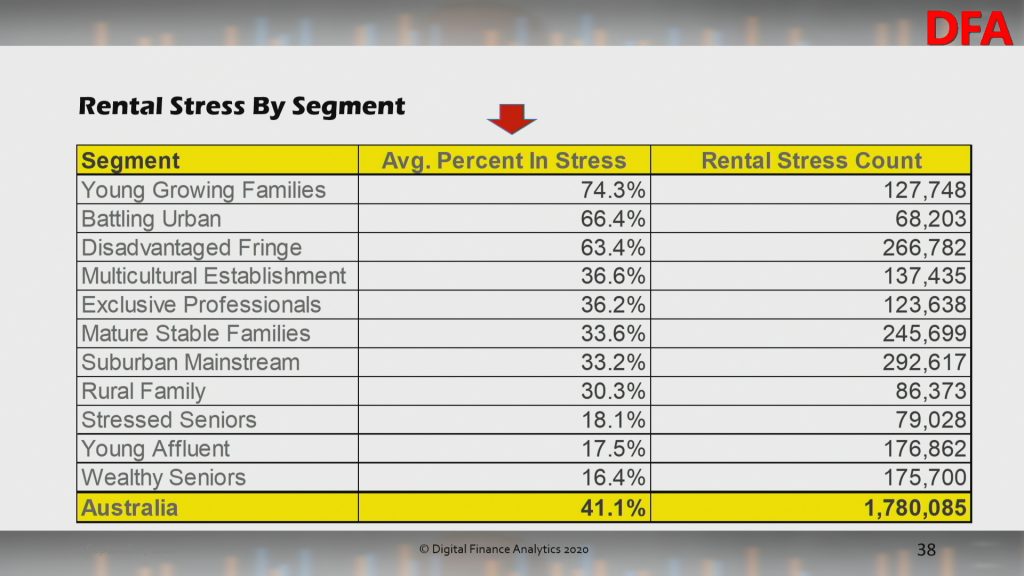
Rental stress remains a significant issue also, with 41.1% of Renters in difficulty, or 1.78 million households.
Within the segments, again Young Growing Families are most impacted.
The post codes with the largest counts are revealed here.
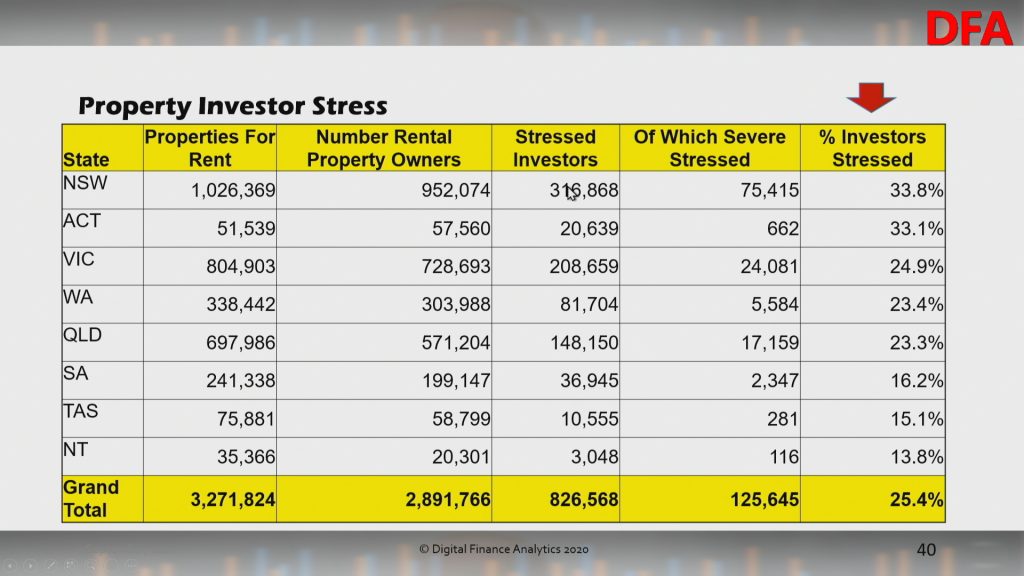
Finally, investors remain in crunch territory, with 25.4%, or 826,000 under water, or trying to sell as rentals slide, and property values ease.
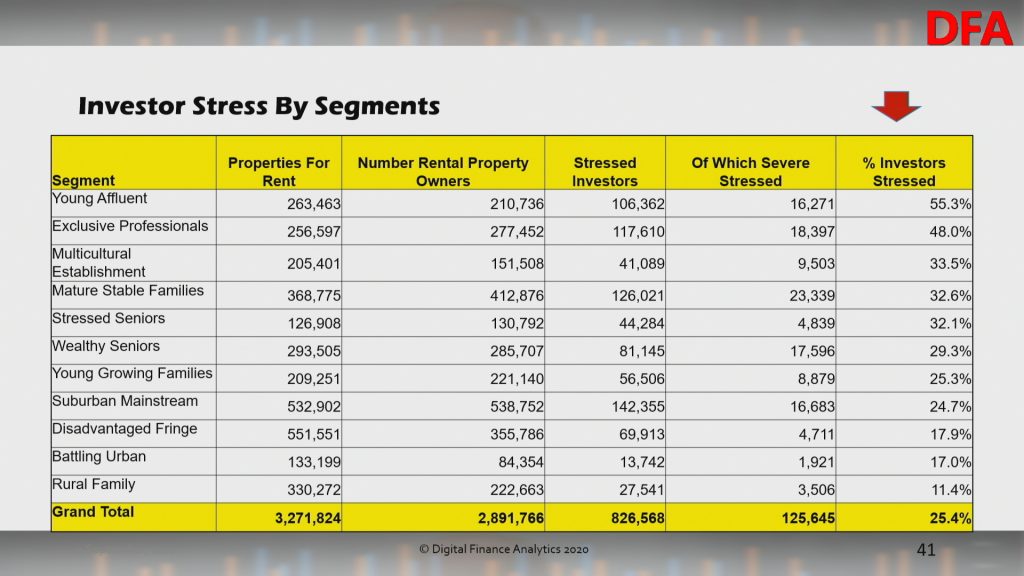
More affluent households are most impacted.
Once again Melbourne 3000 contains the latest number of stressed property investors (their investment portfolios can be anywhere, this is where they reside).
We will publish some stress mapping later, but clearly the fiscal cliff, which is now leglislated, will push more over the edge. Expect higher default levels over the next few month, more forced sales and less household consumption.
We discuss the concept of financial stress and illustrate this with an extract from our household surveys, ahead of the latest results which we will discuss on Tuesday. https://youtu.be/8gO_29PUDw8
National Debt Helpline: https://ndh.org.au/ https://mozo.com.au/family-finances/where-to-find-free-financial-counselling-services-in-australia
DFA has released our latest results from our rolling 52,000 household surveys. As a result of the economic slowdown (which was already underway before COVID) and exacerbated by the COVID restrictions, more households are falling into financial stress.
We define stress in cash flow terms – money in and money out – for both rental and mortgage stress, with those in negative cash flow flagged as stressed. Investor stress is assessed by different means, including negative cash flow, extended vacancy rates, intention to sell and other factors. In the round while the various Government support schemes, and repayment holidays, plus rental freezes are assisting, the downward trajectory in finances is clear, and explains the rising stress.
Mortgage stress rose to its highest level ever at 40.2 of households. We expect this to climb higher as support is moderated, and banks have hard conversations about recommencing repayments. Morgan Stanley commissioned a survey of mortgagors as part of some research on the impact of the coronavirus, and found that 55 per cent of them have received some form of income support. Household debt ratios continue to rise (thanks also to the capitalised interest and repayment holidays).
Two states saw a slight decline in the month, TAS and NT, as restrictions were somewhat eased,though both states have the highest stress percentages. But households in VIC rose by more than 15,000 from last month and NSW by more than 12,000. Overall more than 1.5 million households are impacted, up from 1.45 million last month.
Across the segments, Young Growing Families are most exposed – this includes recent cohorts of first time buyers. Affluent households continue to be impacted, as unemployment is becoming structural. The RBA recently flagged an official rate of ~10% later in the year. The true rate is significantly higher.
Looking in more detail at the post codes with the largest counts, many are fringe areas where there are many new estates, large houses on small lots driven by the construction boom. However a number of regional centres are also impacted. VIC is particularly exposed.
Turning to rental stress, we see a rise of tenants struggling with repayments. There is confusion for some as to whether their rents are on hold, or simply accruing. We are seeing more households planning to move back with family and friends. Stress is highest in NSW and VIC, with a significant spike in the largest states.
Across the segments, Young Affluent and Multicultural Groups are most exposed, linked with both students suddenly without part-time work, and the shrinking of the gig economy. However in terms of numbers of stressed renters more mainstream families are caught.
The post code distribution is illuminating, with Melbourne 3000 the standout high risk post code. Then comes both areas of Western Sydney and the Central Coast.
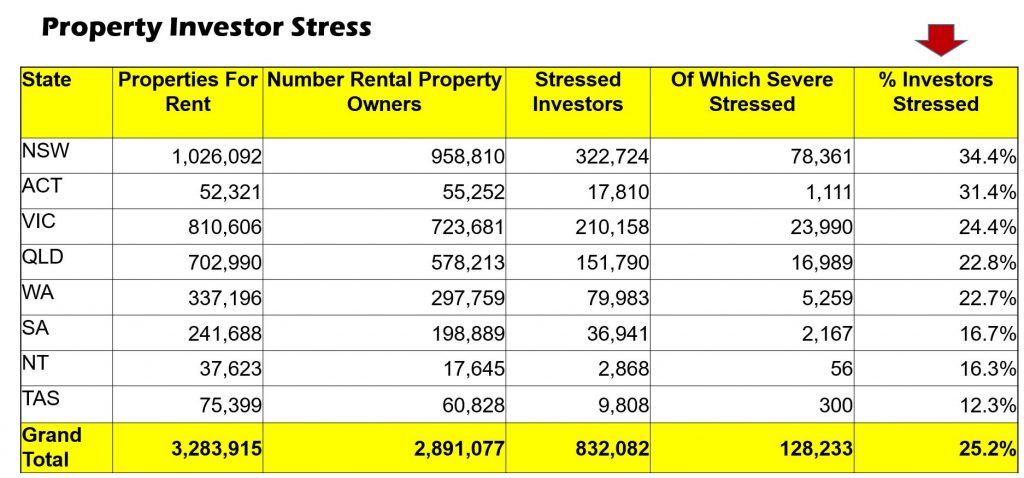
Finally turning to our latest analysis of Stressed Property Investors (based on their place of residence not where their properties are located), we see that 25% of investors are stressed, and overall 12% are actively considering selling. The highest rates of stress are in the NSW and ACT.
By segment, Young Affluent and Exclusive Professional Property Investors are the most stressed, not least because of the higher proportion of multiple investment property held. Many Young Affluents have multiple (cheaper) high-rise investments which are losing value.
Melbourne 3000 holds the unenviable record for the highest count of stressed Investors (which may well correlate to the high rental stress). Mandurah, in WA, where prices have dropped 38% from peak appears near the top as many Investors have been in difficulty for years, and are unable to sell due to negative equity. Watch and learn….
We expect the banks to be tougher on property holders in these high risk areas, compared to others as the discussions about payment restarts after September.
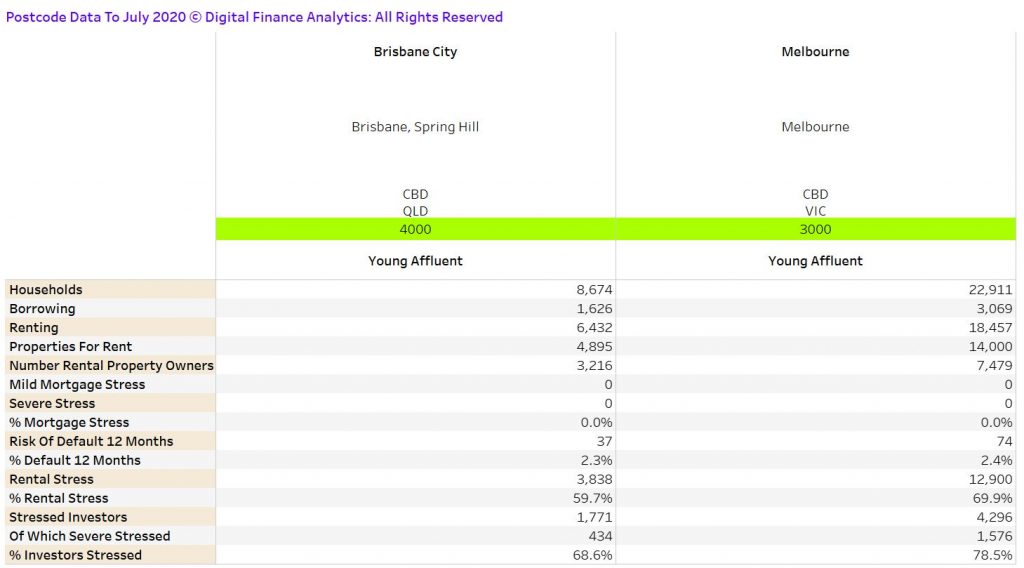
To make the point, here is the full data for 3000 and 4000. The pinch points here are clearly related to investment property.
We can provide post code level data for most locations across the country, or you can subscribe via Patreon to receive a full monthly update.
Finally, we discussed this analysis at length on our recent live stream:
Digital Finance Analytics has released the results of our rolling 52,000 household surveys to the end of June, which reveals that mortgage stress rose to 39.1%, compared with 37.5% in May. In addition, rental stress was 39.4%. Moreover, a larger number of property investors with a mortgage (51.3%) are underwater from a cash-flow perspective. This is new analysis which suggests investors are caught in the financial crisis headlights.
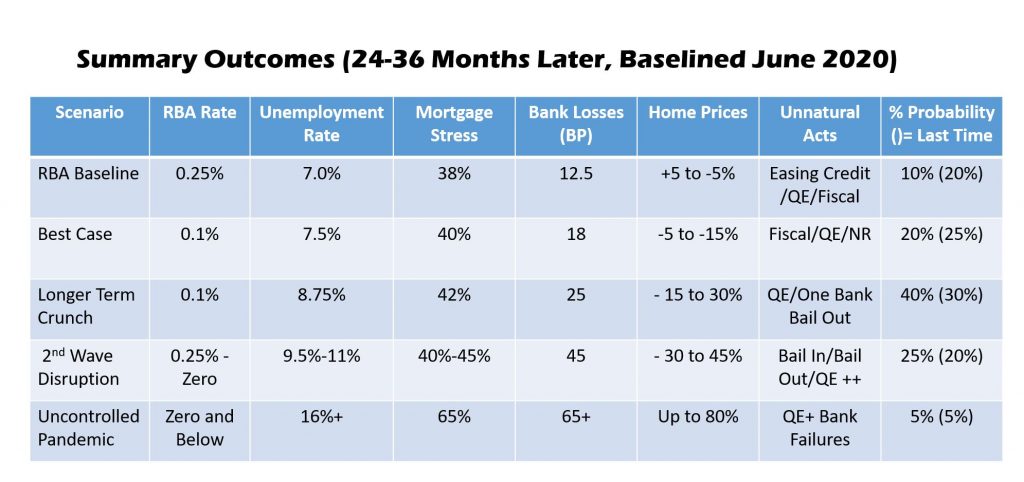
We discussed all this on our live stream last night, where we also updated our price scenarios:
June Mortgage Stress Update
We measure stress in cash-flow terms, money in, money out, rather than a set percentage of income dedicated to paying mortgage or rental payments. If the net income flows are lower than the net payment outflows, households are classified as stressed. These households will cut back on expenditure, put more of credit cards, or tap into deposits. While, they may have access to other assets – for example investment properties or share portfolios, negative cash flow remains a significant challenge.
This equates to 1.47 million owner occupied mortgage holders under financial pressure, and 1.7 million households in rental accommodation. More than 820,000 property investors are in difficulty.
The complex interplay of higher unemployment, JobSeeker and JobKeeper, together with the 490,000 mortgages with payment deferrals provides the backcloth for our analysis. However, by examining the financial flow status of households we have noted some realignment of households in the past month, with more casual and part-time workers able to return to work, but a significant rise in structural unemployment as larger companies, such as larger retailers, big consulting firms, and finance firms, make reductions in staff. These permanent cuts reflect the rightsizing of businesses in reaction to the economic downturn. Then we have the new Melbourne lock-down.
Mortgage Stress
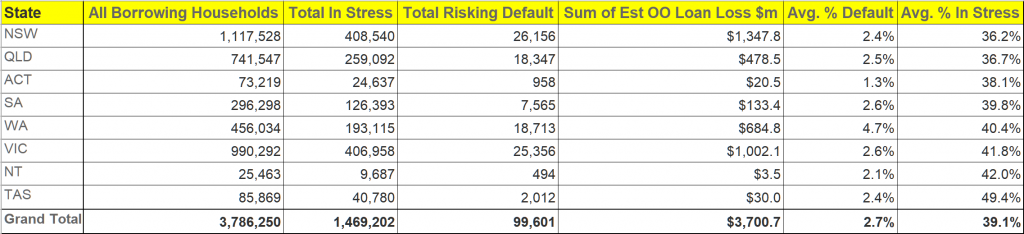
Turning to the detailed analysis, across the states, Tasmania has the highest proportion of households in mortgage stress, at 49.4%, followed by the NT and Victoria. However, the largest counts of stressed mortgage holders are in NSW, with 408,540 and VIC with 406,958. The highest risk of default rates are found in WA at 4.7%, VIC at 2.6% and SA at 2.6%.
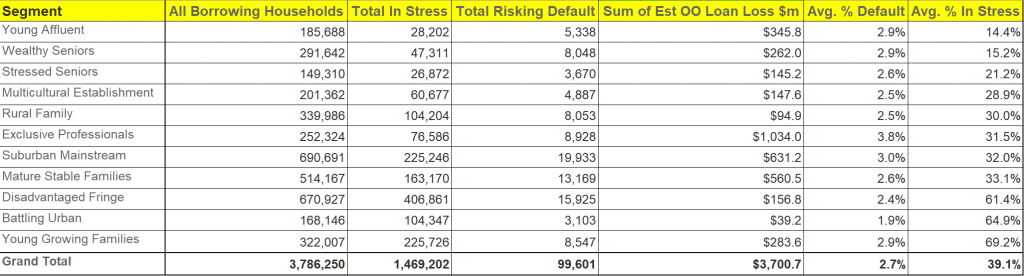
Within our household segments, the highest mortgage stress levels are among Young Growing Families, at 69.2% of households, which includes cohorts of recent first-time buyers, with more than 225,000 households at risk. Next, those on the urban fringe, are also exposed, along with more typical battlers. We are also seeing a rise in affluent stress, where households on higher incomes are experiencing significant issues. The Exclusive Professional segment, the top few percent on an income basis, include 31.5% stressed, which equates to more than 76,000 households across the country. Significantly, in value terms, they hold around 28% of all default risk to the banks by value.
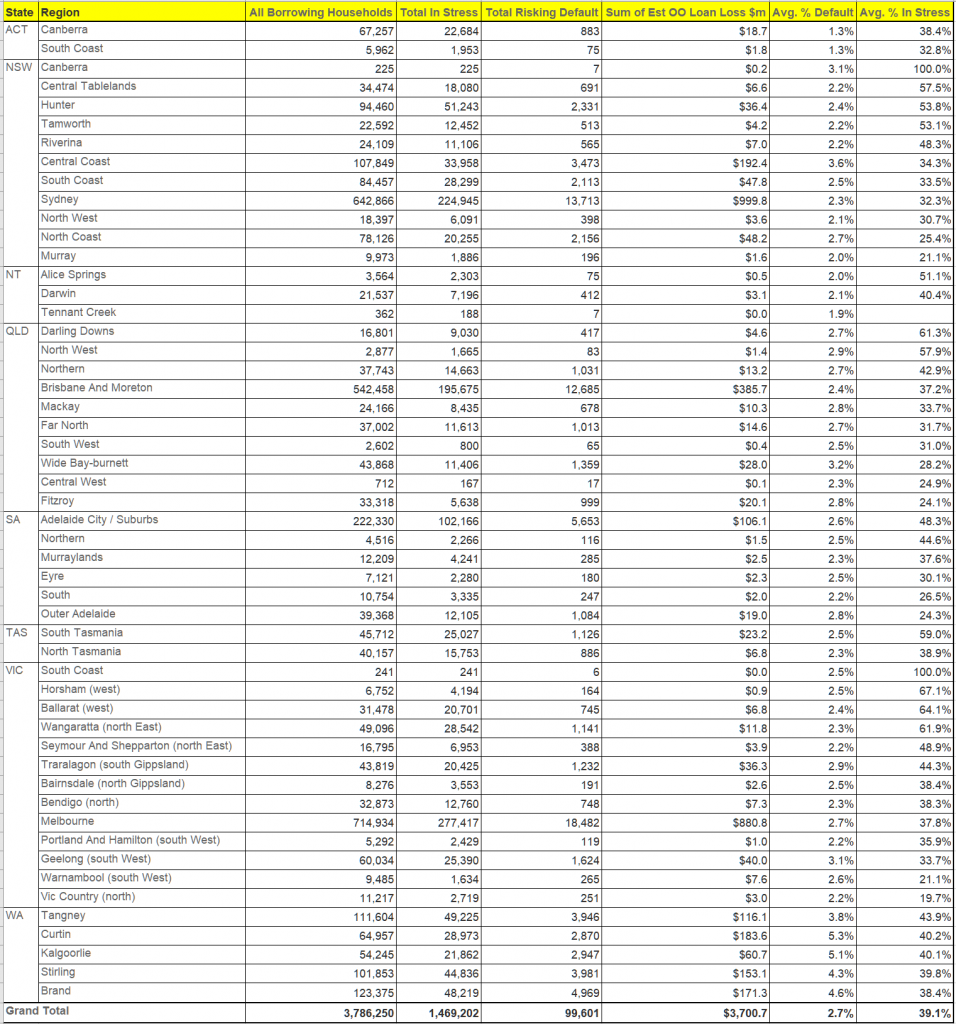
Mortgage stress is apparent not just in the main urban centres, but across the regions. This is a structural not caused by COIVD, but amplified by it.
Stress varies by post code. Here are the top 30:
Rental Stress
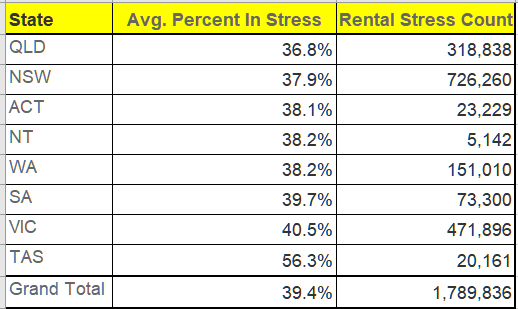
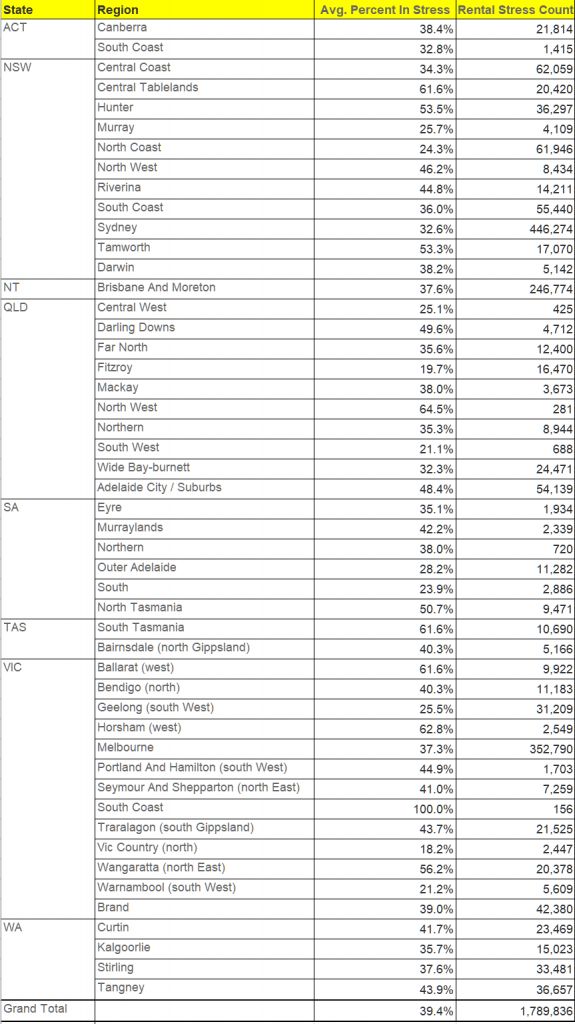
Turning to rental stress, the patterns are somewhat similar. The highest stress among renters is found in TAS at 6.3%, followed by VIC at 40.5% and SA at 39.7%. Whilst on a percentage basis the lowest levels of stress are in QLD (36.8%) and NSW, 37.9%, in fact the largest count of stressed households in also in NSW, as here the proportion of households renting is the highest (reflecting the poor affordability of housing in the state, despite rents falling in real terms.
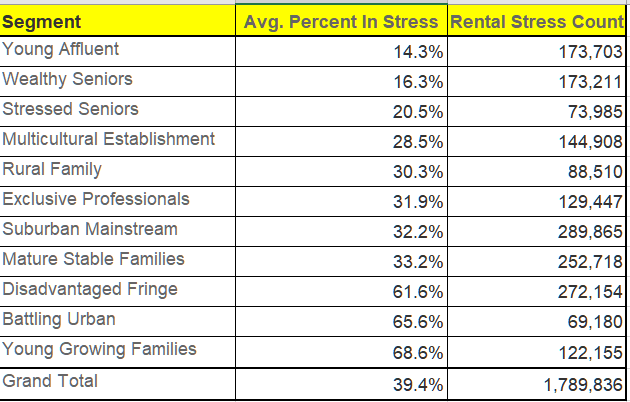
Across the DFA household segments, once again, Young Growing Families are most stressed, at 68.6%, whereas the largest counts are among suburban mainstream households (289,000), Disadvantaged Fringe (272,000) and Mature Stable (252,000).
Once again rental stress is widely distributed across the regions, and should not be regarded as a capital city problem.
Rental stress by postcode
Property Investor Stress
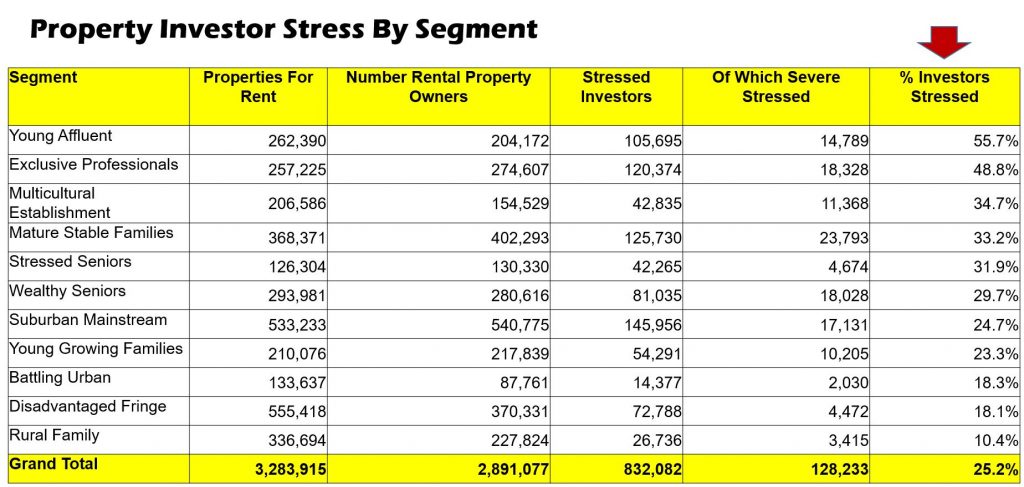
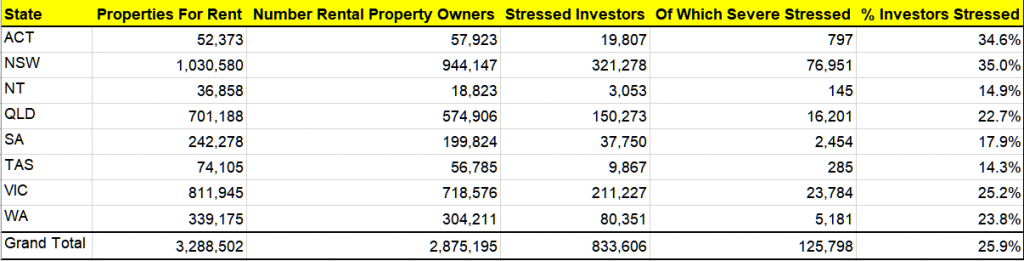
Finally, for the first time we are also reporting on property investors, and their property holdings. Across Australia, there are around 3.2 million properties available for letting (including short-term AirBnB type rentals as well as longer term residential). This excludes motels and hotel accommodation.
These properties are owned by around 2.8 million entities, including households and businesses. Around half the property available is covered by investment mortgages, which equates to around 1.65 million borrowers.
Of these 2.8 million entities, around 830,000 on a cash-flow basis, are not making sufficient to recover the costs of owning and letting their properties (stressed investors) of which 126,000 are severely stressed, most often because of low occupancy, or high repair costs. This is around 25.9% of all investment property, and 51.3% of mortgaged properties.
One complexity when analysing the more detailed footprint of investment property is that many owners live in different post codes to the properties they own. To account for this, we report the number of properties based on the location of the property itself, while the number of property investors and their stress status are reported on the basis of their home address, not the address of the property. That said, more than half reside in the same post code as their investment property.
NSW has the highest proportion of stressed investors at 35%, or around 321,000.
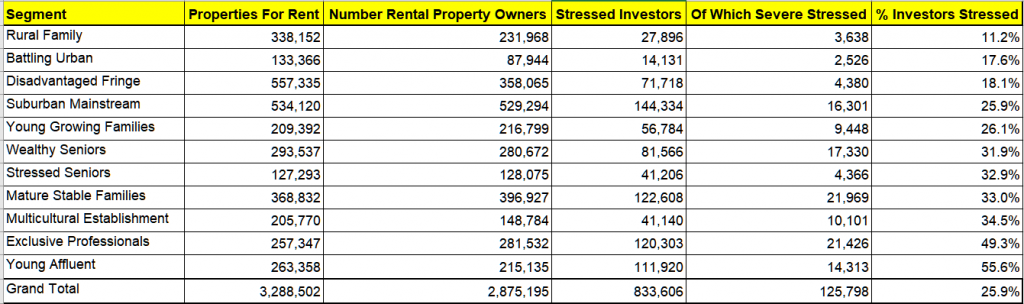
By segment, the most highly stressed investors are Young Affluent and Exclusive Professional investors (many of whom have multiple investment properties, so the pain is magnified).
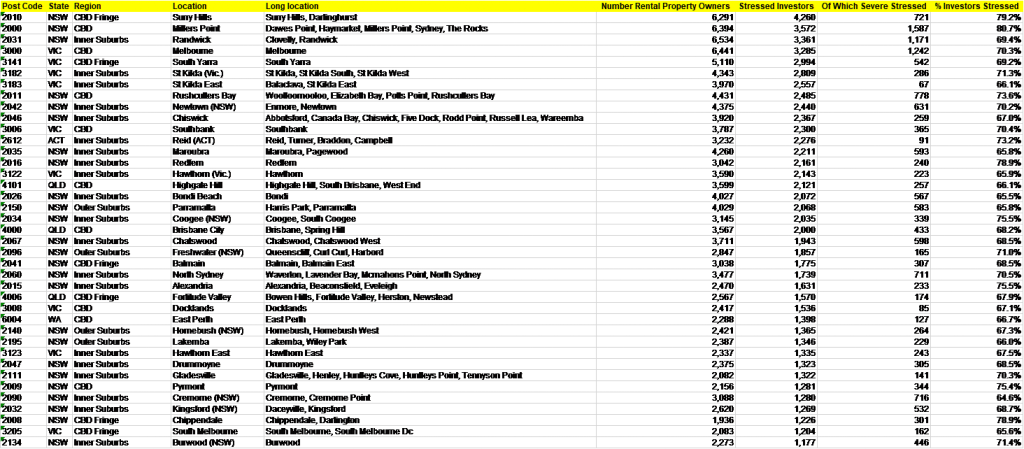
The top stressed investor postcodes include areas close the CBD of Sydney and Melbourne, including Surry Hills, Millers Point and Randwick in Sydney and Melbourne CBD, South Yarra and St Kilda in Melbourne.
The full stress series is available via our Patreon page for US$50 plus GST. You can subscribe there to receive full monthly updates.
Tonight we discuss the latest results from our surveys, to end June 2020. Where are the stress hot spots – and how are property investors fairing? Ask a question live via the YouTube chat – and we will have our postcode database on line to answer specific queries.