Bendigo Bank is the latest lender to increase interest rates for home loan customers, blaming higher funding costs for a round of rate rises of between 0.1 and 0.16 percentage points.
Bendigo and Adelaide Bank says it will raise rates on owner-occupier loans to customers paying principal and interest by 0.1 percentage points. Rates for property investors will rise by the same amount, while owner-occupiers who have interest-only mortgages face a larger 0.16 percentage point increase.
Chief executive Marnie Baker said the interest rate hikes, which will take effect from June 23, had been driven by an increase in bank funding costs over the year.
“Funding costs have been steadily increasing this year, and we’ve absorbed this cost impact to date. Today’s adjustment to the variable interest rates will assist in balancing this funding cost increase,” Ms Baker said.
The bank said its hike would raise repayments on a $250,000 home loan by $15.71 a month.
AMP is the latest to change its variable lending rates for all owner occupiers and investors.
The changes include an increase of:
8 basis points for owner occupied principal and interest
17 basis points for owner occupied interest only
17 basis points for investment principal and interest
17 basis points for investment interest only
The changes are effective 13 July 2018 for new business and 16 July 2018 for existing business.
AMP Bank said in its statement that it hasn’t raised rates for existing customers for over 12 months.
AMP Bank group executive Sally Bruce confirmed these changes are driven by an increase in funding costs.
She said, “We are managing our portfolio in a very active market and our decisions on rates are never taken lightly.
“We have held off passing this cost on to customers for as long as we can and in fact have not increased interest rates for existing customers since June last year.
“With any change, we are focussed on balancing the interests of our customers, the regulator and our business.”
AMP Bank continues to offer a competitive three-year fixed rate for owner occupied principal and interest customers at 3.79%.
Other banks to increase their rates recently include IMB, AusWide, ING and Bank of Queensland.
On Monday, Macquarie Bank became the latest lender to reprice its home loans, announcing that owner-occupier variable rate loans with principal and interest repayments will increase by 0.06 of a percentage point, while those with interest-only repayments will increase by 0.10 of a percentage point across all LVR bands.
Investment and SMSF loans with variable rates will increase by 0.10 of a percentage point.
Macquarie will drop its three-year fixed rate by 10 basis points for all owner-occupier and investor loans.
The changes are effective from 13 July for new customers and 23 July for existing customers.
ING also flagged the need to increase rates by 10 basis points this week for variable owner-occupied mortgages.
Non-bank lender Pepper is also believed to have lifted rates. As of 6 July, Pepper’s rates are understood to have increased by up to 55 basis points.
Late last month, AMP Bank and Auswide Bank also announced rate hikes in response to increased funding costs. Speaking to Mortgage Business, the chief financial officer (CFO) of Auswide Bank, Bill Schafer, attributed the lender’s decision to lift interest rates on its mortgage products to the sharp rise in the bank bill swap rate (BBSW).
“Our funding costs have risen significantly in the last four months,” Mr Schafer said.
“The BBSW — the 30-day rate and the 90-day rate — has had a large effect on our wholesale funding lines, and they’ve increased by between 30 and 35 points since the beginning of March, so that’s had a substantial effect on our net interest margin.
“We’ve been trying to absorb that across that period of time, with the hope that those costs would be relieved and the BBSW rates would decline, but now we’re nearing the end of the fourth month, we’ve taken the decision that the impact on our net interest margin is too severe, and unfortunately we needed to do an out-of-cycle rate increase.”
The latest Deloitte Australian Mortgage Report 2018, released last week, found that the biggest challenge for non-majors is access to funding relative to the big four.
“We have seen that in the most recent fortnight, some of the non-majors have had to move their standard variable rate in response to movements in the underlying BBSW spread over cash,” Deloitte financial services partner James Hickey said.
“The majors have so far been able to absorb that and not pass on that movement. They may well move on it soon, but it just goes to show the heightened level of sensitivity the regional lenders have to wholesale funding markets.”
Bank of Queensland has announced it will be increasing interest rates across its variable home loans and Lines of Credit for owner occupiers and investors.
We expect other banks to follow, as they are all sitting on the same funding cost volcano.
BOQ said that the variable home loan rate for owner occupiers (principal and interest repayments) will increase by 0.09 per cent, per annum; variable home loan rate for owner occupiers (interest only repayments) will increase by 0.15 per cent, per annum; variable home loan rate for investors (principal and interest and interest only repayments) will increase by 0.15 per cent, per annum; and Owner occupier and investor Lines of Credit will increase by 0.10 per cent, per annum.
Anthony Rose, Acting Group Executive, Retail Banking said today’s announcement is largely due to the increased cost of funding.
“Funding costs have significantly risen since February this year and have primarily been driven by an increase in 30 and 90 day BBSW rates, along with elevated competition for term deposits.
“While the bank has absorbed these costs for some time, the changes announced today will help to offset the ongoing impact of the increased funding costs.
“These decisions are always difficult and BOQ balances the needs of our borrowers and depositors when making changes,” Mr Rose said.
The interest rate changes are effective Monday, 2 July 2018.
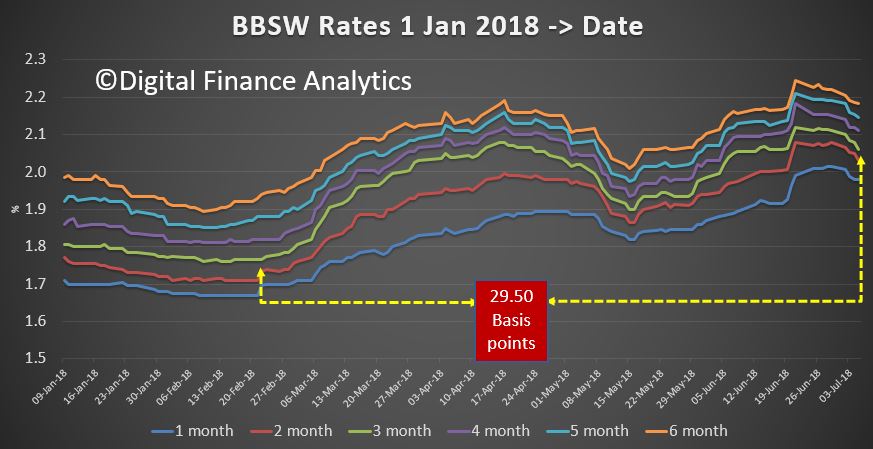
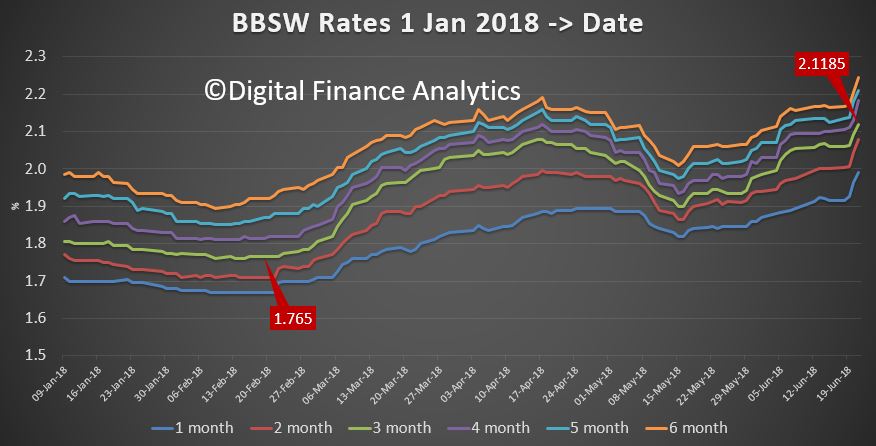
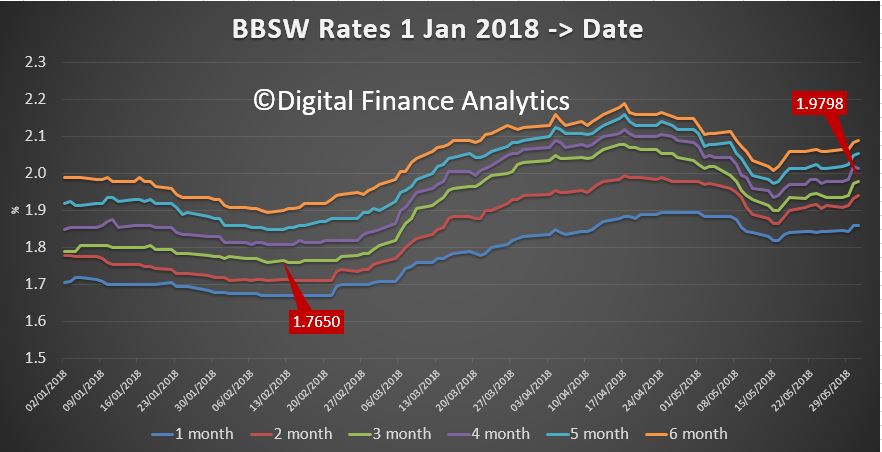
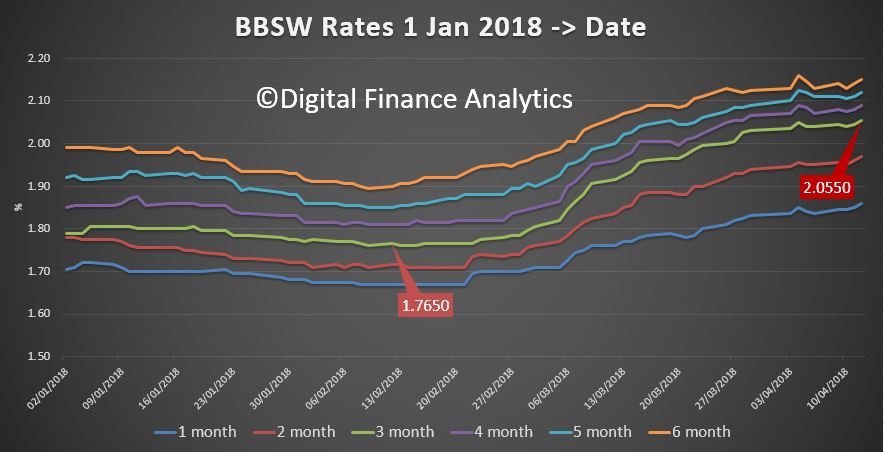
The benchmark BBSW rate has moved higher again, with the 3 month series now at a high of 2.1185; up ~36 basis points from February.
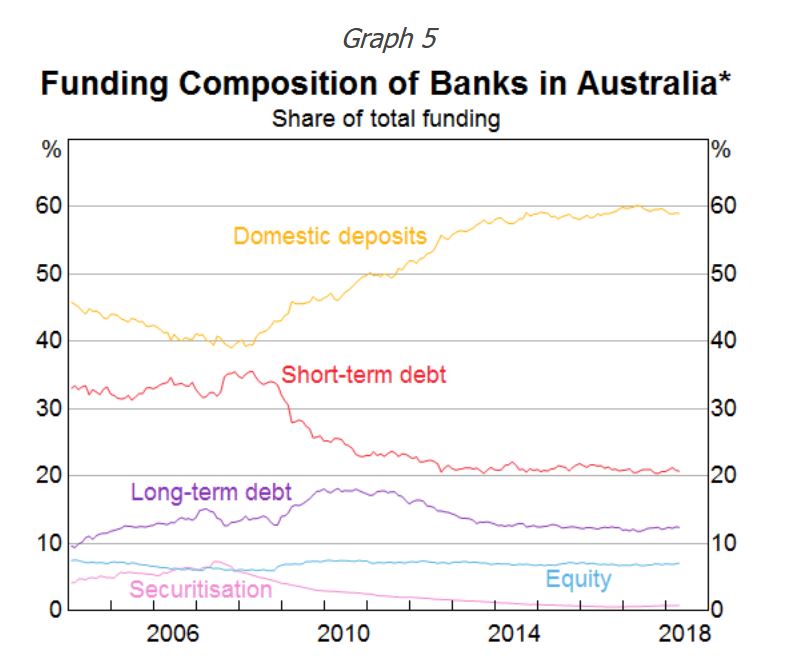
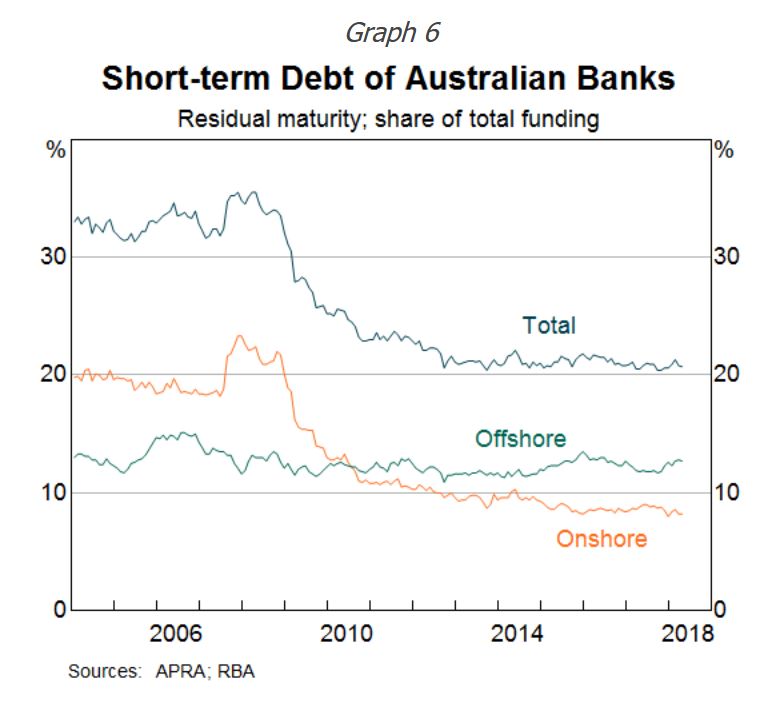
We know that around 20% of bank funding is from short term sources, according to the RBA.
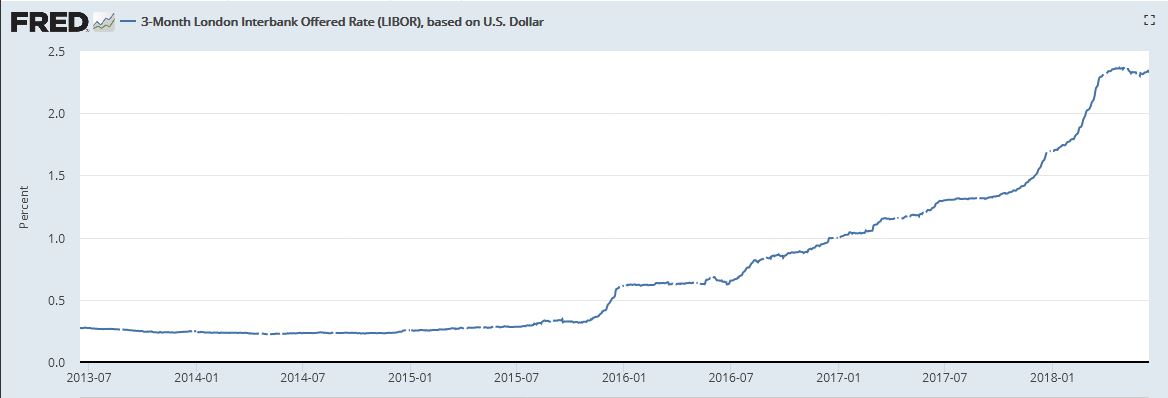
Of that, more is sourced offshore than onshore. Both overseas rates – as typified by the US LIBOR …
… and the local BBSW rates as we looked at before, suggest a hike in mortgage rates is coming. In fact more smaller lenders quietly lifted their rates last week, following Suncorp, ME Bank and others.
IMB Bank said from 22 June, its standard variable interest rate will increase by 0.08 per cent for new and existing home loan customers and Auswide has also lifted with increases of five basis points (0.05%) for owner occupied home loans and thirteen basis points (0.13%) for investment home loans and residential lines of credit, effective 27th June.
Unless the majors follow suite, expect their profits to drop, and returns of bank deposit to fall further.
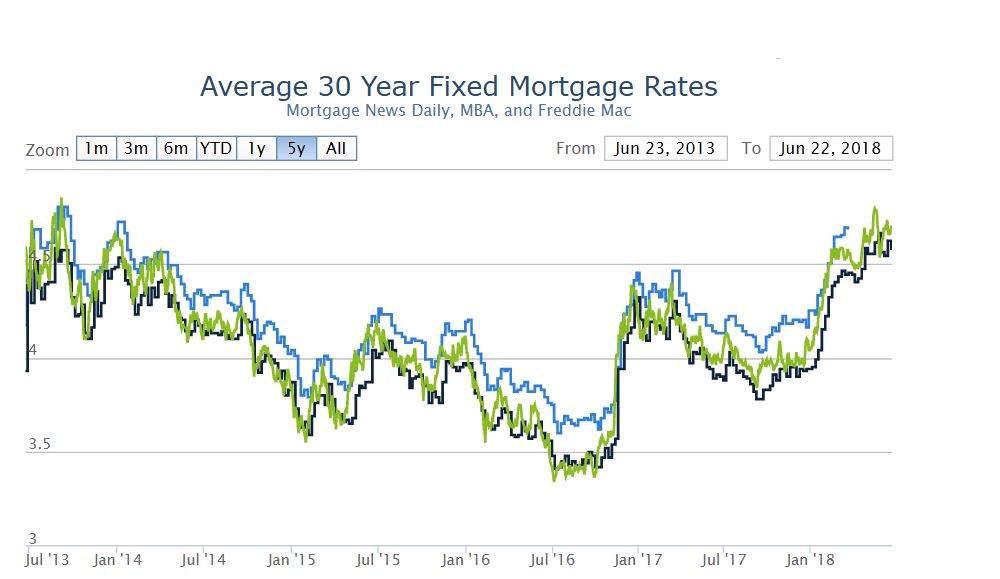
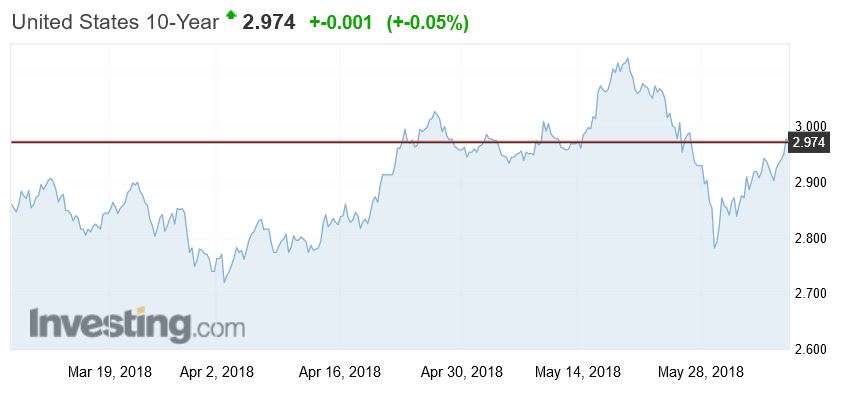
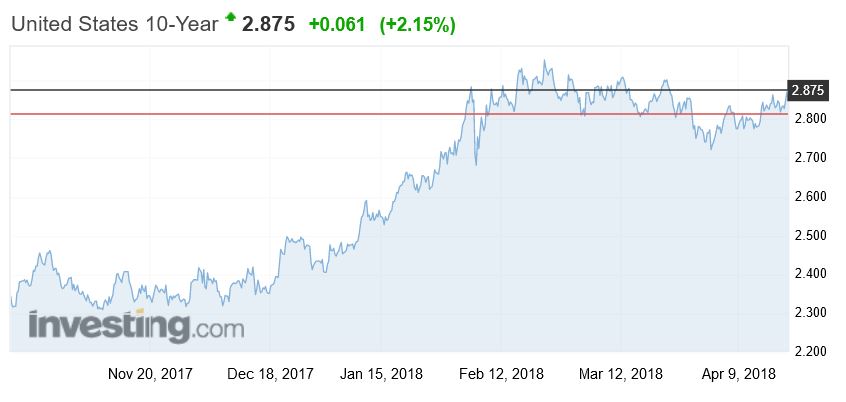
The US 10-year bond rate is moving higher again, with the expectation of more FED rate rises ahead.
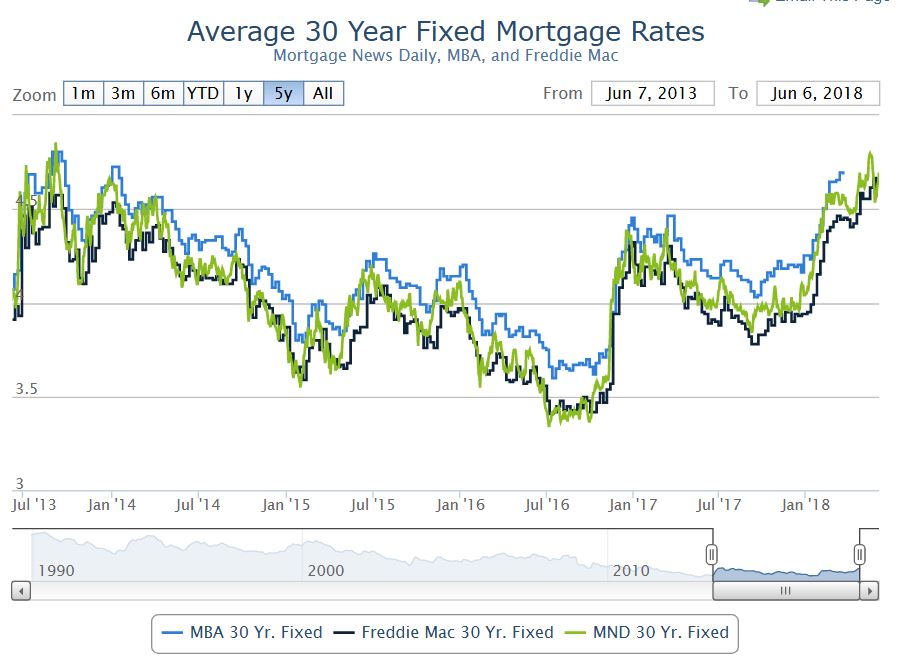
US mortgage rates have resumed an upward trend that began last week after political turmoil in Italy began to die down. More simply put, rates had been rising in mid May.
Locally, I continue to track the BBSW (the critical benchmark)..
… and rates are still elevated, if off their highs. This is an indication of the influence of overseas funding, and the question of trust in the local markets following the Royal Commission revelations, recent court cases and now the latest suggestions of cartel behaviour.
But the question is, to what extent are these movements in short term rates hitting Australian bank margins, and will they react by repricing their back books?
There is first the “optics”, given the current focus on their poor behaviour as laid bare in the recent rounds of hearings. Banks who hike rates risk more reputational damage (can it go lower?), although some, such as Suncorp and MyState have already reacted by lifting rates. And if you look carefully average mortgage rates are already a little higher, and deposit rates continue to be cut. But all done quietly, and not enough to repair margins.
Second, the current behaviour we are seeing is the offer of significant discounts for some new and refinanced mortgage loans, especially principal and interest loans with lower LVRs, because banks need to grow their mortgage books to sustain shareholder returns. And mortgage growth is slowing.
Third, its worth understanding what proportion of bank funding is based on short term, and overseas funding. Perfectly timed was a speech – Some Features of the Australian Fixed Income Market, by Christopher Kent, RBA Assistant Governor (Financial Markets) in Tokyo.
The reduced use of offshore funding by the banks has been offset by much greater use of domestic deposits . The big shift away from short-term debt towards deposits started around the time of the global financial crisis. These changes were in response to the demands of the market and those of regulators for banks to make greater use of more stable sources of funding.
While the use of short-term debt (i.e. less than one year) is less than it was, it still accounts for around 20 per cent of banks’ funding. And about 60 per cent of that debt (on a residual maturity basis) is raised offshore. Global money markets, in the United States and elsewhere, provide the Australian banks with a much deeper market with a wider investor base than the relatively small domestic market. This short-term debt is issued in foreign currency terms, but the banks fully hedge their exchange rate (and interest rate) exposures at relatively low cost.
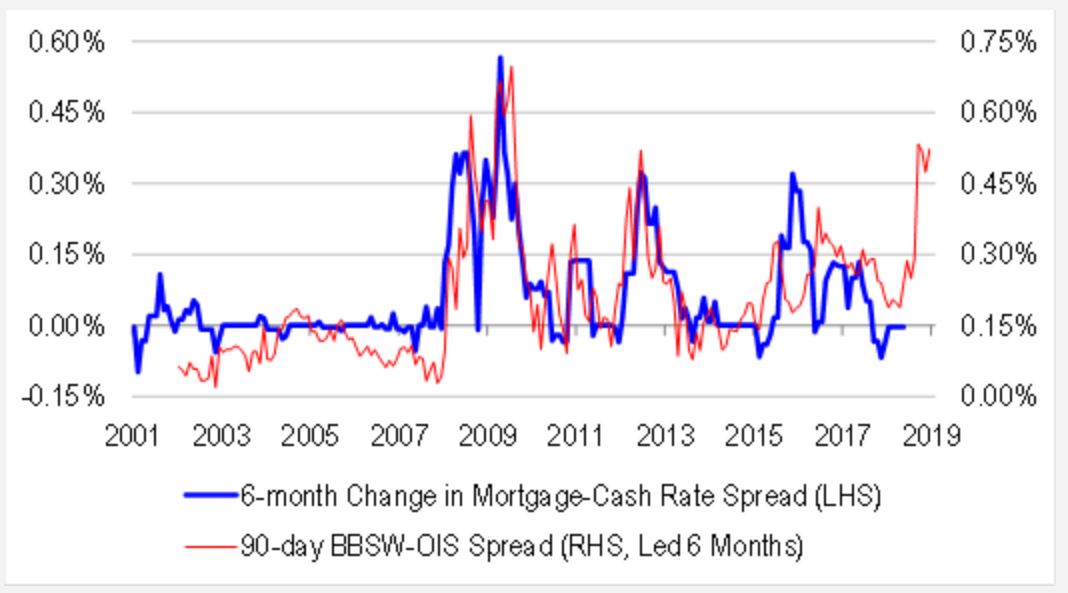
Because Australian banks raise a portion of their funding in US money markets to finance their domestic assets, they responded to higher US rates earlier this year by marginally shifting towards domestic markets to meet their needs. Hence, the rise in the US 3-month LIBOR rate (relative to the Overnight Index Swap (OIS) rate) was closely matched by a rise in the equivalent 3-month bank bill swap rate (BBSW) spread to OIS in Australia; similarly, the two spreads have declined of late by similar orders of magnitude (relative to their respective OIS rates). Equivalent spreads in some other money markets around the world also moved higher, though to a lesser extent than spreads in Australia. In contrast, rates in the euro area and Japan were not affected by the tightness in the US markets. That difference appears to reflect the fact that although European and Japanese banks tap into US money markets, they do so largely to fund US dollar assets.
Changes in BBSW rates in Australia feed through to banks’ funding costs in a number of ways. First, they flow through to rates that banks pay on their short- and long-term floating rate wholesale debt. Second, BBSW rates affect the costs associated with hedging the risks on banks’ fixed-rate debt, with the banks typically paying BBSW rates on their hedged liabilities. Third, interest rates on wholesale deposits tend to be closely linked to BBSW rates.
In short, the costs of a range of different types of funding have risen a bit for Australian banks in the past few months. But they remain relatively low and pressures in short-term money markets have eased, with BBSW about 10 basis points lower than its recent peak (relative to OIS). While some business lending rates are closely linked to BBSW rates – and so have increased a little – there have been few signs to date of changes to rates on loans for housing or small businesses.
Yeh, right…
In summary, banks are exposed to short term funding cost moves, 20% of the funding is short term, and 60% of that off-shore. As for the pressure on rates, well Credit Suisse just put out an interesting note highlighting the state of money markets.
Interbank credit spreads are back at financial crisis highs. And our modelling suggests that we should expect to see both sharp tightening of bank lending standards, and out of cycle rate hikes. Therefore, even without doing anything, the RBA will find that financial conditions are getting tighter.
A quick bit of modelling suggests that banks will need to lift rates, and soon to address the profit compression suggested in the money market movements (yet alone paying the various agreed settlement costs and fees in some banks’ operations). We discussed this a week or so back.
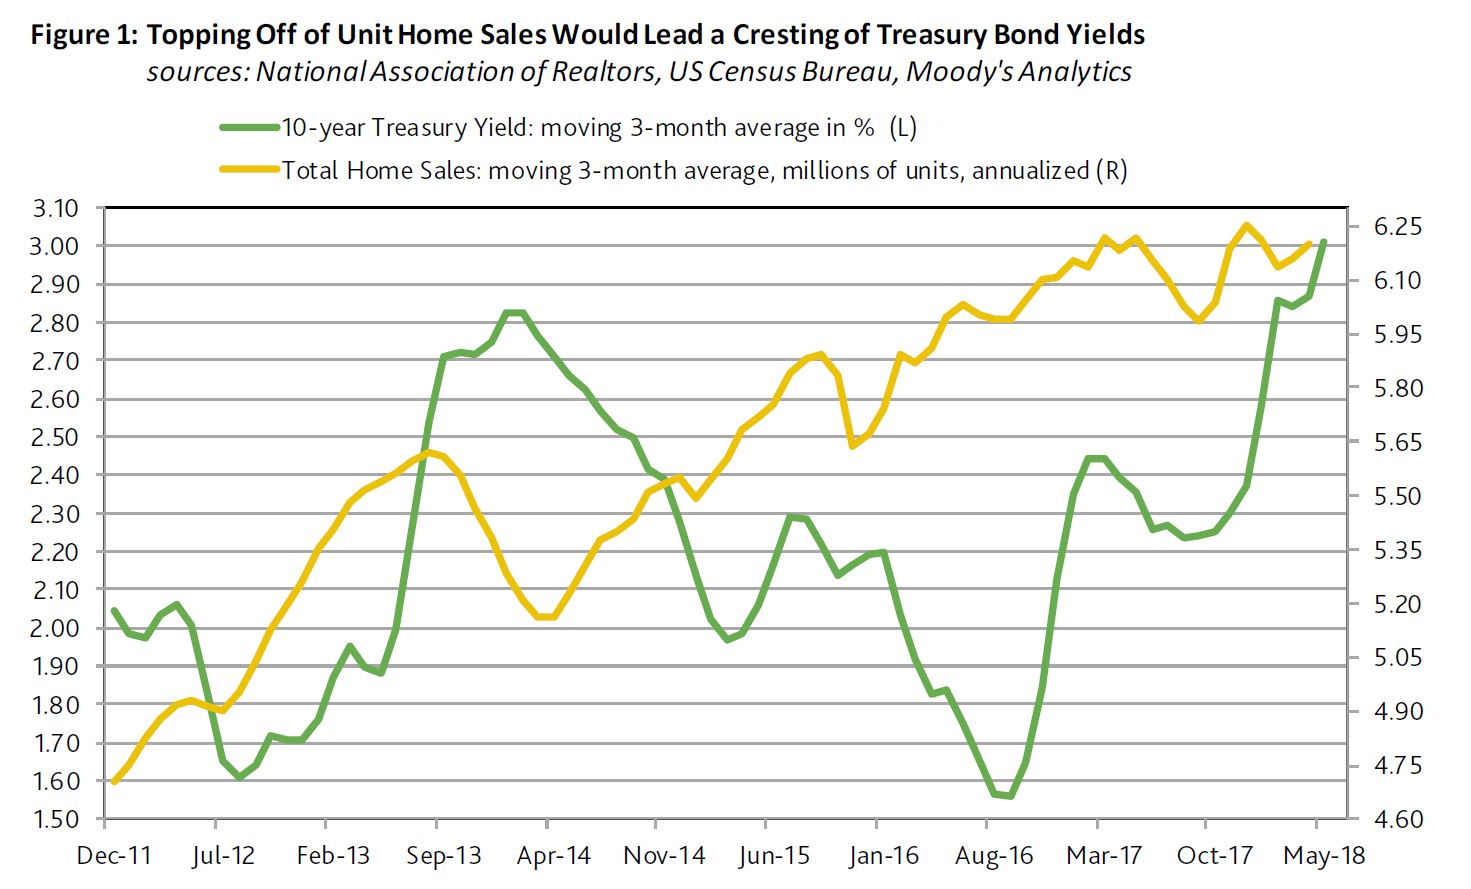
The return of a 3% 10-year Treasury yield is making itself known in the housing industry. Markets have already priced in a loss of housing activity to the highest mortgage yields since 2011, according to Moody’s. They conclude that just as it is overly presumptuous to predict the nearness of a 4% 10-year Treasury yield, it is premature to declare an impending top for the benchmark Treasury yield.
Thus far in 2018, the 11% drop by the PHLX index of housing-sector share prices differs drastically from the accompanying 3% rise by the market value of U.S. common stock. In addition, the CDS spreads of housing-related issuers show a median increase of 78 bp for 2018-to-date, which is greater than the overall market’s increase of roughly 23 bp. Finally, 2018-to-date’s -1.97% return from high-yield bonds is worse than the -0.13% return from the U.S.’ overall high-yield bond market. Despite the lowest unemployment rate since 2000, the sum of new and existing home sales dipped by 0.7% year-over-year during January-April 2018. Unit home sales may not soon accelerate by enough to strengthen the case for higher Treasury yields. First-quarter 2018’s average index of pending sales of existing homes contracted by 11.5% annualized from 2017’s final quarter on a seasonally-adjusted basis, while shrinking by 3.7% year-over-year before seasonal adjustment. The recent record suggests that the 10-year Treasury yield will ultimately follow home sales.
March 2018’s 7% yearly drop by the NAR’s index of home affordability showed that the growth of after tax income was not rapid enough to overcome the combination of higher home prices and costlier mortgage yields. March incurred the 17th consecutive yearly decline by the home affordability index. The moving three-month average of home affordability now trails its current cycle high of the span-ended January 2013 by 23%.
Fewest Applications for Mortgage Refinancings since 2000
The highest effective 30-year mortgage yield in seven years has depressed applications for mortgage refinancings. For the week-ended May 18, the MBA’s effective 30-year mortgage yield reached 5.01% for its highest reading since the 5.04% of April 15, 2011. The effective 30-year mortgage yield’s latest fourweek average of 4.95% was up by 63 bp from the 4.32% of a year earlier.
The yearly increase by the effective 30-year mortgage yield’s moving four-week average last swelled by at least 63 bp during the span-ended July 12, 2013. The 10-year Treasury yield’s month-long average would climb from July 2013’s 2.56% to a December 2013 peak of 2.89%. Thereafter, a decline by unit home sales had helped to lower the 10-year Treasury yield to 2.53% by July 2014.
As of May 18, 2018, the Mortgage Bankers Association’s seasonally-adjusted weekly index of applications for mortgage refinancings sank to its lowest reading since December 29, 2000. Nevertheless, it should be noted that the MBA commenced a new sample on September 16, 2011. During the four-weeks-ended May 18, applications for mortgage refinancings sank by 19.6% year-overyear.
Moreover, the latest moving 13-week average of applications for mortgage refinancings is a very deep 77.8% under its current cycle high of October 12, 2012. By contrast, mortgage applications from prospective homebuyers are holding up much better. During the four weeks ended May 18, the MBA’s average index for homebuyer mortgage applications dipped by 0.9% from the contiguous four-weeks-ended April 20, 2018, as the year-over-year increase slowed from April 20’s 6.6% to May 18’s 3.5%.
The sum of new and existing sales of single-family homes sank annually in only nine of the calendar years since 1988. In eight of those nine years, the 10-year Treasury yield’s yearlong average fell in the following calendar year. For the nine years following a drop by single-family home sales, the median annual change for the 10-year Treasury yield’s yearlong average was -41 bp.
In summary, the longer that higher interest rates weigh on business activity and financial markets, the closer is a peak for bond yields. Nonetheless, just as it is overly presumptuous to predict the nearness of a 4% 10-year Treasury yield, it is premature to declare an impending top for the benchmark Treasury yield.
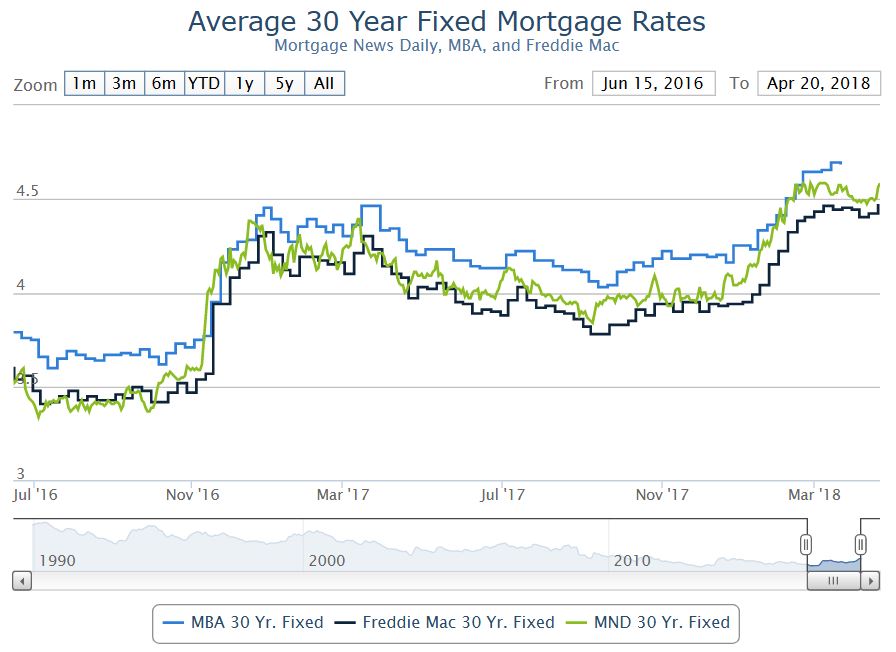
The latest US data shows mortgage rates in the US continue higher. And more to come.
Here is the latest commentary from the Mortgage Rates Newsletter.
Let’s clear one thing up before we begin. Freddie Mac, MBA, and Ellie Mae all noted new 4-year highs in mortgage rates this week. They are all technically wrong. This has to do with the way their data is collected and/or averaged. And while I have no doubt that they are accurately conveying the results of their data collection efforts according to their methodology, there is a more accurate way to do things. Specifically, we can track actual lenders’ rate sheets every day.
Even if we take an average of that daily data, we still find that rates aren’t quite back to 4-year highs just yet. Depending on the lender, these occurred on one of the days near the end of February. In fact, some lenders’ rates from March 21st are still higher than today’s. Are we talking about very big differences between now and then? Not at all! But if we’re going to talk about rates hitting 4-year highs, we might as well be precise about it.
One thing everyone can agree on is that today’s rates are higher than yesterday’s, which in turn, were higher than Wednesday’s. The lion’s share of that move higher happened yesterday, but today’s underlying bond market movement suggests there’s a bit more pain yet to be priced-in to the average lender’s mortgage rate sheets.
More evidence of the rising costs of funds as ME Bank says it has lifted its standard variable rate on existing owner-occupier principal and interest mortgages, effective today, 19 April 2018.
ME’s standard variable rate for existing owner-occupier principal-and-interest borrowers with an LVR of 80% or less, will increase by 6 basis points to 5.09% p.a. (comparison rate 5.11% p.a.^).
Variable rates for existing investor principal-and-interest borrowers will increase by 11 basis points, while rates for existing interest-only borrowers will increase by 16 basis points.
ME CEO Mr Jamie McPhee said the changes are in response to increasing funding costs and increased compliance costs.
“Funding costs have been steadily increasing over the last few months primarily due to rising US interest rates that have flowed through to higher short-term interest rates in Australia.
“In addition, ME continues to transition its funding mix to ensure the requirements of the Net Stable Funding Ratio will be met, and this is also increasing our funding costs.
“At the same time, industry reforms and increasing regulatory obligations are increasing our compliance costs.
“Despite these increases ME’s standard variable home loan for owner-occupier principal-and-interest borrowers with LVR 80% or less, is still lower than the major banks as it has been since ME became a bank in 2001. In addition ME also continues to offer some of the highest deposit rates in the market.
“This was not an easy decision, but rising costs have forced us to reset prices to maintain a balance between borrowers, depositors and our industry super fund shareholders and their members, all while ensuring we continue to grow and provide a genuine long-term banking alternative,” McPhee said.
“We will continue to assess market conditions and make changes to prices to maintain this balance if necessary.”
More hikes will follow, across the industry together with reductions in rates paid on deposits as the fallout of the Royal Commission and higher international funding costs take their toll.
The 10-year US Bond rate is moving higher again, following some slight fall earlier in April. Have no doubt, funding cost pressure will continue to rise.
^Home loan comparison rates calculated on a loan of $150,000 for a term of 25 years, repaid monthly.