We have had an avalanche of requests for further information about our monthly mortgage stress research which is published as a series of blog posts plus coverage in the media, including Four Corners. Here is the timeline of recent posts, which together provides a comprehensive view of the work.
Here is a segment in which we discuss our latest research into the probability of default modelling in a rising interest rate environment. We highlight the rise of the “Affluent Stressed” households.
Property buyers in some of the nation’s swankiest suburbs are among those under most stress keeping up mortgage repayments, according to an analysis by postcode of income and debt levels.
The young affluent in plush inner suburbs living the high life are more likely to be financially derailed by rising costs than battlers in new estates on the suburban outer fringes, the analysis reveals.
Households in Melbourne’s gilt-edged Toorak, about 8 kilometres south-east of the central business district, where median house prices are $3.5m and $845,000 for apartments, are five times more likely to default on mortgage payments than the national average.
It’s the same probability in Bondi, about 8 kilometres south-west of the central business district, where median prices are about $2.5m for a house and $1m for an apartment.
Other suburbs on Sydney’s North Shore, such as Gordon and Hornsby, are also among the addresses where hundreds of households are on the financial edge of a 30-day default, which is a late mortgage payment.
“Everyone focuses on Western Australia and Queensland but there is a much broader group of households that are closer to the edge and will find it difficult to cope if interest rates go up,” according to Martin North, principal of Digital Finance Analytics, a research company that used 26,000 household surveys to make the predictions.
A late payment demonstrates financial stress and is a long way from an absolute default, or forced sale.
His analysis identifies the amount of headroom households have by stress testing their income against the size of mortgage, whether they have paid ahead and other financial commitments, such as rising fuel, electricity and child minding.
More than 16,000 mainland households are among the nation’s top 20 twenty most vulnerable postcodes and thousands more are at risk of falling behind in payments of interest or principal on their home loan, it finds.
Probability of the top 20 households’ defaulting on mortgage repayments over the next 12 months range from about 3 per cent to 5 per cent, according to the analysis. A probability rating of more than 2 per cent is “significant”, Mr North said.
Standard & Poor’s Australia, the ratings agency, said most borrowers will stay on top of their mortgage repayments while unemployment levels are relatively stable and interest rates low. Its analysis is based on historical data.
Fixed and variable rates for investors and owner occupiers are rapidly increasing from record lows as the cost of capital funding on international markets has soared in the past two months.
More than 200 mortgage products have increased in the past two months by up to 65 basis points as borrowers recalibrate their loan books in response to a 30 per cent increase in the US 10-year treasury benchmark.
These rises are out-of-cycle to the Reserve Bank of Australia’s (RBA) cash rate movements.
Bankers, such as David Carter, chief executive of Suncorp banking and wealth, are warning rising funding costs is a “trend that is unlikely to change”.
“Generally we expect rates to rise, driven mainly by an expected rise in mortgage rates, as employment and wages growth remain within their current bounds,” said Mr North.
AMP, the nation’s largest financial conglomerate, is the latest to increase rates.
Last Friday (6 Jan) it increased variable interest rates for residential investment loans by 15 basis points for new customers. The same new rate for existing residential investment loans applies from today. (9 Jan)
Most exposed are the young affluent that have taken out large mortgages to pay top prices in an over-heated housing market for houses and apartments, often about inner suburbs where excessive supply is impacting prices.
“Although affluent, many at risk households are grossly over-committed, with little free cash,” Mr North said about young, professional poor-rich in posh inner suburban suburbs of Melbourne and Sydney who are highly leveraged, making minimum repayments and have static income.
“They would be disproportionately impacted by even a small rise,” he said.
Latest RBA analysis shows a sharp rise in debt of about 6.5 per cent over the past year, much higher than income growth.
Latest all-cities average dwelling price from research company CoreLogic, estimates a national increase of nearly 11 per cent in the past 12 months, overwhelmingly concentrated in Sydney, which posted growth of more than 15 per cent, and Melbourne, about 14 per cent.
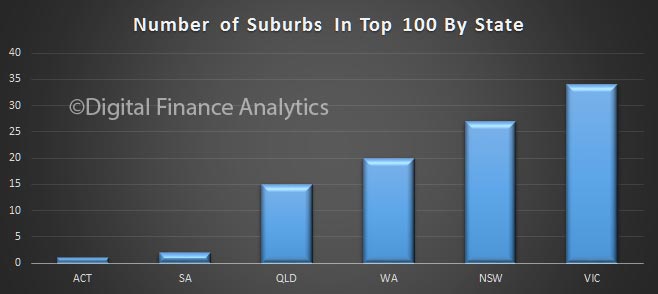
Western Australia, where house and apartment prices fell by 6 per cent during the past 12 months, dominate the top 20 list of stressed suburbs with nine postcodes, followed by Queensland with six.
Perth real estate agents are forced to provide live entertainment and free coffee to attract bidders to suburban auctions where prices plunged as the mining boom ended.
The DFA analysis shows around 20 per cent of nation’s households would have difficult with a rise of less than 0.5 per cent, another 4 per cent would be troubled by a rise of between 0.5 per cent and 1 per cent and only 35 per cent could cope with a 7 per cent rise.
“The property market will generally still be gaining ground this year, though some regions will be under significant pressure,” Mr North said. “Banks will be seeing losses rising a little, but defaults will remain contained.”
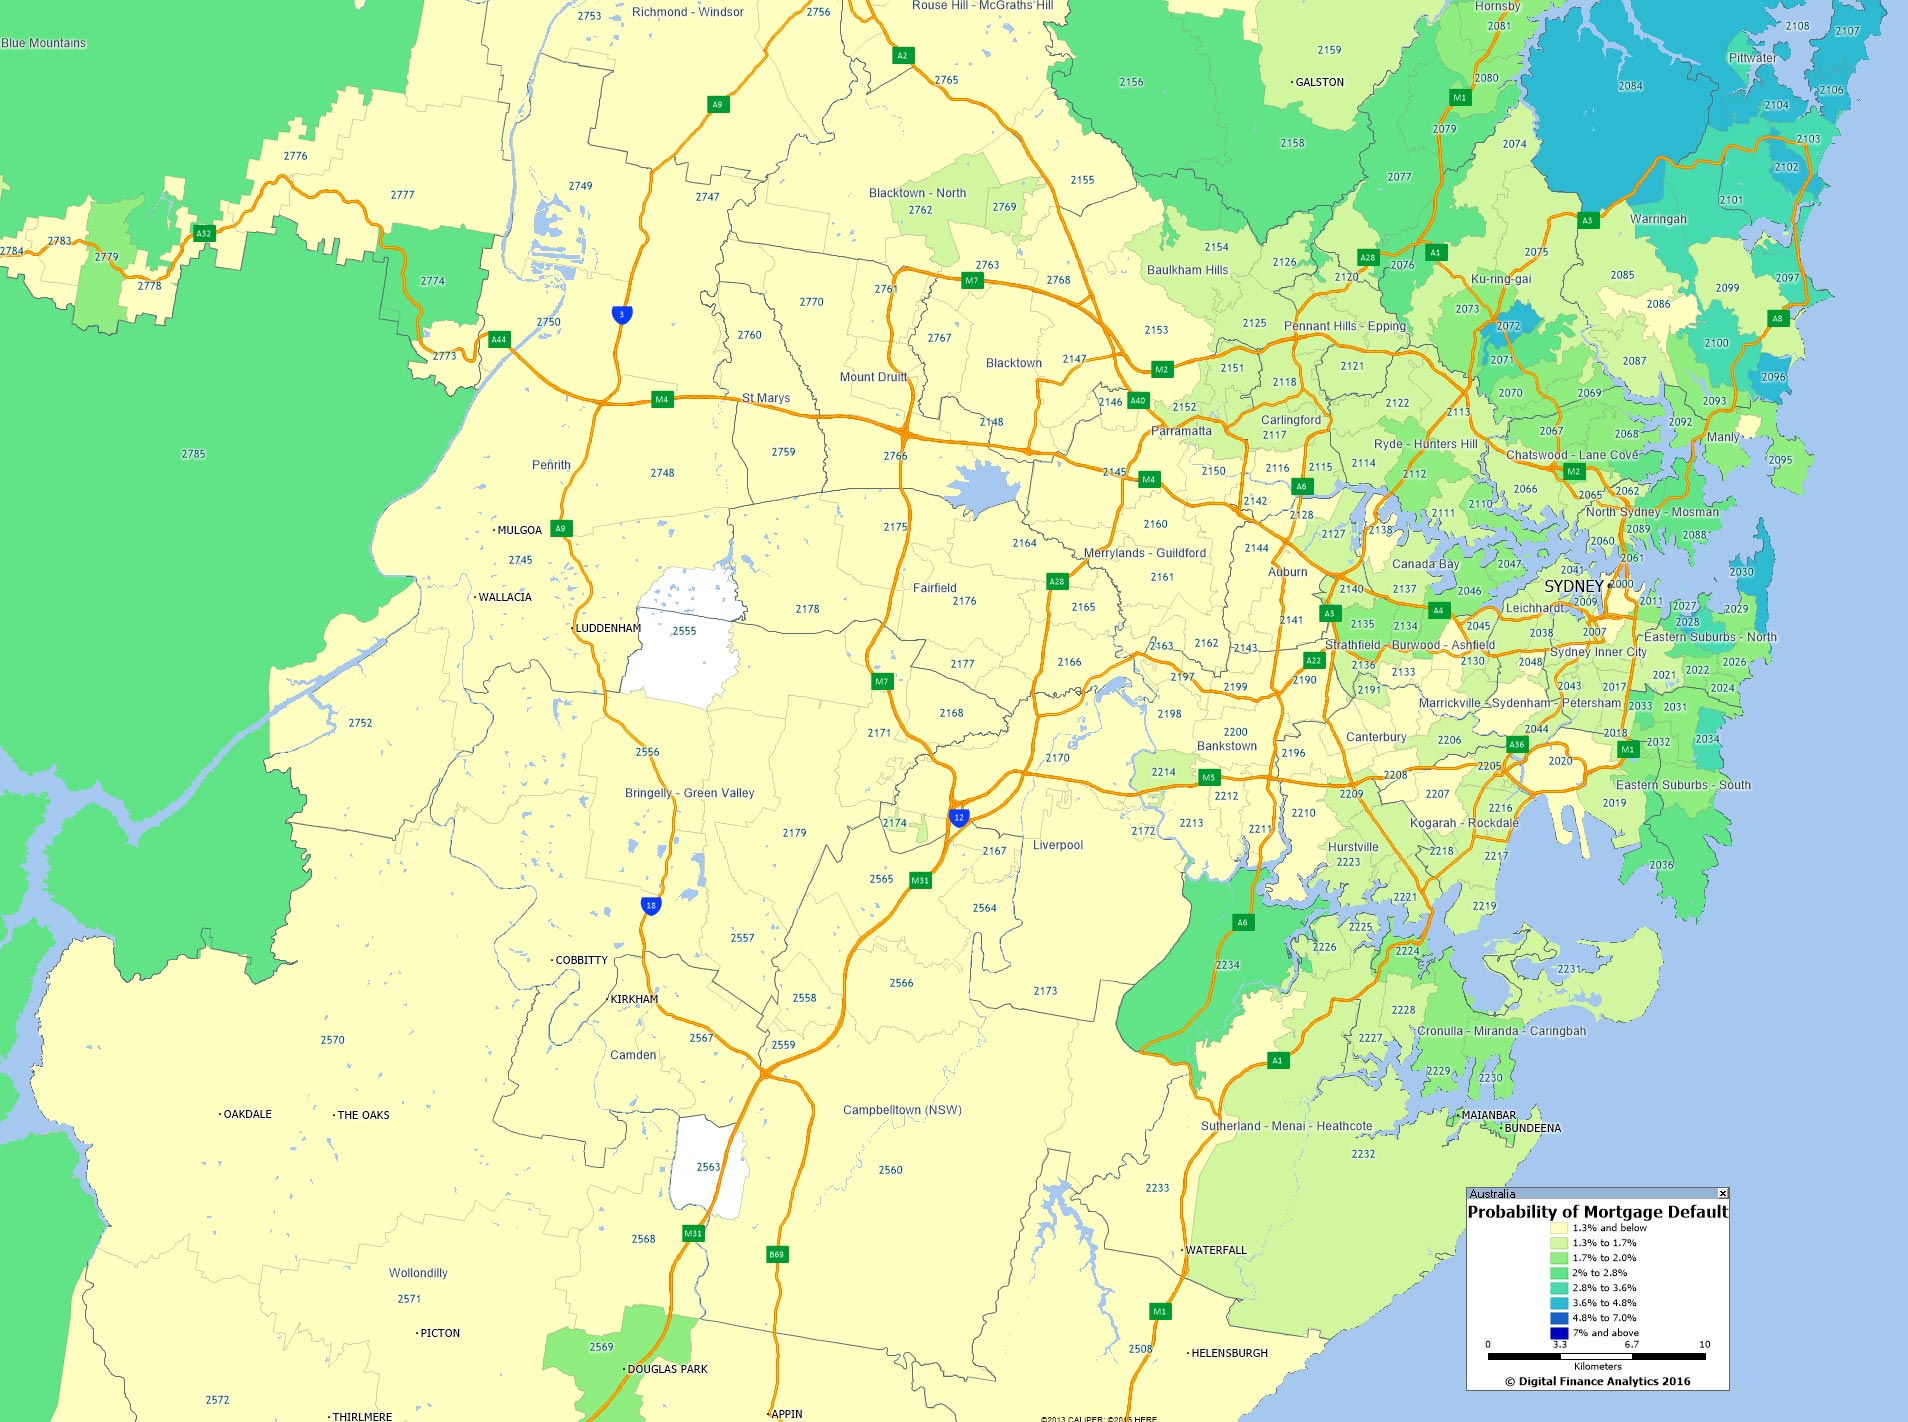
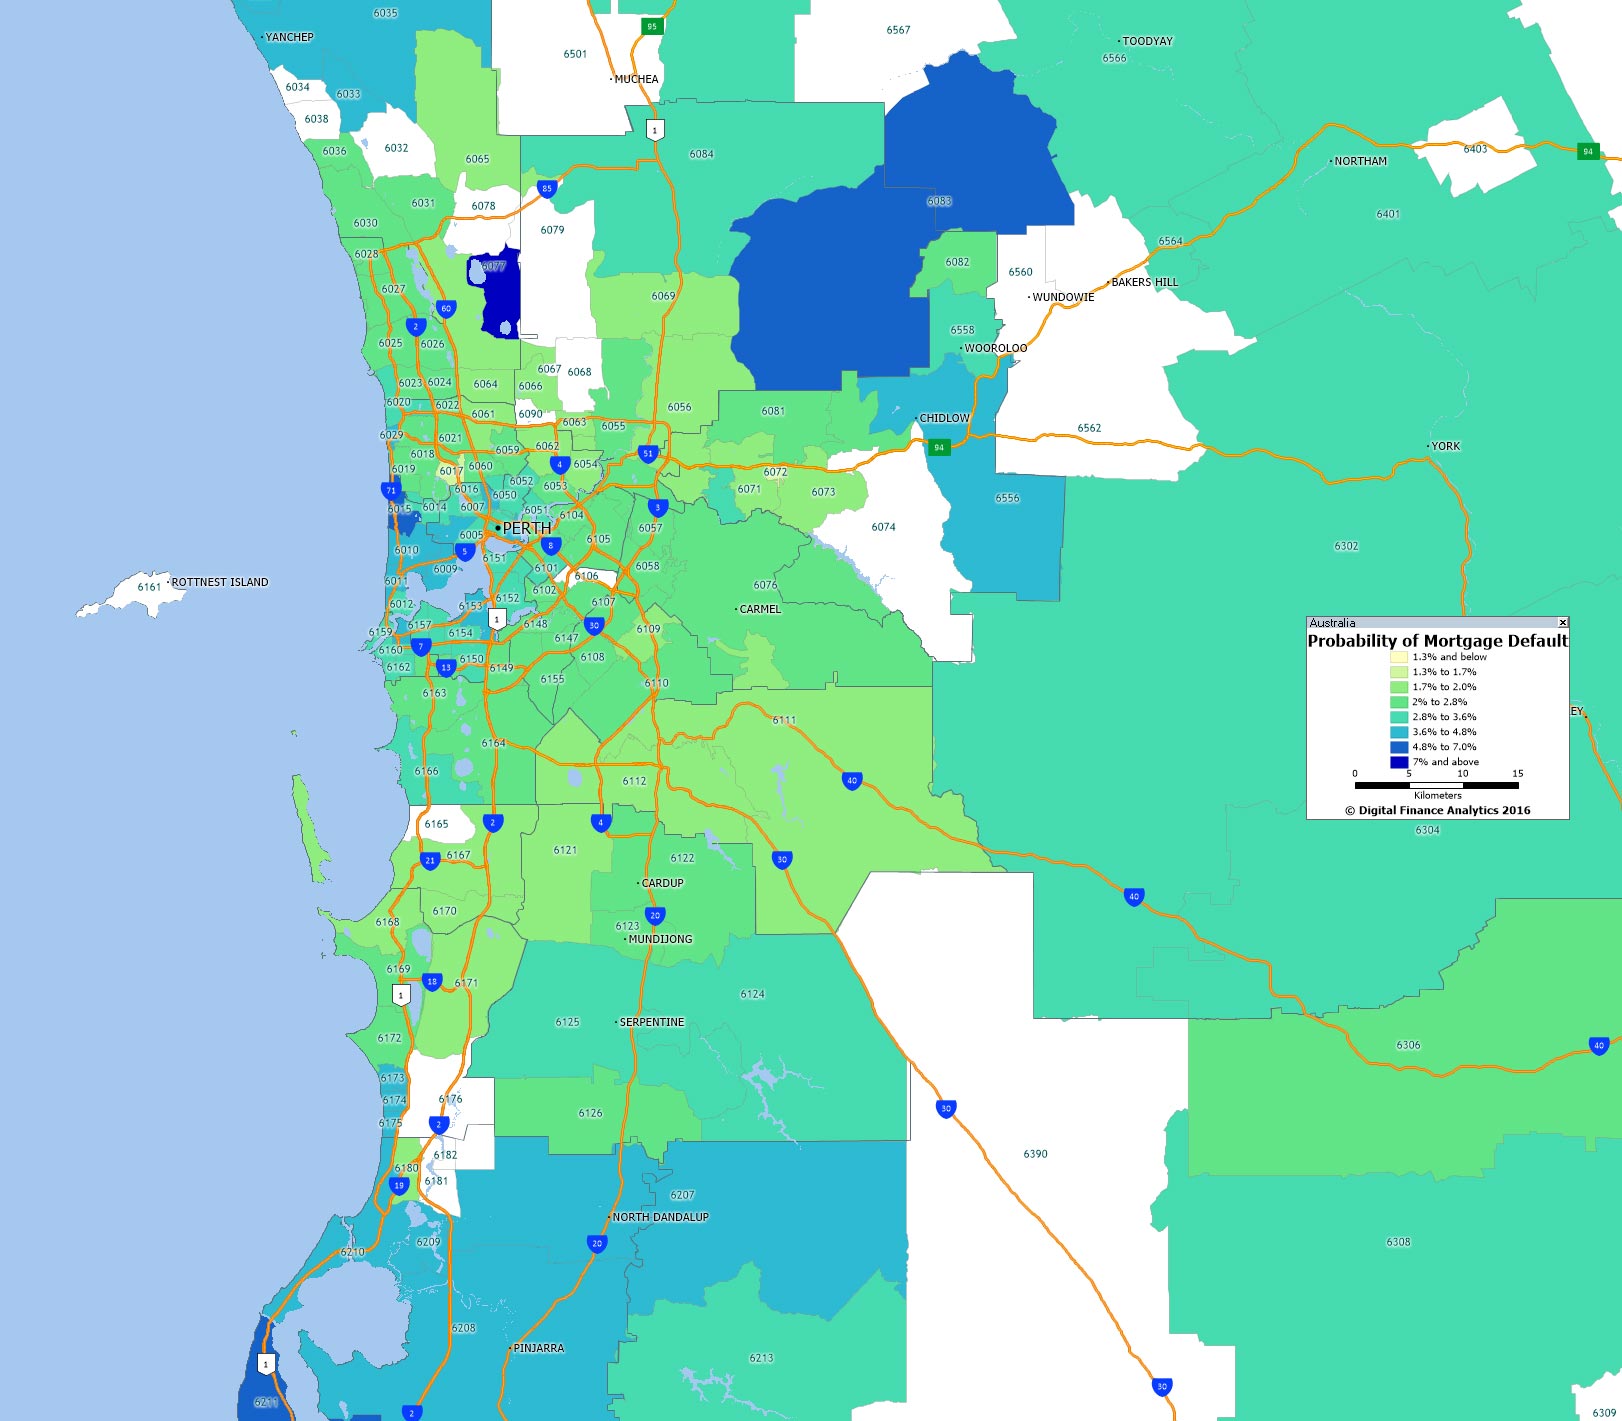
In our last post for 2016 we have geo-mapped the probability of mortgage default by post code across the main urban centres through 2017. You can read about our approach to the analysis here.
We start with Sydney, which is looking pretty comfortable.
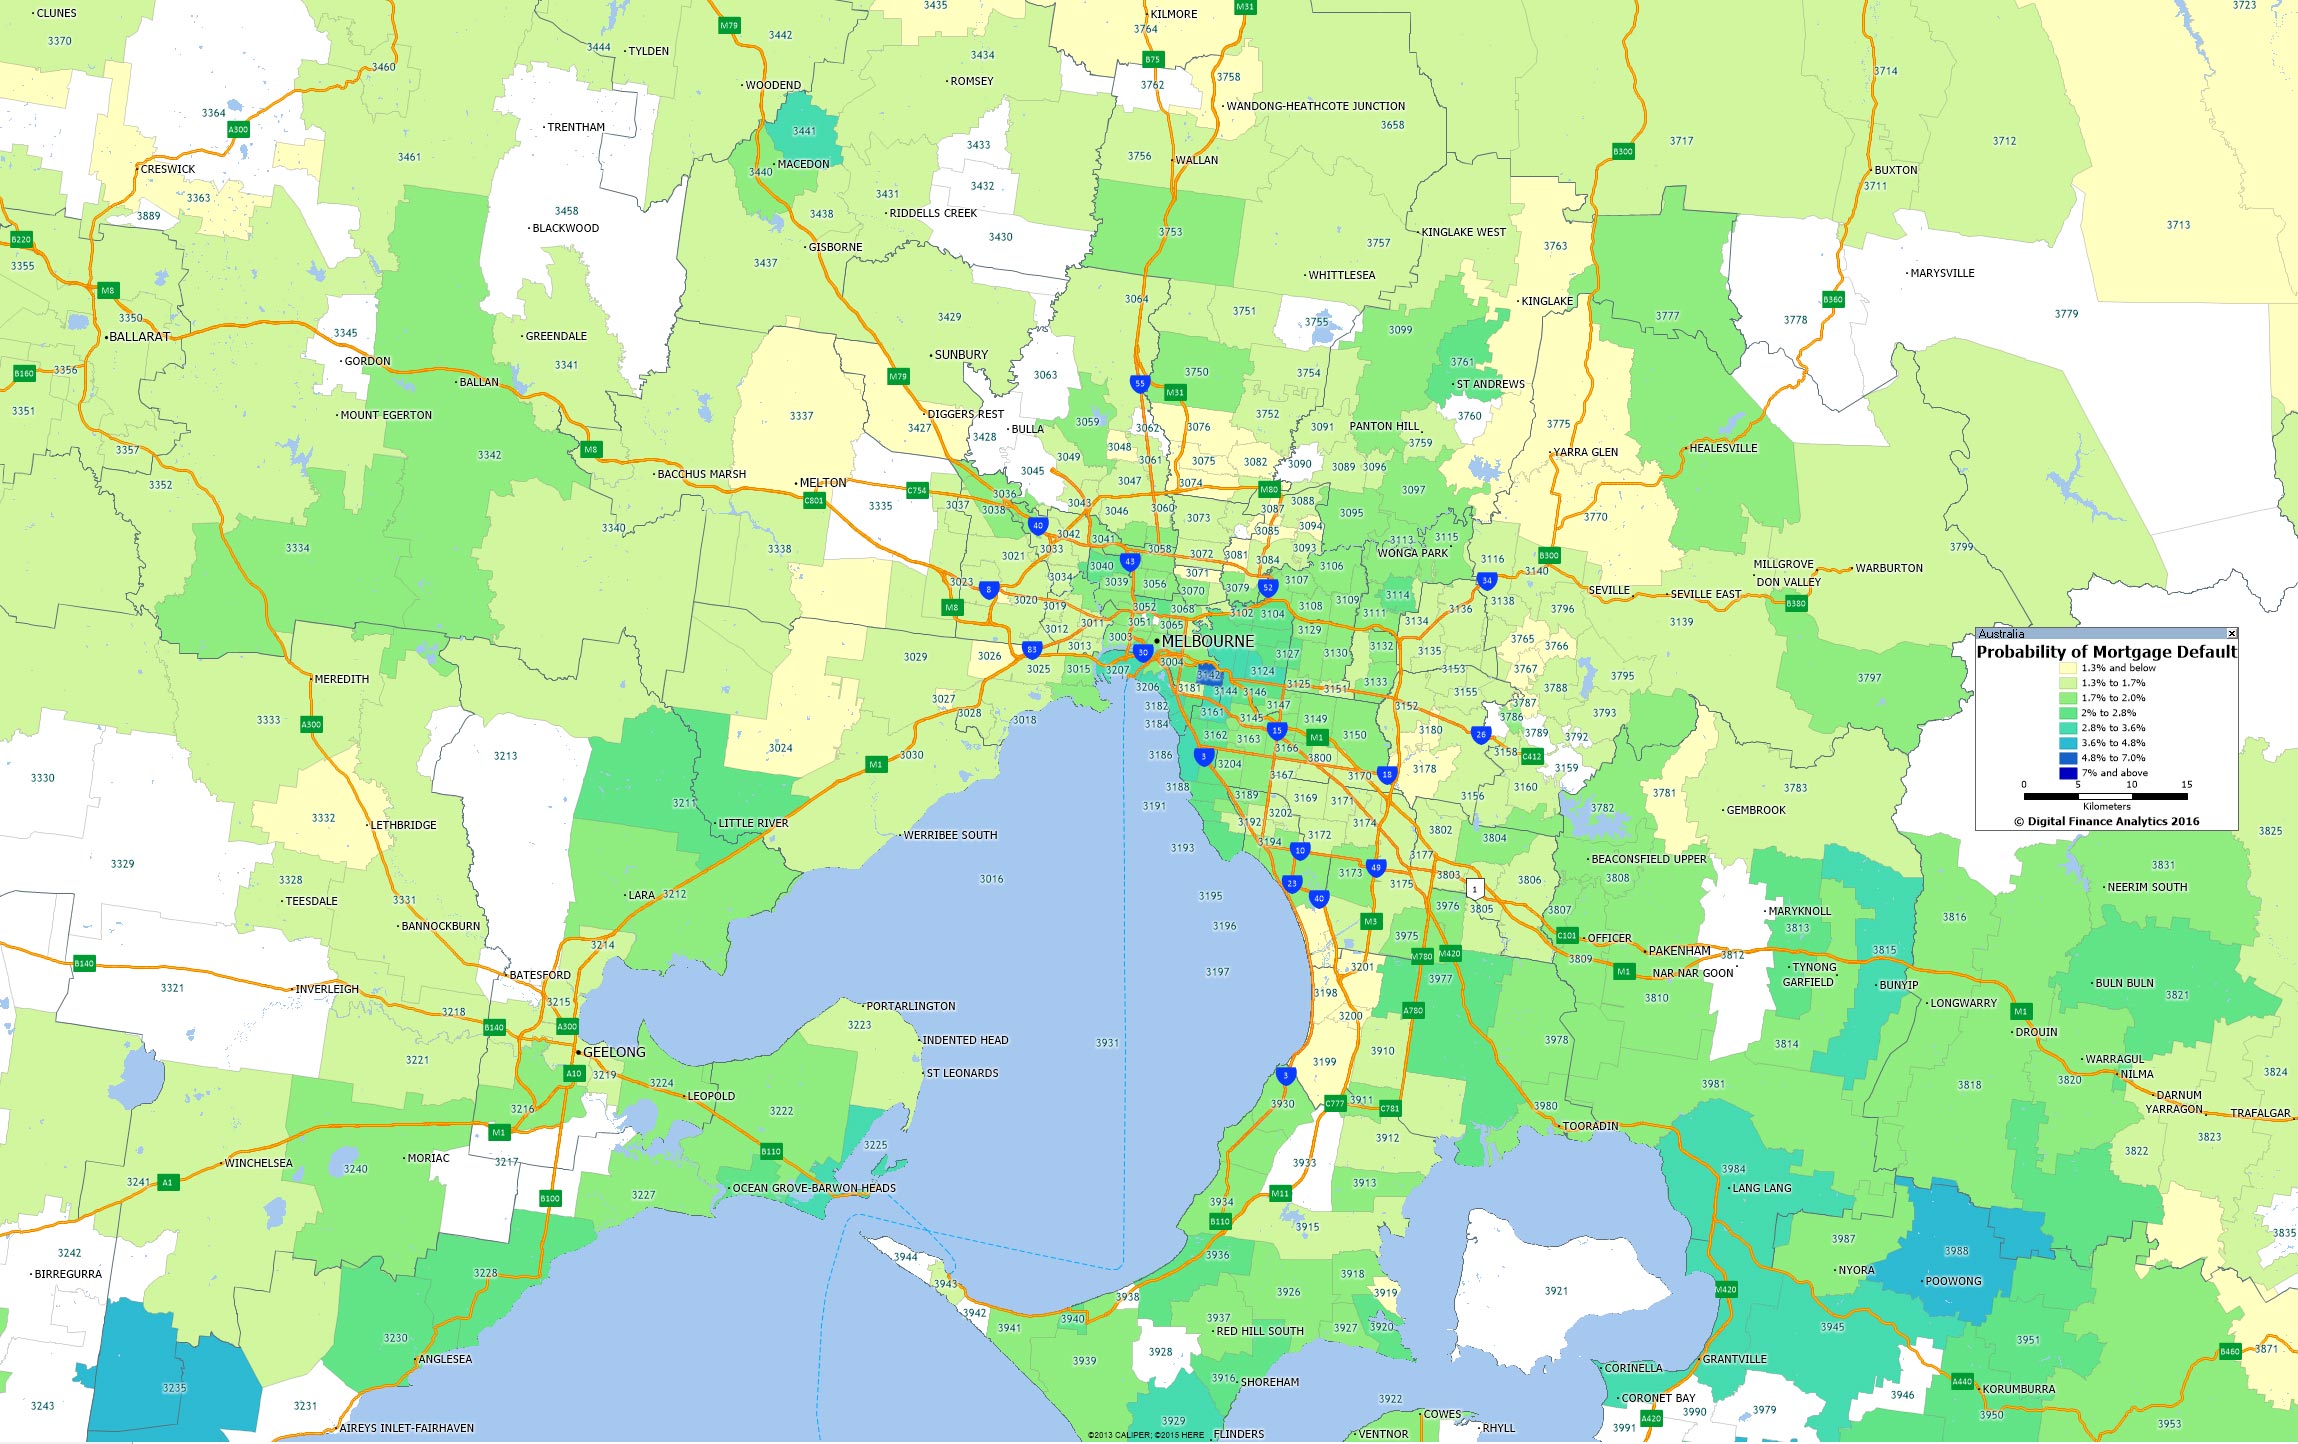
Melbourne is also looking reasonable, though with a few hot spots.
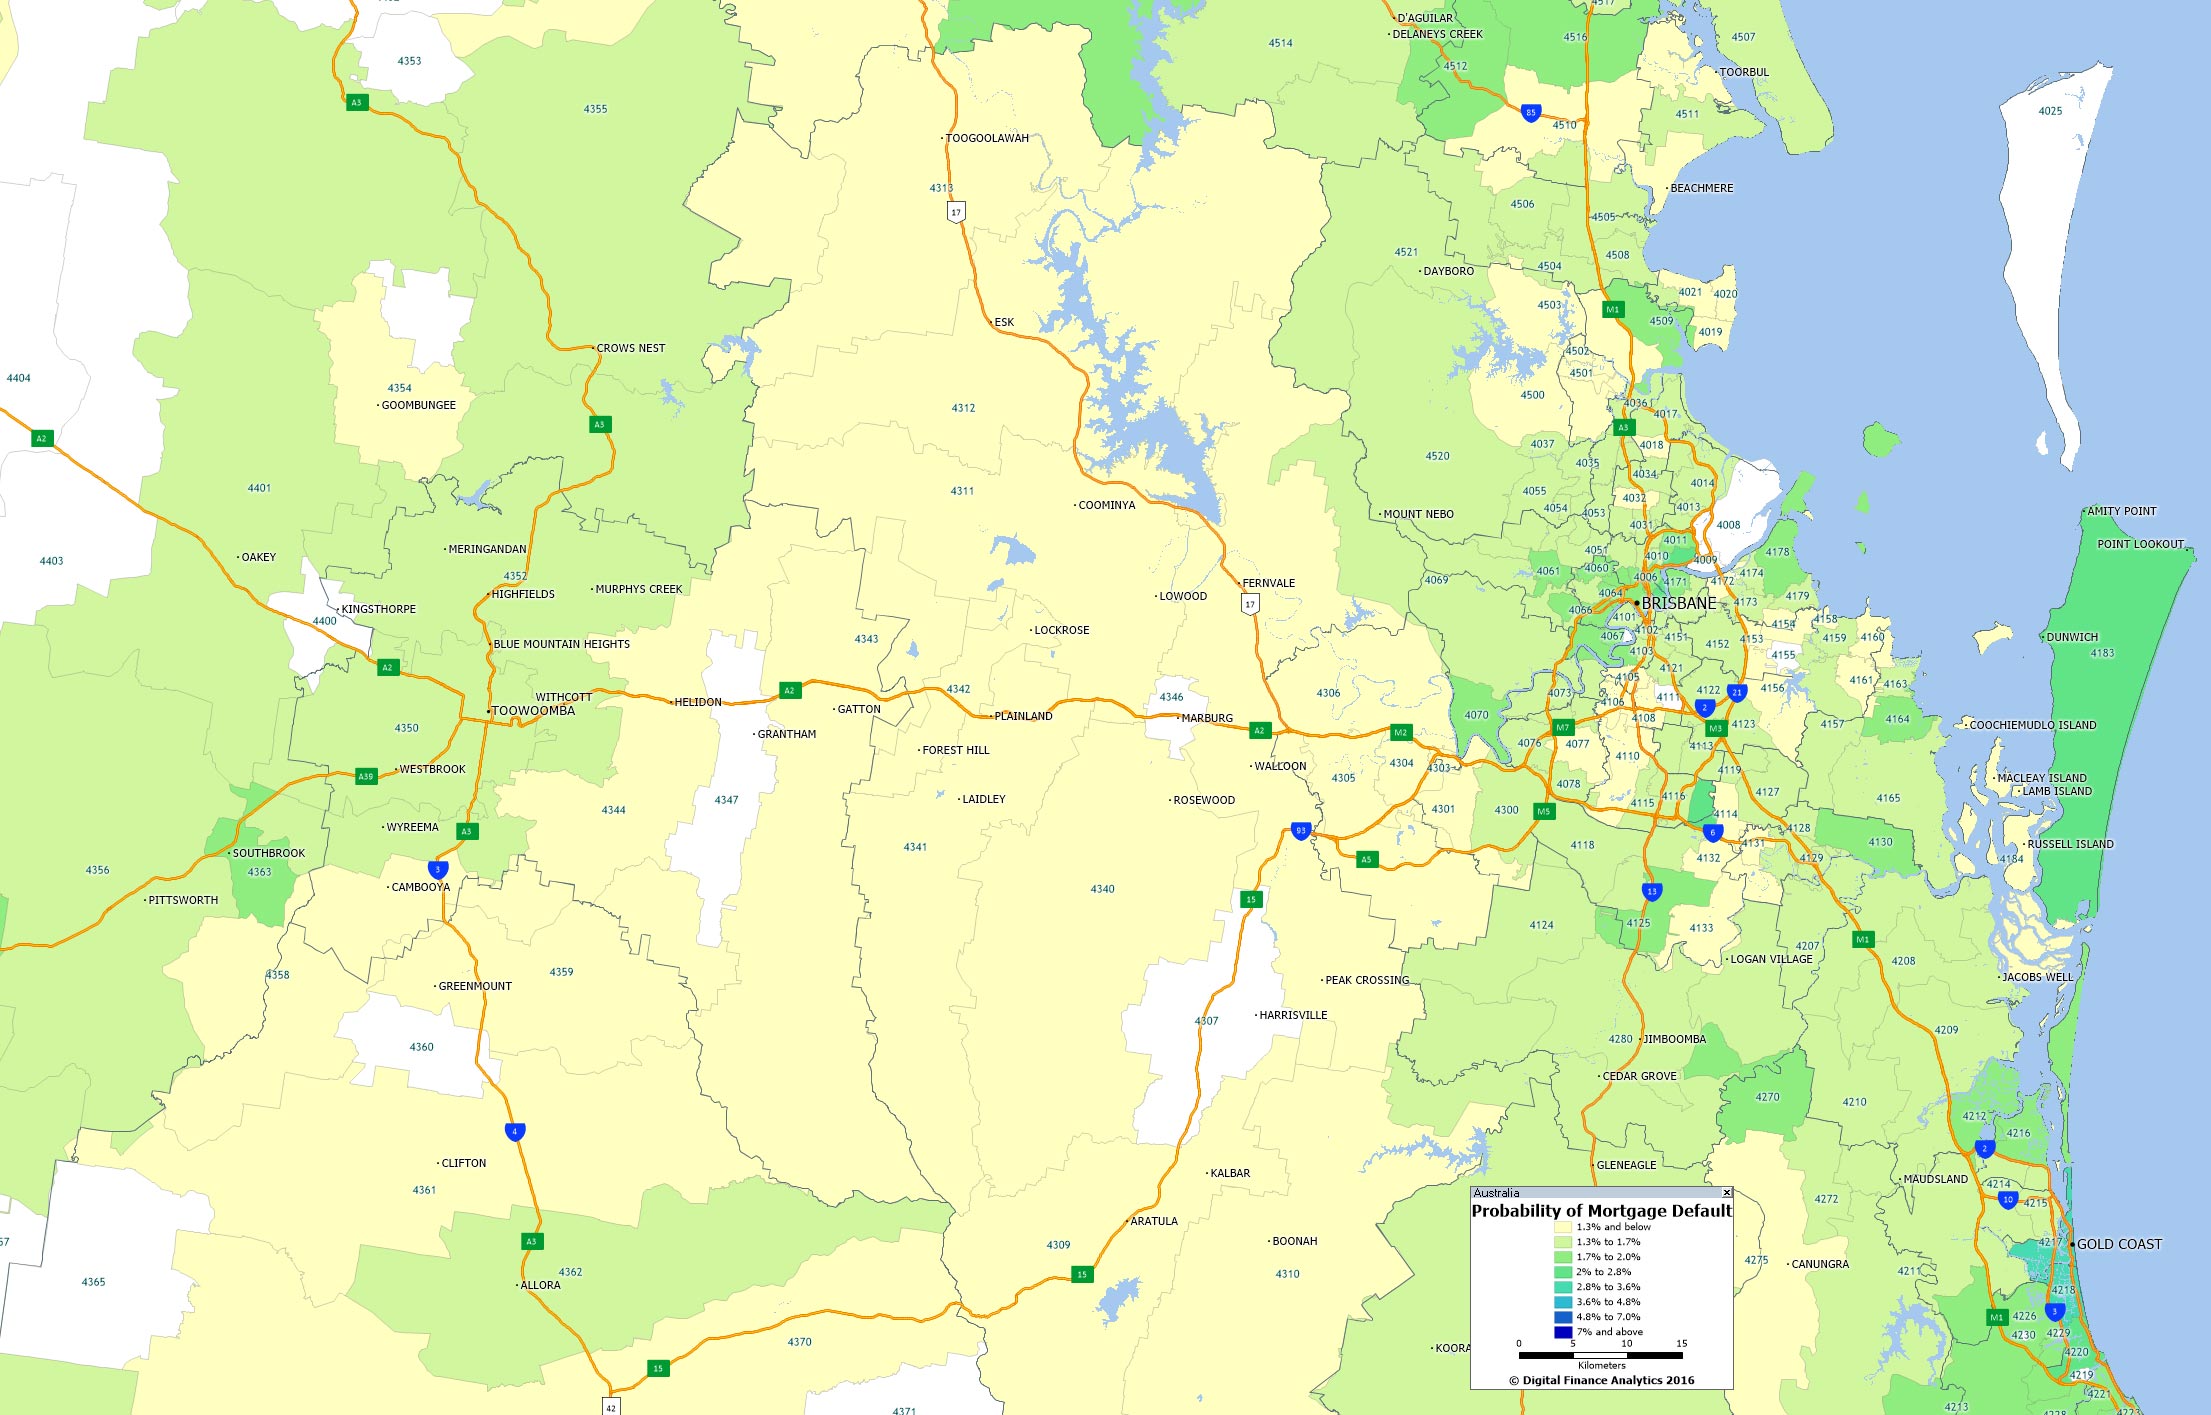
Brisbane default levels are also benign (though the mining areas are more at risk).
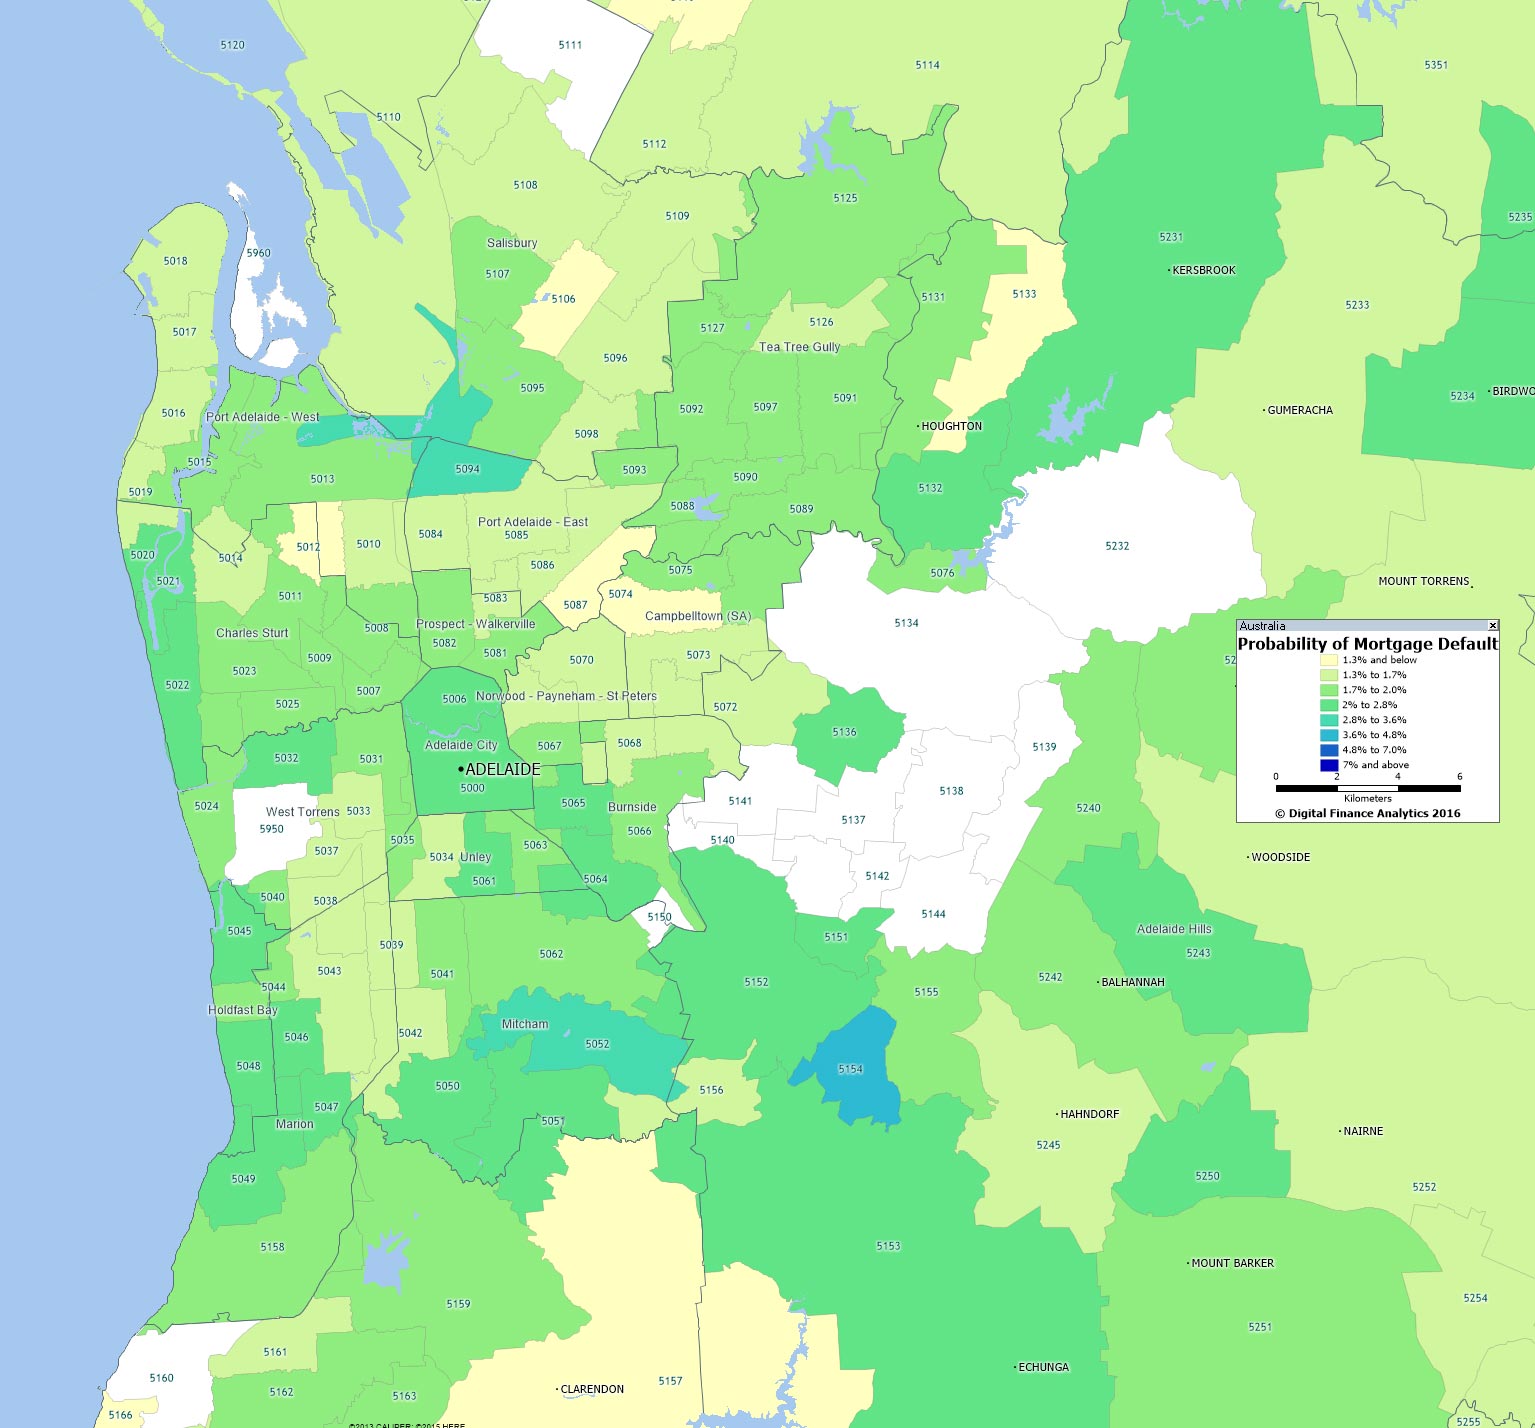
Adelaide shows a few hot spots.
But greater Perth is where we think much of the action will be – plus the mining areas beyond the urban area.
As we discussed, our prediction for 2017 is that the property market generally will still be gaining ground, though some regions will be under significant pressure. Banks will be seeing losses rising a little, but defaults will remain contained.
Thanks to those who followed the DFA blog in 2016. We wish you a peaceful new year. We will be back in 2017 with more intelligent insights.
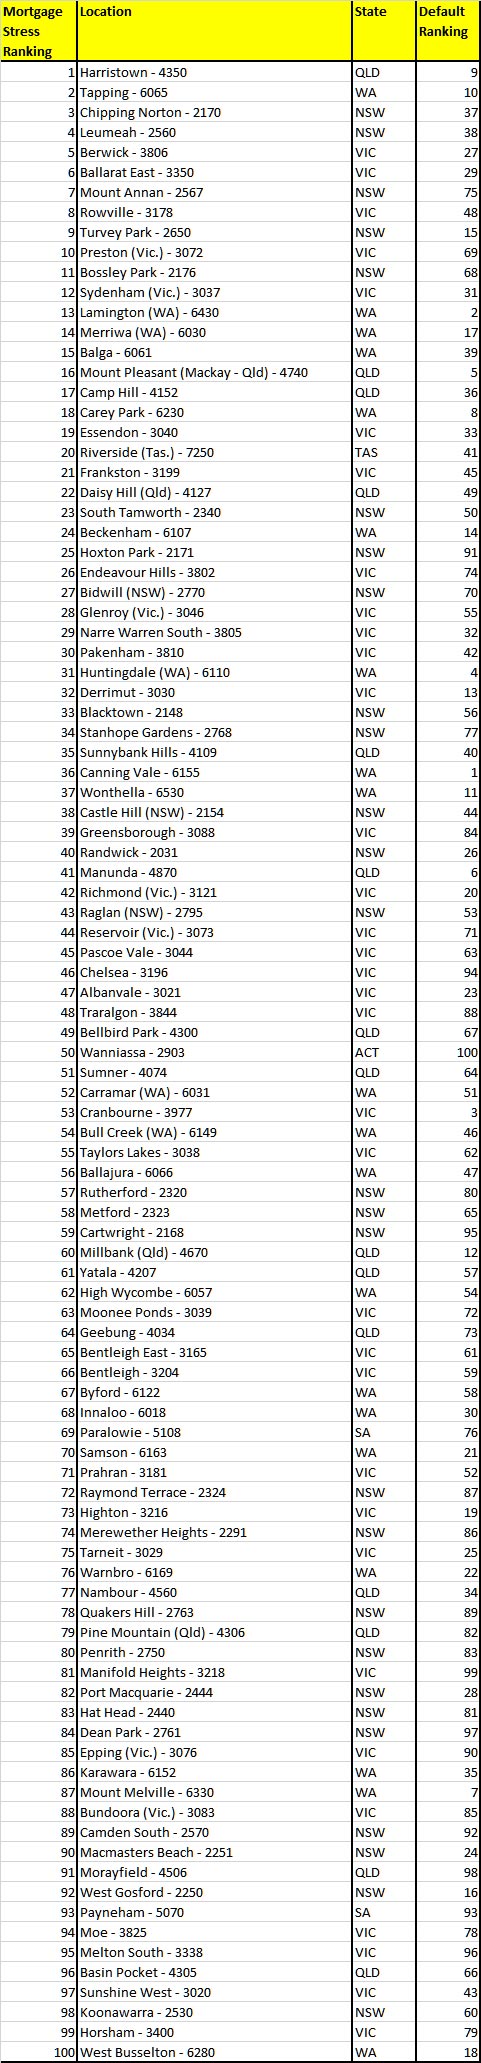
To complete our series on mortgage stress, based on our household surveys, here is the complete list of the top 100 most stressed suburbs, and their relative position on the default list, as at December 2016.
Victoria has the highest number of suburbs in the listing.
As we discussed yesterday, this is based on the absolute number of households in the suburb who are in difficulty. You can also watch our video blog where we discuss the research.
Running our risk models, we expect the banks to be reporting higher mortgage defaults next year, with a lift in write-offs from around 2 basis points, to 4 basis points. However, this is still at a low, and manageable level given the capital buffers they hold. We do expect provisions though to rise.
Using data from our household surveys in this new video blog we discuss the findings from our latest modelling. More than 22% of households are currently in mortgage stress, and 1.9% of households are likely to default. Both are likely to rise next year.
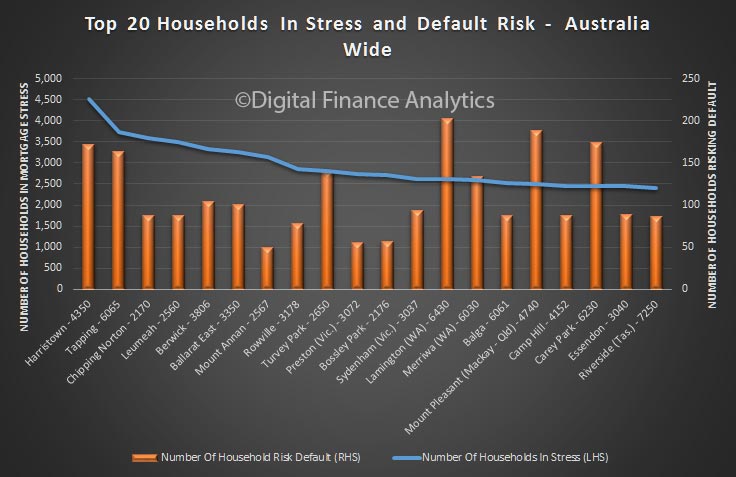
Now we get to the pointy end of our mortgage stress and default analysis. Today we list the top 20 post codes across Australia where the highest number of households currently in mortgage stress reside. We also reveal our estimate for the number of defaults which we expect to occur in the coming months.
It is worth saying that the percentage of households stressed or at risk of default, in a particular post code, varies considerably, but we have chosen to look at the actual number of households this represents. This is because there are a number of post codes where the percentage is very high, but off a very low number of householders. Statistically speaking such low numbers would make us less certain of the accuracy of the estimates. But by choosing to focus on the absolute number of households involved, the estimates are more firmly grounded. In any case the numbers involved, if larger, makes a material difference to the economy, and the banking system.
So, then, here is the list. The post code with the highest number of households in mortgage stress in December 2016 is Harristown – 4350 – in Queensland. It is about 109 kms from Brisbane. This area covers Toowoomba, Harristown, Glenvale and Rockville etc and a population of close to 60,000. Many of the households here are younger. Incomes are lower than the QLD average. More than 4,500 households there are in difficulty and more than 170 households in the district risk mortgage default.
Within the top 20 nationally, the post code with the highest level of default risk is Lamington, WA, a suburb of South East & Central. It is about 549 kms from Perth. The region includes Kalgoorlie, Lamington and Williamstown, etc. Many of these households are in the younger aged segments. Incomes are higher than the WA average. Here more than 2,600 households are in mortgage stress, and more than 200 are likely to default.
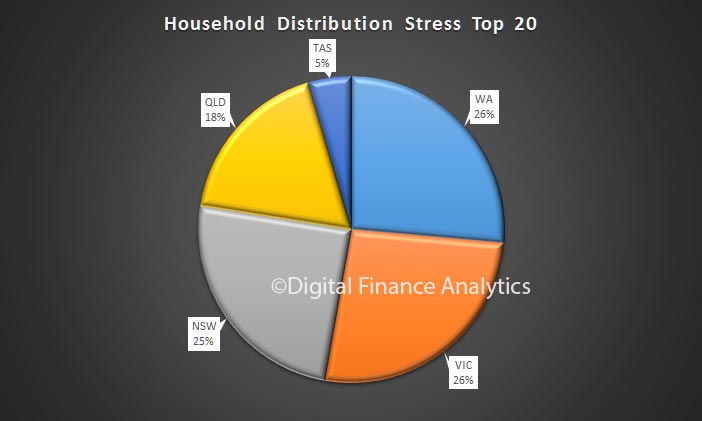
The distribution of stressed households in also interesting. Within the top 20, Western Australia has the largest number of households (26.4%), just ahead of Victoria (26.38%), but off a smaller population base. Shows the pressure on households in the west.
Next time we will look in more detail at some the state levels data.
As we continue our series on mortgage stress, using the latest data from our surveys, we look at how stress aligns with our core household and property owning segments.
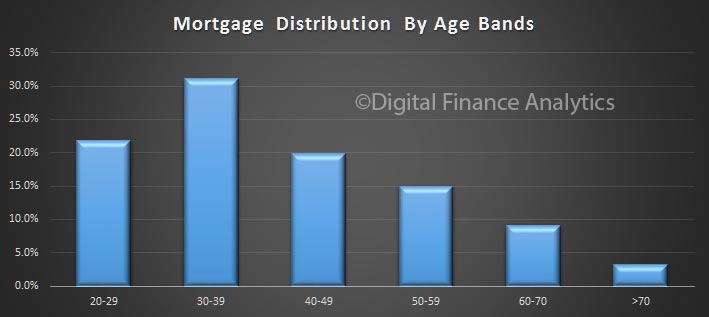
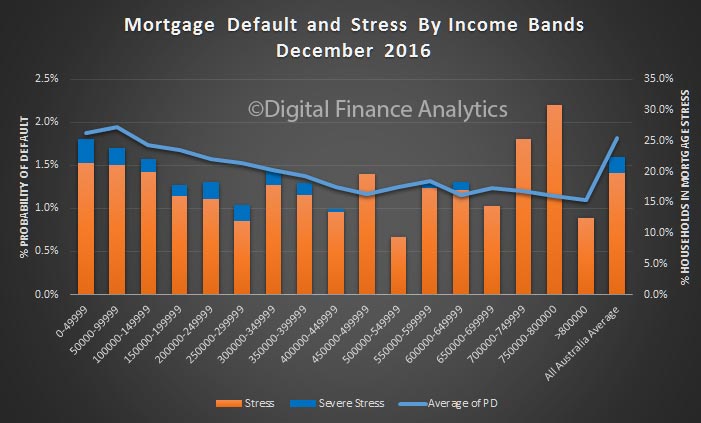
To set the context for this, here are a couple of charts showing the mortgage distribution by income and age bands. The majority of mortgages are held by households with an income of between $50,000 and $150,000.
Mortgage stress and default are slightly higher across the lower income bands, but note that households with substantially higher incomes can also be in severe stress. But of course the absolute number are very small.
The highest proportion of mortgages are held by those aged 30-39, more than 30%.
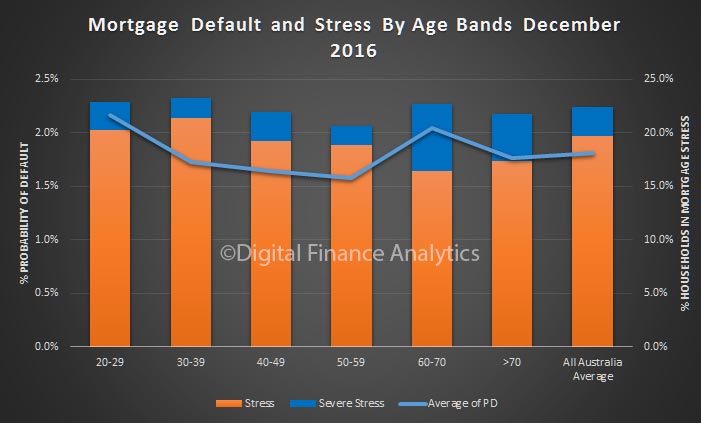
Default probability is higher among younger and older households. Whilst the number of these households with a mortgage is relatively low, more are in severe mortgage stress because their incomes are much lower. More generally, some mortgage stress is evident across all age bands. In volume terms, the highest stress volumes are found in those 30-39 years.
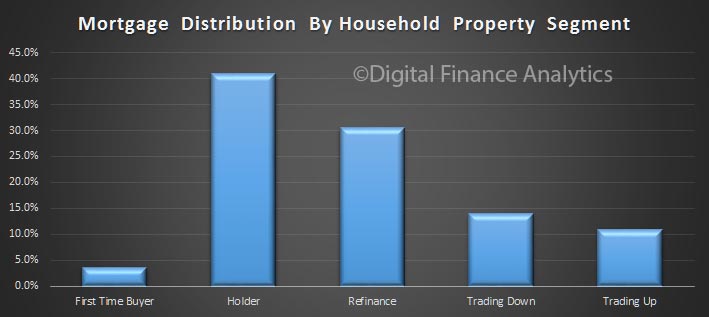
Next we turn to our property segmentation. Those holding property account for the largest segment of the market. You can read about our segmentation approach here.
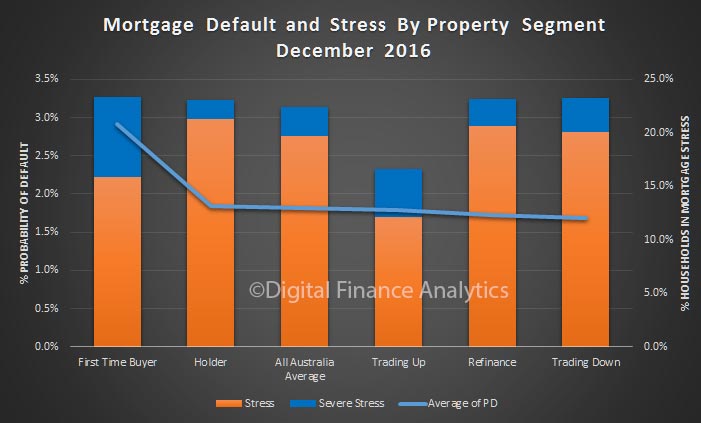
Probability of default is highest among first time buyers, who also have the highest proportion of severe mortgage stress. The segment with the lower risk and levels of stress are those seeking to trade up.
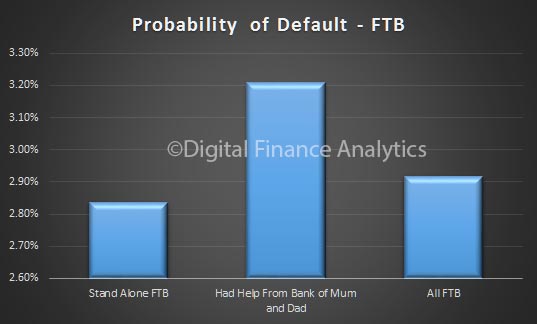
On interesting finding, bearing in mind we highlighted the rise of first time buyers seeking help from “The Bank of Mum and Dad“, is that those who do get help are more likely to default. So, assistance from parents may be a two-edged sword.
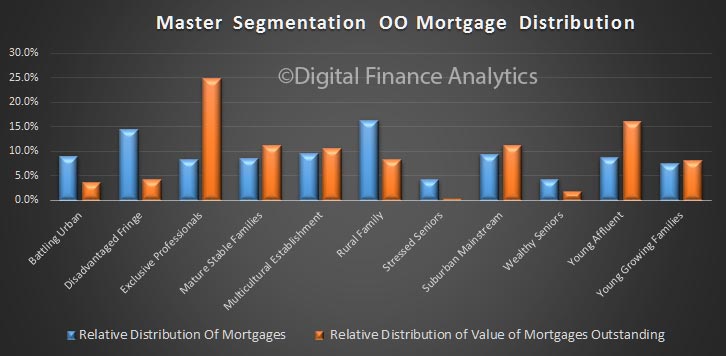
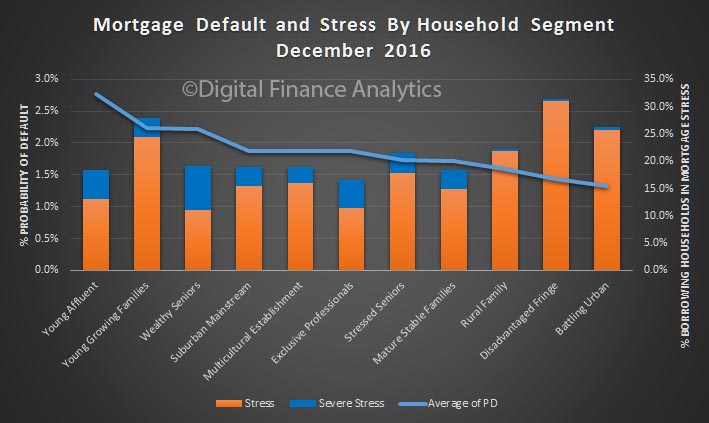
Finally, we turn to our master segmentation. The number of households with a mortgage varies across these segments. The value distribution footprint is quite different, with the exclusive professional and young affluent segments holding the larger average mortgage.
Mortgage stress is highest among the disadvantaged fringe, though their mortgages are relatively lower and default rates are relatively low. Wealthy seniors registered high levels of severe mortgage stress, thanks to pressure on incomes (the impact of low returns from bank deposits and rentals are important here).
However, the highest risk of defaults sits with the younger segments. Young affluent households, with large mortgages are most exposed because their incomes are flat whilst they are highly leveraged, so as interest rates rise, they are exposed. Many have bought new high-rise apartments in the inner city areas.
Young growing families may have, on average smaller mortgages, but their finances are tight, with little room to maneuver, and any rise in interest rates will be a problem for them. Costs are living are moving higher for this group, especially child care costs.
So, we think effective segmentation is critical to understand the various portfolio risks which reside in the bank’s mortgage book. We need to move beyond LVR and LTI.
Next time we will look at some of the post code level data.
Containing our latest series on mortgage stress and probability of default, we look further at the distribution of mortgage stress and potential defaults, using data from our household surveys, which includes results up to the middle of December 2016.
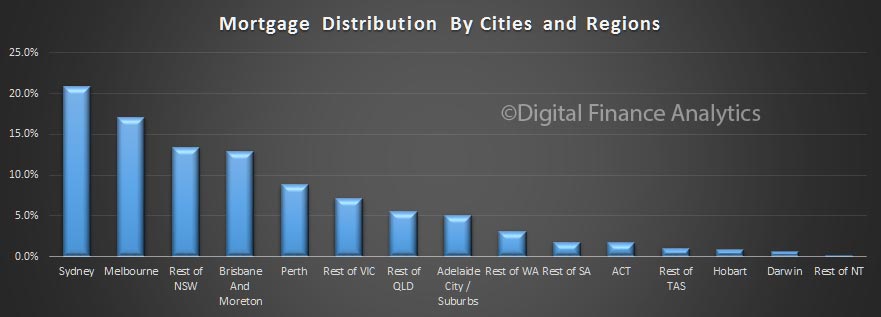
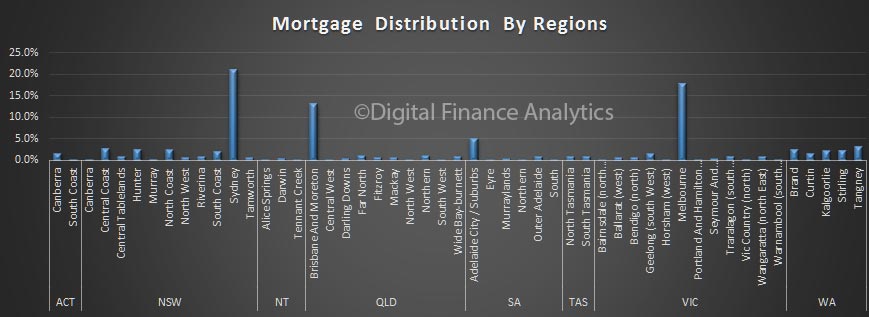
Building on the data we discussed yesterday, it is worth remembering that the bulk of mortgages reside in just a few zones across the country. This chart shows the number of loans in each of the major cities and regional areas, as a proportion of the total – we are looking here at owner occupied loans. The urban centres of Sydney, Melbourne and Brisbane hold the bulk of the loans, add in the rest of NSW and Perth, and you have more than 80% of all loans covered. So what happens in these areas is significant from a portfolio point of view. We include both loans from the banks (ADIs) and non-banks in this analysis.
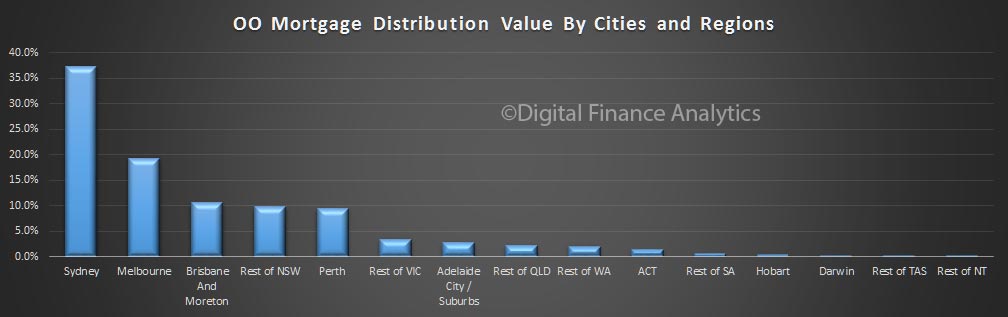
We can then look at the same analysis, but by loan value. Given the larger loans in Sydney, thanks to higher prices, the distribution based on value is more skewed, with more than 35% of loans in the greater Sydney region.
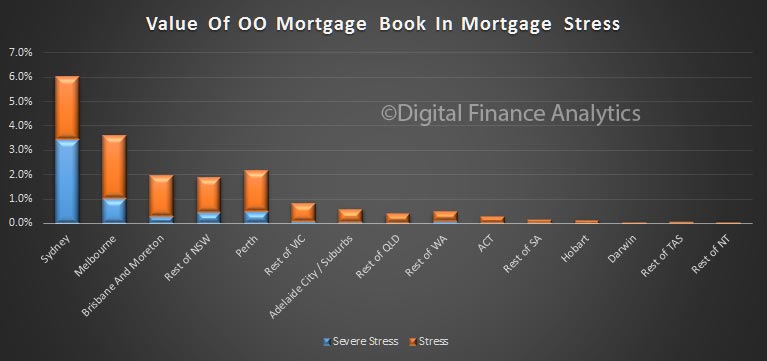
If we then overlay those households who are in mortgage stress, we see that in value terms, 6% of the portfolio in stress is in greater Sydney, 3.5% in greater Melbourne, and just over 2% in greater Perth.
Total this up, and we conclude that in value terms, 18.5% of the current owner occupied loans are held by households in some degree of mortgage stress. This proportion has been rising over the past couple of years, as income growth slows, whilst household debt rises.
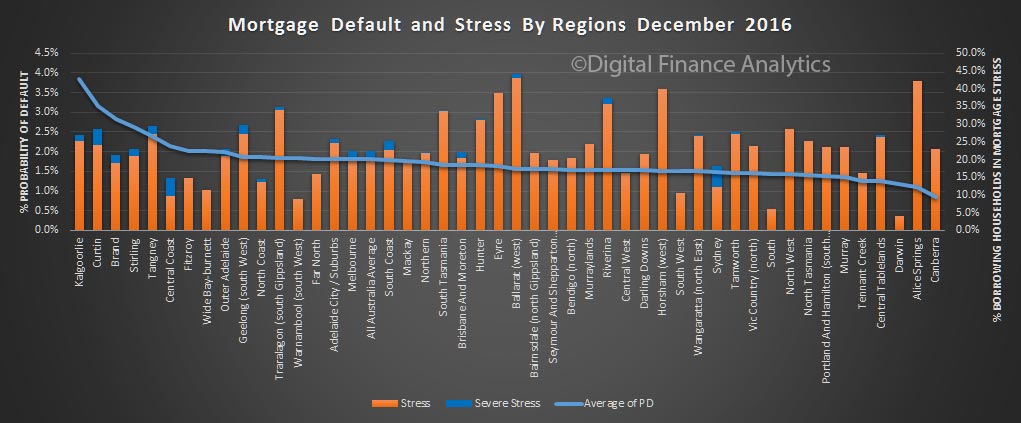
Another way to look at the data is by a more granular regional break down. Here is the probability of default by region, plus the latest reading on mortgage stress. The highest probability of default can be found in the Kalgoorlie, Curtin and Brand regions of WA. Regional WA probability of default sits at around 4%.
Ballarat, Horsham and Alice Springs has the highest rate of mortgage stress. But, when you look at the relative distribution of mortgages on the same basis, we see that the bulk of the mortgages reside in just a few regions. In other words, there may be high stress levels, but on low absolute volumes of loans. Once again, to see what is really going on, you need to get granular.
Next time we look at stress and default by our segmentation models.