Mortgage Arrears on the rise in early 2018

From Australian Broker.

Employment conditions may be improving across the country but it seems many Australian lenders are still on shaky ground after recent data reported a rise in home loan arrears rose in January.

The Standard & Poor’s Performance Index (SPIN) for Australian prime mortgages increased to 1.30% from 1.07% in December 2017, according to a report by S&P Global Ratings.

While the level of mortgage defaults remains relatively low, the report – titled ‘RMBS Arrears Statistics: Australia’ – found that many borrows are sensitive to interest-rate movements and changes in their economic circumstances due to a high level of household debt.

Of course, it’s not uncommon to see a rise in the number of home loan arrears in January with Christmas spending and summer holidays often blamed for the imbalance. However, this year, the magnitude of the month-on-month increase in January was higher than previous movements.

“We believe the impact of incremental increases in interest rates during 2017 could be a contributing factor to the rise in mortgage arrears in January,” read a release from S&P Global Ratings.

“We believe overall arrears could moderate in the coming months,” it continued. “However, it will only become evident during the next few months whether some of the loans in early arrears categories cure or migrate into more severe arrears categories due to stretched affordability constraints.”

The report also found that no area was exempt from the increase with loans in arrears by more than 30 days increasing in January in every state and territory.

Western Australia remains the home of the nation’s highest arrears, where loans in arrears more than 30 days rose to 2.44% in January from 2.08% in December, reaching a new record high.

Conversely, New South Wales continues to have the lowest arrears among the more populous states at 0.98% in January.

“Improving employment conditions will help keep defaults low, but rate rises will have an impact on borrowers,” said S&P Global Ratings.

“The prudence of loan underwriting standards, particularly debt-serviceability calculations, is fundamental to how well borrowers absorb these higher costs.”

The financial services firm also offered insight into which loans it identified as being most susceptible to higher levels of arrears:

Interest-only loans that are approaching their interest-only expiry date

As lending standards for interest-only loans were less stringent before 2015, interest-only loans underwritten before then could be more susceptible to repayment shock when the loans roll into an amortizing repayment structure.

High loan-to-value ratio loans

Apart from the obvious risk of having less equity built up in the home, which increases the risk of loss in the event of borrower default, borrowers with high LTV loans are also more likely to find it harder to refinance their home loan with another lender – a common way for borrowers to manage their way out of financial stress.

High debt relative to income loans

Borrowers with less of a buffer to service their mortgages are more likely to experience financial stress when interest rates rise or their economic circumstances change. The integrity of debt-serviceability standards is important in ensuring that debt-to-income serviceability assessments reflect each borrower’s actual income and expenditure patterns.

S&P Says Mortgage Arrears Lower In Oct 2017

The latest report from S&P Global Ratings covering securised mortgage pools in Australia to end Oct 2017, showed 30 day delinquency fell to 1.04% in October from 1.08% in September. They attribute part of the decline to a rise in outstanding loan balances during the month, and many older loans in the portfolios (which may not be representative of all mortgages, thanks to the selection criteria for securitised pools).

+90 Day defaults are still elevated, see the chart below.

Here is their state summary

Overall trends across the states show the differences across states, with WA and NT still significantly above other states.

The ACT recorded the lowest arrears levels, at 0.58%. QLD and WA, where arrears have been more elevated for some time, recorded another month-on-month decline in mortgage delinquencies. In QLD, arrears fell to 1.39% in October from 1.47% in September. In WA, they declined to 2.12% from 2.21% a month earlier, against a backdrop of increasing loan balances. Home loan arrears also declined in NSW and VIC, but by smaller  magnitudes. In NSW, arrears fell to 0.75% in October–the second lowest in the country–from 0.79% in September. In VIC, arrears declined to 0.94% from 0.96% the previous month.

In terms of the outlook, they say:

“improving employment conditions and low interest rates have helped to keep mortgage arrears low, but risks remain. Australia’s high household indebtedness, which has outpaced income and GDP growth for some time, leaves borrowers vulnerable to a change in economic circumstances. We do not expect arrears to increase much above current levels while these relatively benign economic conditions persist, particularly given the high level of seasoning in the Australian RMBS sector”.

Insights From Dynamic Loan To Income

One of the most powerful tools to assess risk in a mortgage portfolio is dynamic loan to income ratios (LTI). Whilst Loan to Value (LVR) has traditionally been seen as a simple lead indicator of risk, in a rising priced market, risks are hidden, while in a falling market risks suddenly reappear. In any case LVR is about the equity buffer which protects the bank, not necessarily the household, and then only once default occurs.

Among advanced economies, loan to income ratios have started to take their place as the more accurate indicator of potential risk because they look at the household cash flow, and ongoing ability to service the loan. There has been reluctance in Australia to want to get to grips with LTI, but APRA’s recent comment suggests this may, and rightly change.

The point though is LTI at loan origination, just as LVR at origination, does not tell the full story. To be effective LTI should be dynamically adjusted, so as income changes, risk does too. This should then be back-ended into the banks’ risk and capital models.

The Digital Finance Analytics Core Market Model includes dynamic LTI. Currently we estimate that more than 20% of owner occupied mortgage loans on book have a dynamic LTI of more than 4 times income.

Some LTI’s are above 10 times income, though a relatively small number, they are at significantly higher risk.

Looking at the data by state, we see that by far the highest count of high LTI loans resides in NSW (mainly in Greater Sydney), then VIC and WA.

Younger households have a relatively larger distribution of higher LTI loans.

Reading across our core segmentation, we see that Young Affluent, Exclusive Professionals and Multi Cultural Establishment are the three groups more likely to have a high dynamic LTI. We also see a number of Young Growing Families in the upper bands too.

Many lenders also hold the transaction account for their mortgage borrowers, so it is perfectly feasible to build an algorithm which calculates estimated income dynamically from their transaction history, and use this to estimate a dynamic LTI. This would give greater insight into the real portfolio risks, compared with the blunt instrument of LVR. It is less misleading that LTI or LVR at origination.

Indeed, perhaps lenders should be running annual health checks on their mortgage portfolios, using LTI as the key discriminator. This is a leading indicator of down stream risks.

It also assists in assessing the true portfolio risks, because currently if households are in difficulty, it is in the banks’ interests to close out the loan quickly, to release equity to repay the loan and reduce the number of “bad loans” on book. One simple reason why losses are so low on a portfolio basis around 2 basis points, is that in a rising market, equity gains more than cover the loans. But that could change if home prices stall or reverse.

Dynamic LTI is a tool to assess risks earlier in the cycle.

What Does The Recent Bank Results Tell Us About Mortgage Defaults?

We have now had results in from most of the major players in retail banking this reporting season. One interesting point relates to mortgage defaults.  Are they rising, or not?

Below are the key charts from the various players. Actually, there are some significant differences. Some are suggesting WA defaults in particular are easing off now, while others are still showing ongoing rises.

This may reflect different reporting periods, or does it highlight differences in underwriting standards? Our modelling suggests that the rate of growth in stress in WA is slowing, but it is rising in NSW and VIC; and there is a 18-24 month lag between mortgage stress and mortgage default. So, in the light of expected flat income growth, continued growth in mortgage lending at 3x income, rising costs of living and the risk of international funding rates rising, we think it is too soon to declare defaults have peaked.

One final point, many households have sufficient capital buffers to repay the bank, thanks to ongoing home price rises. Should prices start to fall significantly, this would change the picture significantly.

Bank of Queensland

ANZ

CBA

Genworth

Westpac

Mortgage Arrears Ease A Little In August – S&P

From Business Insider.

According to ratings agency Standard and Poor’s (S&P), the percentage of delinquent housing loans contained in Australian prime residential mortgage-backed securities (RMBS) fell to just 1.10% in August from 1.17% in July.

S&P said arrears decreased in all states and territories except the Australian Capital Territory (ACT) over the month, with noticeable improvements in Australia’s mining states and territories.

“The Northern Territory (NT) recorded the largest improvement, with arrears declining to 1.63% from 1.98% a month earlier,” S&P said. “In Western Australia, arrears fell to 2.22% in August from a historic high of 2.38% in July.”

The improvement may reflect an improvement in economic conditions in those locations following recent increases in commodity prices, along with a pickup in employment levels.

Improvement was also seen in Australia’s most populous states, where most Australian home loans are domiciled.

“The more populous states of New South Wales, Victoria, and Queensland, where around 80% of loan exposures are domiciled, recorded an improvement in arrears in August,” the agency said.

Despite the small increase in the ACT, at 0.63%, arrears still remained at the lowest level across the country.

The broad improvement in home loan arrears over the month can be seen in the map below from S&P.

Source: Standard & Poor’s


And this chart and table shows the level of arrears by delinquency duration.

Source: Standard & Poor’s


S&P says that “relatively stable employment conditions and low interest rates continue to underpin the low levels of arrears for most Australian RMBS transactions”, adding that it believes “lending standards generally have tightened in many areas since attracting greater regulatory scrutiny beginning in 2015.”

Looking ahead, the ratings agency says that while the prospect of higher mortgage rates could lead to an increase in arrears, particularly among those with high loan-to-value ratios, stronger labour market conditions should keep any potential in check.

“Provided employment conditions remain relatively stable, however, we do not anticipate arrears materially increasing above current levels in the next 12 months,” S&P says.

“Some loans underwritten before 2015 could be more susceptible to higher arrears, particularly interest-only loans with higher loan-to-value (LTV) ratios for which no equity has built up during the interest-only period, in our opinion.”

Mortgage Arrears Rise – Fitch

Fitch Ratings says Australia’s mortgage arrears increased by 12bp qoq to 1.21% at end-1Q17, due to seasonal Christmas/holiday spending and possible difficulties faced by consumers because of low real-wage growth. The qoq increase in arrears from 4Q16 to 1Q17 was less than 1Q16 (16bp qoq to 1.10%).

The 30+ days arrears in 1Q17 were 11bp higher yoy, despite an improved economic environment and lower standard variable interest rates. Unemployment increased slightly by 2bp and real wage growth was low, but positive. Underemployment has been growing despite relatively stable unemployment.

Fitch Ratings expects arrears to fall in 2Q17 and 3Q17 after the holiday season due to the current low interest rate environment and decreasing unemployment.

Fitch-rated residential mortgage-backed securities transactions have continued to experience extremely low levels of realised losses since closing and an increasing lenders’ mortgage insurance (LMI) payment ratio since 4Q12. Excess spread was sufficient to cover principal shortfalls during 1Q17

Mortgage Stress Gets Worse in July

Digital Finance Analytics has released mortgage stress and default modelling for Australian mortgage borrowers, to end July 2017.  Across the nation, more than 820,000 households are estimated to be now in mortgage stress (last month 810,000) with 20,000 of these in severe stress. This equates to 25.8% of households, up from 25.4% last month. We also estimate that nearly 53,000 households risk default in the next 12 months, 2,000 down from last month.

We have been tracking the number of households in stress each month since 2000, and since a small easing in February 2016, the number under pressure have been rising each month.  The RBA cash rate cuts have provided some relief, especially directly after the GFC, but now mortgage rates appear to be more disconnected from the cash rate as banks seek to rebuild their margins.

The main drivers of stress are rising mortgage rates and living costs whilst real incomes continue to fall and underemployment is on the rise.  This is a deadly combination and is touching households across the country, not just in the mortgage belts. On the other hand, employment remains strong in NSW in particular, so income rose a little and small reductions in some owner occupied mortgage rates helped too.

This analysis uses our core market model which combines information from our 52,000 household surveys, public data from the RBA, ABS and APRA; and private data from lenders and aggregators. The data is current to end July 2017.

We analyse household cash flow based on real incomes, outgoings and mortgage repayments. Households are “stressed” when income does not cover ongoing costs, rather than identifying a set proportion of income, (such as 30%) going on the mortgage.

Those households in mild stress have little leeway in their cash flows, whereas those in severe stress are unable to meet repayments from current income. In both cases, households manage this deficit by cutting back on spending, putting more on credit cards and seeking to refinance, restructure or sell their home.  Those in severe stress are more likely to be seeking hardship assistance and are often forced to sell.

Martin North, Principal of Digital Finance Analytics said “flat incomes and underemployment mean rising costs are not being managed by many, and when added to rising mortgage rates, household budgets are really under pressure. Those with larger mortgages are more impacted by rate rises”.

“The latest housing debt to income ratio is at a record 190.4[1] so households will remain under pressure. Stressed households are less likely to spend at the shops, which acts as a drag anchor on future growth. The number of households impacted are economically significant, especially as household debt continues to climb to new record levels.”

“We continue to see the spread of mortgage stress in areas away from the traditional mortgage belts. A rising number of more affluent households are also being impacted.”

Regional analysis shows that NSW has 225,090 households in stress, VIC 229,988 (217,655 last month), QLD 144,825 (141,111 last month) and WA 107,936 (106,984 last month). The probability of default fell a little, with around 10,000 in WA, around 10,000 in QLD, 13,000 in VIC and 14,000 in NSW. There were falls of about 1,000 from last month in NSW and VIC, thanks to improved employment prospects. Probability of default extends our mortgage stress analysis by overlaying economic indicators such as employment, future wage growth and cpi changes.

Here are the top 30 post codes sorted by risk of default estimated over the next 12 months.

[1] *RBA E2 Household Finances – Selected Ratios March 2016

Home loan arrears level now stable

From Australian Broker.

The number of loan arrears has levelled out, breaking a two year trend, according to analysts from S&P Global Ratings.

In its regular monthly report, RMBS Arrears Statistics: Australia, the ratings agency said delinquent housing loans underlying Australian prime residential mortgage-backed securities (RMBS) stayed stable at 1.21% in May, unchanged from April.

However while this level was unchanged in percentage terms, the volume of arrears of more than 30 days fell by approximately $30m (or 2%) from month to month during this time. This presents the end to a trend for the past two years where month-on-month arrears actually increased between April and May.

The average level of arrears for May over the past decade has been around 1.30%.

Movements were mixed across the country. New South Wales, Victoria, South Australia, Tasmania, and the Australian Capital Territory all recorded monthly declines in arrears while Queensland, Western Australia and the Northern Territory all recorded increases.

South Australia experienced the largest drop, falling from 1.64% in April to 1.56% in May. At the other end of the spectrum, the Northern Territory saw the largest increase rising from 1.70% in April to 1.91% in May.

Arrears in Western Australia remain the highest in the country sitting at 2.37%, almost two times the national average.

Movements in arrears often reflect broader economic trends in areas such as employment, property prices and wage growth, Erin Kitson, credit analyst at S&P Global Ratings, told Australian Broker.

When examining this data, Kitson pointed out that more than 80% of loan exposures underlying Australian RMBS transactions are in NSW, Victoria and Queensland.

“Exposure to other states and territories particularly the ACT, NT and Tasmania is quite small so arrears figures for these areas are subject to greater volatility.”

Looking at where the loans came from, S&P analysts found that arrears increased in originator categories such as ‘major banks,’ ‘non-bank originators,’ and ‘non-bank financial institutions’. Exceptions included ‘other banks’ which fell from 1.14% to 1.07% from April to May and ‘regional banks’ which remained unchanged at 2.27%.

While the major banks recorded an increase in percentage terms, arrears actually fell month to month when looking at dollar value.

“Many things can influence arrears performance across originator types including total outstanding loan balances, interest rates charged on underlying loans, collateral quality of the underlying portfolios, geographic exposures of the underlying portfolios etc,” Kitson said.

Since these loan pools comprised of loans originated over a broad period of time, recent changes such as APRA‘s tigher lending policies would not directly translate to a change in arrears performance, she added.

Non-conforming arrears rose from 5.03% to 5.16% between April and May while falling in dollar terms.

“Despite the pressures of lower wage growth and high household debt, mortgage arrears have remained relatively low, buffered by low interest rates. Stable employment conditions have also helped,” S&P analysts wrote.

“A variety of lenders have announced interest rate rises in recent months, and this could put pressure on arrears in the coming months; however, we do not expect these movements to be material, based on our forecast of relatively stable employment conditions.”

Kitson said that the incremental nature of rate hikes are designed to minimise borrower repayment shock and the likelihood of default.

“Also, most lenders now incorporate interest rate buffers and floors in debt serviceability assessments in line with regulatory guidance so in theory, the majority of borrowers should be able to absorb a certain threshold of interest rate increases provided employment conditions remain relatively stable.”

What’s The Correlation Between Mortgage Stress And Loan Non Performance?

Last night DFA was involved in a flurry of tweets about the relationship between our rolling mortgage stress data and mortgage non-performance over time. The core questions revolved around our method of assessing mortgage stress, and the strength, or otherwise of the correlation.

We were also asked about our expectations as to when non-performing mortgage loans will more above 1% of portfolio, given the uptick in stress we are seeing at the moment.

Our May 2017 data showed that across the nation, more than 794,000 households are now in mortgage stress (last month 767,000) with 30,000 of these in severe stress. This equates to 24.8% of households, up from 23.4% last month. We also estimate that nearly 55,000 households risk default in the next 12 months.

However, it got too late last night to try and explain our analysis in 140 characters. So here is more detail on our approach to mortgage stress, and importantly a chart which slows the relationship between stress data and mortgage non-performance.

Our analysis uses our core market model which combines information from our 52,000 household surveys, public data from the RBA, ABS and APRA; and private data from lenders and aggregators. The data is current to end May 2017.

We analyse household cash flow based on real incomes, outgoings and mortgage repayments. Households are “stressed” when income does not cover ongoing costs, rather than identifying a set proportion of income, (such as 30%) going on the mortgage.

Those households in mild stress have little leeway in their cash flows, whereas those in severe stress are unable to meet repayments from current income. In both cases, households manage this deficit by cutting back on spending, putting more on credit cards and seeking to refinance, restructure or sell their home. Those in severe stress are more likely to be seeking hardship assistance and are often forced to sell.

We also make an estimate of predicated 30 day defaults in the year ahead (PD30) based on our stress data, and an economic overlay including expected mortgage rates, inflation, income growth and underemployment, at a post code level.

Here is the mapping between stress and non-performance of loans.

The red line is the data from the regulators on non-performing mortgage loans. In 2016 it sat around 0.7%. There was a peak following the 2007/8 financial crisis, after which interest rates and mortgage rates came down.

We show three additional lines on the chart. The first is our severe stress measure, the blue line, which is higher than the default rate, but follows the non-performance line quite well. The second line is the PD30 estimate, our prediction at the time of the expected level of default, in the year ahead. This is shown by the dotted yellow line, and tends to lead the actual level of defaults. Again there is a reasonable correlation.

The final line shows the mild stress household data. This is plotted on the right hand scale, and has a lower level of correlation, but nevertheless a reasonable level of shaping. After the GFC, rates cuts, plus the cash splash, helped households get out of trouble by in large, but since then the size of mortgages have grown, income in real terms is falling, living cost are rising as is underemployment. Plus mortgage rates have been rising, and the net impact in the past six months, with the RBA cash rate cut on one hand, and out of cycle rises by the banks on the other, is that mortgage repayments are higher today, than they were, for both owner occupied borrowers and investors. Interest only investors are the hardest hit.

Households are responding by cutting back on their spending, seeking to refinance and restructure their loans, and generally hunkering down. All not good for broader economic growth!

So, given the severe stress, mild stress and our PD30 estimates are all currently rising, we expect non-performing loans to rise above 1% of portfolio during 2018. Unless the RBA cuts, and the mortgage rates follow.


The Latest Top 10 Post Codes In Risk Of Mortgage Default

Today using our latest mortgage stress and probability of default data, we explore the top ten highest risk post codes across the country. Specifically, we look at where we expect the largest number of mortgage defaults to occur over the next few months.

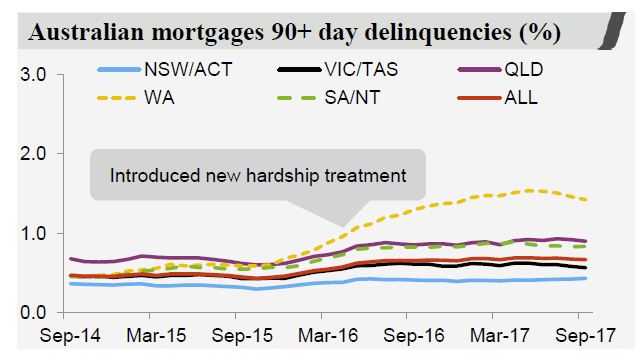
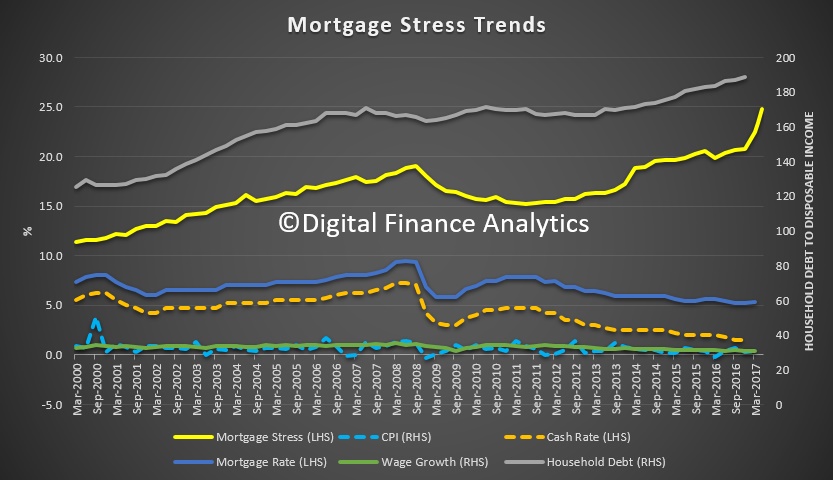
We explore the latest mortgage stress and default modelling, using data to the end of April 2017. We have already highlighted that overall mortgage stress is rising, with more than 767,000 households in stress compared with last month’s 669,000. This equates to 23.4% of households, up from 21.8% last month. 32,000 of these are in severe stress. We also estimate that nearly 52,000 households risk default in the next 12 months.

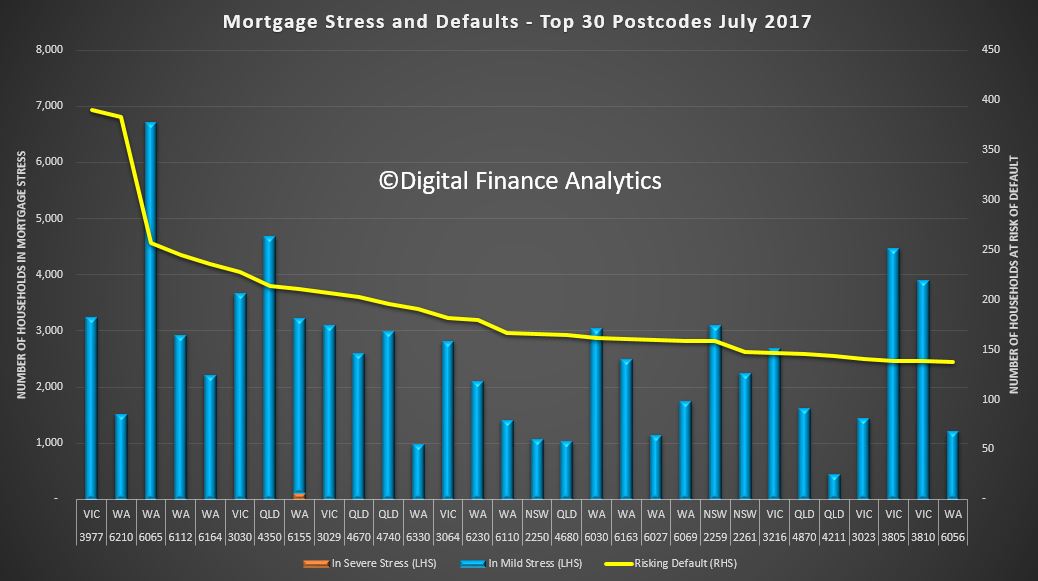
But now we look at individual post codes, and explore the top ten based on the number of households we expect to default. This is calculated using our 52,000 household sample with economic overlays for employment, inflation, interest rates and costs of living.

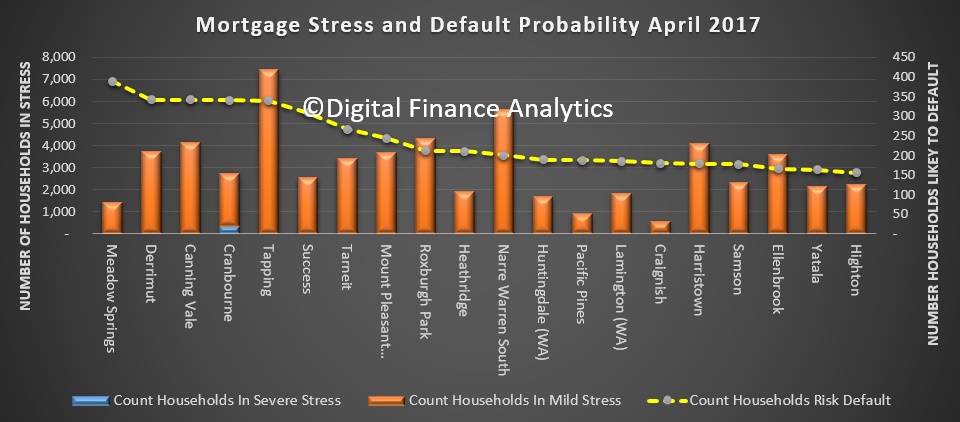
Note the labels in the chart above are only examples of locations within the postcodes.

As a general observation, many of the worst hit post codes are areas containing large numbers of newer property in the outer urban ring. Households here have large mortgages and limited income growth relative to house prices. But there are some important differences in terms of recent house price movements across the post codes.

We will count down the top 10, from 10th down to the highest risk postcode. So stay with us to the end!

The tenth highest risk post code in Australia is 6027 in Western Australia. This is the city of Joondalup and includes places like Ocean Reef and Edgewater. It is about 25 kilometres north of Perth. It’s a fast growing area with lots of young families, lots of new homes and large mortgages relative to income. The average house price is $510,000, down from $570,000 in 2014. We estimate there are more than 1,900 households in mortgage stress in the area, and 211 are likely to default in the next few months.

In ninth spot is Victorian post code 3064. This includes Craigieburn, Mickleham and Roxburgh Park. This area is about 25 kilometres north from Melbourne. The average house price is $438,000, up from $330,000 in 2014.  Again it is a fast growing area, with more than 60% of households holding a mortgage. The average age here is 30 years. We estimate there are 4,320 households in mortgage stress, and 212 are likely to default in the next few months.

Next at number eight is 4740 in Queensland. This includes Mackay and the surround areas, including Alexandra, Beaconsfield, Richmond and Slade Point. This area is more than 800 kilometres north of Brisbane, and is the gateway to the Bowen Basin coal mining reserves of Central Queensland. The average house price is $240,000 compared with $400,000 in 2014.  We estimate there are more than 3,600 households in mortgage stress in the region, and 244 are likely to default in the next few months.

We go back to Victoria for the seventh placed postcode which is 3029, Hoppers Crossing. This is a suburb of Melbourne about 23 kilometres’ south-west of the CBD and has grown to become a substantial residential area, with about half of properties there mortgaged. The average age is around 35. The average house price is $440,000 compared with $340,000 in 2014. We estimate there to be more than 3,400 households in mortgage stress, and we expect 266 households to default in the next few months.

In sixth place in Western Australia, is 6164, the city of Cockburn. It is about 8 kilometres south of Fremantle and about 24 kilometres south of Perth’s central business district. It includes areas like Jandakot, South Lake and Success. Around 40% of homes in the region are mortgaged and the average age is 31 years. Average house prices are around $730,000 about the same as in 2014. More than 2,530 households are in mortgage stress here, and the estimated number of defaults in the next few months is 308.

Next, counting down to number five, is another WA location, 6065, the city of Wanneroo which is around 25 kilometres north of Perth on the rail corridor. Again a fast growing suburb, the city has had the largest population expansion out of any other local government area in greater Perth. The average house price is $425,000 compared with $480,000 in 2014. Nearly half of households here have a mortgage, and more than 7,400 are in mortgage stress. We estimate that 339 households are likely to default in the next few months.

In fourth spot is Cranborne in Victoria, 3977. It is a suburb in the outer south east of Melbourne, 43 kilometres from the central business district. Its local government area is the City of Casey which is one of Victoria’s most populous regions, with a population of well over a quarter of a million. The average house price is $425,000 compared with $330,000 in 2014. In 3977, close to half of all homes are mortgaged, and we estimate 2,750 households are in mortgage stress, including 344 in severe stress. We estimate around 340 households will default in the next few months.

So down to the top three. The third most risky postcode according to our analysis is Victorian post code 3030 which is the region around Derrimut and Werribee. Werribee is a suburb of Geelong and is about 29 kilometres south west of Melbourne. The median house price is $405,000, well above its 2014 level of $310,000. Here 3,730 households are in mortgage stress, and 342 are likely to default in the next few months.

In second place is another Western Australian post code, 6155, Canning Vale and Willetton. It’s a large southern suburb of Perth, 20 kilometres from the CBD. The population has been growing quickly with significant new builds, and 60% of households have a mortgage. The average house price is around $560,000, down from $610,000 in 2014. The average age is 32 years. We estimate there are 4,150 households in mortgage stress and 342 households risk default in the next few months.

So finally, in top spot, at number one, is another Western Australian postcode 6210, Mandurah. This also includes suburbs such as Meadow Springs and Dudley Park. Mandurah is a southwest coast suburb, 65 kilometres from Perth. The average home price is around $300,000 and has fallen from $340,000 since 2014. Here there are 1,430 households in mortgage stress but we estimate 388 are at risk of default in the next few months.

As a final aside, in twenty second place, is the highest risk postcode in New South Wales, 2155, Kellyville, which is 36 kilometres north-west of the Sydney central business district in The Hills Shire. The average house price here is $1.1 million, compared with $860,000 in 2014. We estimate there are 1,240 households in mild stress and we estimate 151 households risk default in the next few months.

So that completes our analysis of the current most risky postcodes. We will update our modelling next month, so check back to see how the trends develop. But in summary households in Western Australia are most exposed in the current environment, especially with house prices there falling.