Base Metals Price Drop May Signal Lower Growth

The trade wars are, according to Moody’s, already impacting base metals pricing, and may signal lower growth ahead.

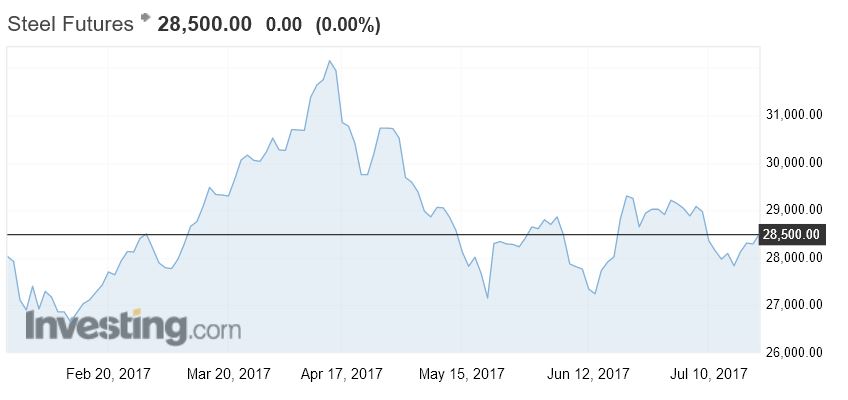
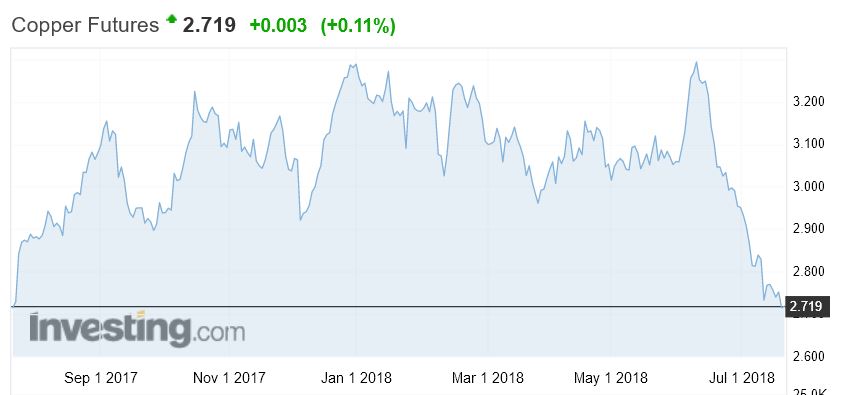
We can see falls from the charts.

Though it goes practically unmentioned, one of the more unexpected developments of late has been the stunning collapse of Moody’s industrial metals price index. In part, the industrial metals price index’s average of July-to-date is a deep 8.2% under its June 2018 average because of uncertainties stemming from trade-related issues. Since worries surrounding a trade war came to the fore following June 14’s close, the base metals price index has sunk by 13.0%.

Nevertheless, the base metals price index’s month-long average had peaked some time ago in February 2018, where the subsequent slide by the index through mid-June reflected a loss of momentum for global
industrial activity.

Moreover, the base metals price index’s improved performance since 2016 falls considerably short of its strong showing of 2010 and 2011. Though the industrial metals price index’s latest 52-week moving average tops its contiguous 52-week moving average of the span-ended July 17, 2017 by 19.9%, it remains 8.8% under its current recovery high for the span ended September 20, 2011. The latter 52-week observation overlapped very brisk annual growth rates for the world economy of 5.4% for 2010 and 4.3%
for 2011.

The roughly 10% average annual increase by China’s real GDP of 2010-2011 goes far at explaining both 2010-2011’s average annualized advances of 4.9% for world economic activity and 27% for the industrial metals price index. By contrast, current consensus expectations call for a slowing of China’s economic growth from 2017’s actual 6.9% to 6.6% in 2018 and 6.4% in 2019. In turn, the IMF expects the world economy to grow no faster than 3.9% in both 2018 and 2019 following 2017’s 3.7% increase.

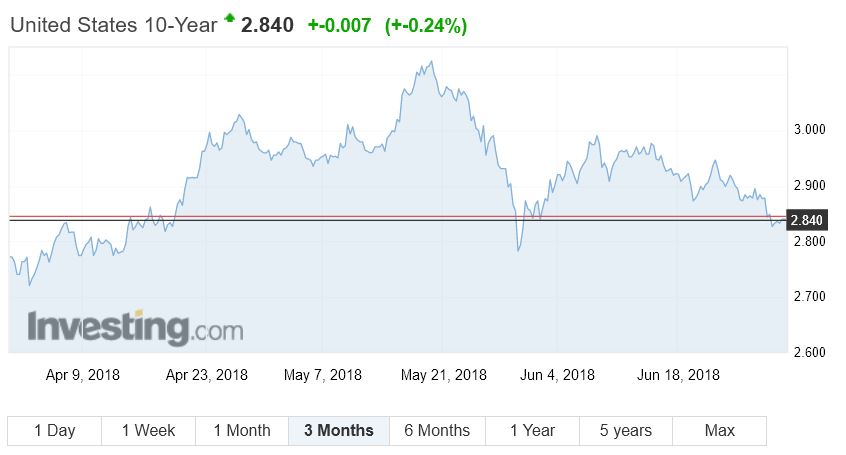
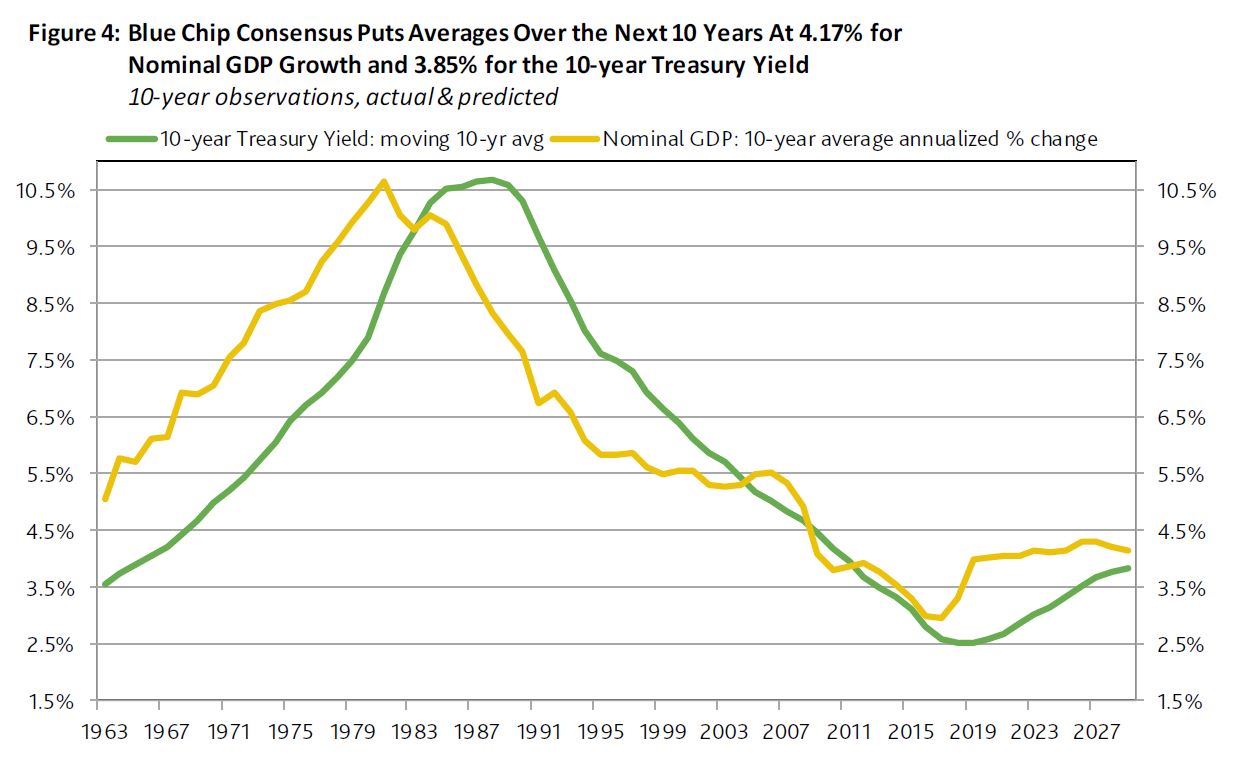
However, a consensus forecast compiled by Bloomberg News in mid-July projected slower rates of growth for world real GDP of 3.7% in 2018, 3.6% in 2019, and 3.3% in 2020. These projections for world growth seem to be inconsistent with the accompanying consensus forecast of a steady and uninterrupted climb by the 10-year U.S. Treasury yield from July 19’s 2.85% to 3.55% by the end of 2020.

Lower Industrial Metals Price Index May Block Higher Treasury Yields

Throughout the current business cycle upturn, advances by the 10-year Treasury yield have been difficult to sustain without an accompanying upswing by the industrial metals price index. For example, when the
10-year Treasury yield’s month-long average peaked for the current recovery at the 3.58% of February 2011, the base metals price index was merely 0.1% under its April 2011 high of the current upturn. In response to a 25% plunge by the base metals price index’s moving three-month average from April 2011 to December 2011, the 10-year Treasury yield’s accompanying three-month average sank from 3.48% to 2.05%, respectively.

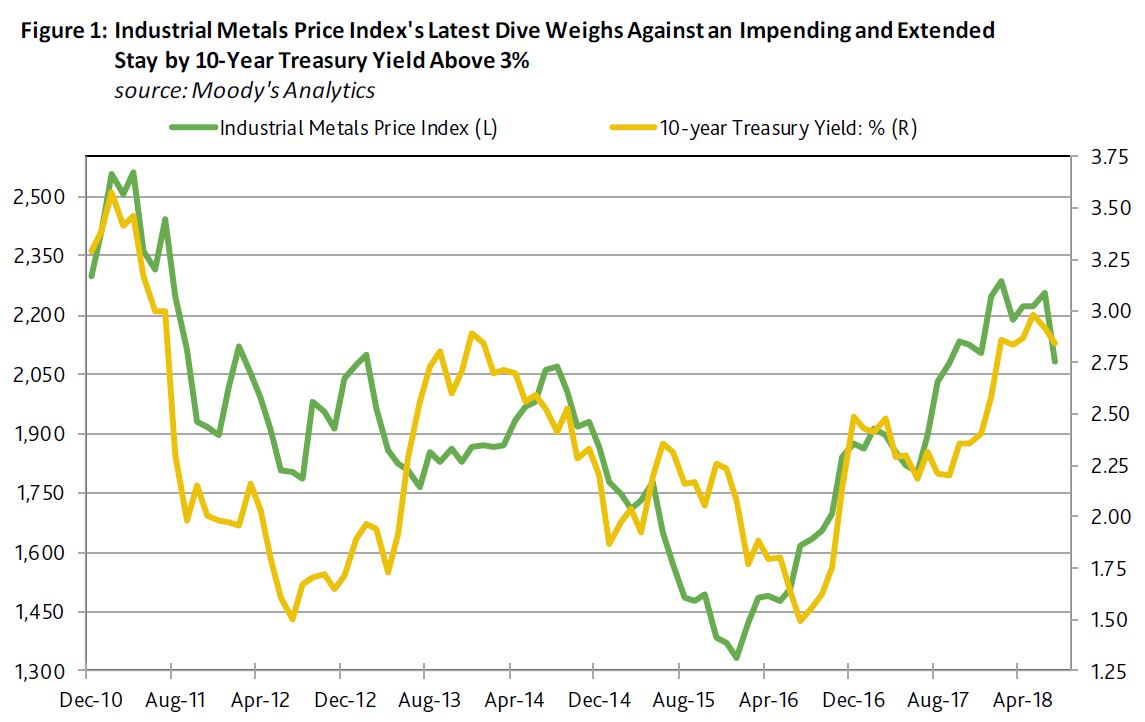
Until the base metals price index approaches its latest high of February 2018, the 10-year Treasury yield is unlikely to remain at or above 3% for long. In fact, there is a very real possibility that by later this summer, the industrial metals price index may begin to record year-to-year declines, which in the past  were often accompanied by year-to-year declines for the 10-year Treasury yield. A year-to-year decline by the base metals price index could arrive fairly soon. For example, July 18’s industrial metals price index was less than each of its previous month-long averages starting with August 2017. Over the course of just one month, the industrial metals price index’s yearly increase sagged from the 26.2% of June 18, 2018 to the 6.0% of July 18.

2015’s Bout of Industrial Commodity Price Deflation Swelled Spreads and Sank Equities

The last severe bout of base metals price deflation was linked to problems in China and an earlier run-up by U.S. Treasury bond yields, or the taper tantrum of 2013-2014. After setting a localized peak in August 2014, the industrial metals price index’s month-long average would ultimately plunge by a cumulative 35.5% before bottoming in January 2016. In addition, an even deeper 71.0% plummet by crude oil’s month-long average price from a June 2014 peak to a February 2016 bottom overlapped the slide by base metals prices.

The 2014-2015 episode of industrial commodity price deflation helped to shrink the moving yearlong sum of the pretax operating profits of U.S. nonfinancial corporations by 10.3% from a second-quarter 2015 top to a first-quarter 2017 trough. Even after excluding the especially hard hit petroleum and coal industries, the remaining operating profits of nonfinancial corporations sank by a cumulative 7.8% from 2015’s second quarter to 2017’s first quarter.

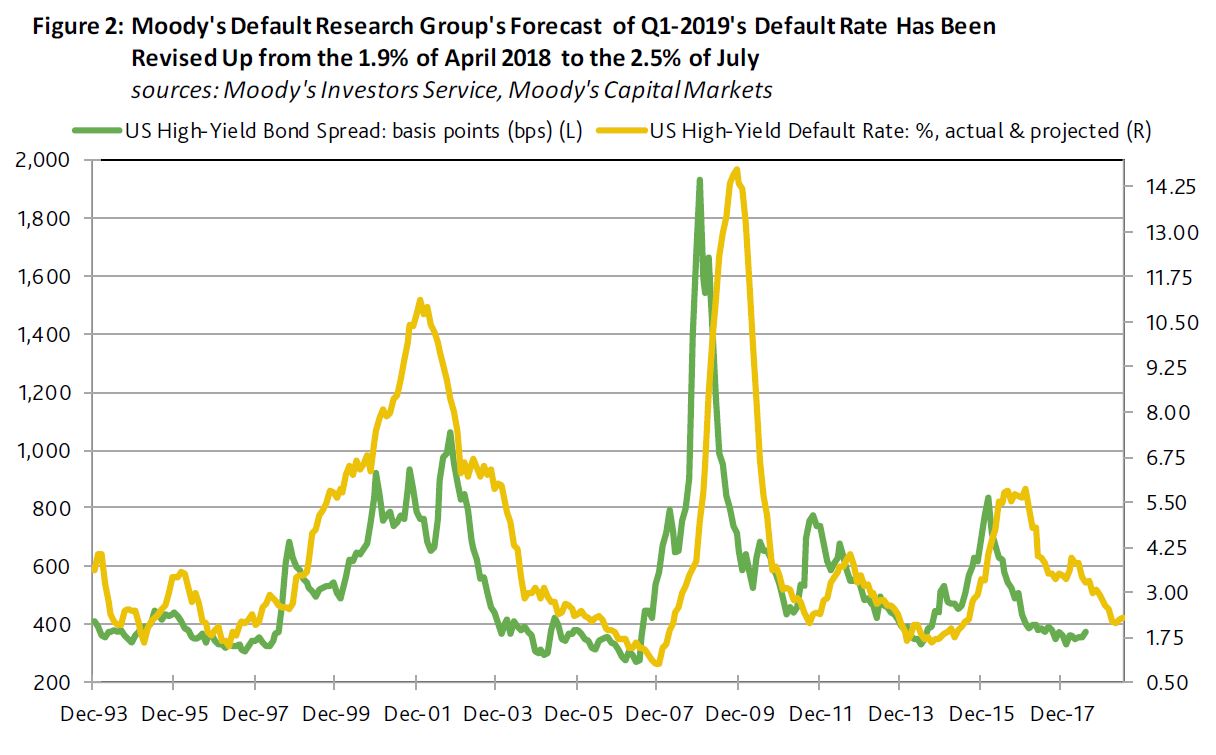
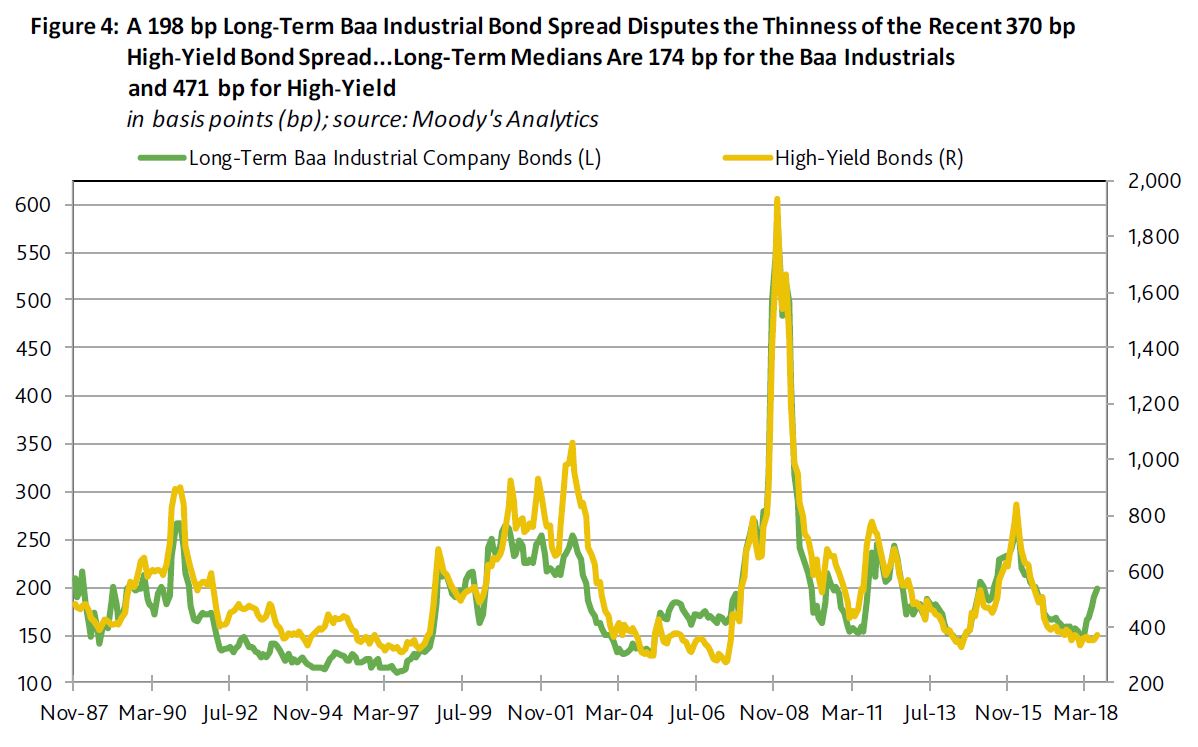
The combination of industrial commodity price deflation and the shrinkage of profits helped to drive the U.S.’ high-yield default rate up from September 2014’s now 10.5-year low of 1.6% to January 2017’s eight-year high of 5.9%. Moreover, the month-long averages of the high-yield bond spread and the longterm Baa industrial company bond yield spread ballooned from the 331 basis points and the 145 bp, respectively, of June 2014 to the 839 bp and 277 bp of February 2016. In addition, the month-long average for the market value of U.S. common stock sank by a cumulative 12.9% from a May 2015 high to a February 2016 bottom.

A subsequent recovery by operating profits helped to lower the default rate to June 2018’s 3.4%. And expectations of a further expansion of profits from current production now lend critical support to a likely continued slide by the default rate to 2.3% by June 2019.

Nevertheless, Moody’s Default Research Group has upwardly revised its default forecast. The predicted U.S. high-yield default rate for 2019’s first quarter has been ratcheted up from 1.9% as of April 2018 to 2.5% as of July. Still the latter would be significantly under the 3.8% average of 2018’s first quarter. Not only do expectations of yearly declines by the default rate constructive for corporate credit quality, they also lend support to equity market performance and systemic liquidity.

Non-bank lenders’ rapid growth poses risks — report

The rapid growth of non-bank lenders reflects the positive quality of their loan books and residential mortgage-backed securities (RMBS) – but growth should happen in a sustainable way, according to Moody’s Investors Service; via MPA.

Moody’s vice president and senior analyst John Paul Truijens said in a statement that although “investment and interest-only mortgages have historically been riskier than owner-occupier principal and interest mortgages, they are less risky than the non-conforming or alternative documentation loans that most non-bank lenders have traditionally focused on”.

The conclusions are found in Moody’s recently released study, “Financial institutions and RMBS – Australia: Growth opportunities not without risks as non-bank lenders push into investment and interest-only mortgages”. The report was written by Truijens and another Moody’s vice president and senior analyst, Daniel Yu.

The report stressed that the push into investment and interest-only lending has further captured the interest of private equity investors. And this has led to three acquisitions of non-bank lenders in the last nine months.

“If the current rapid growth rate were to be sustained over a prolonged period or even rise, or if non-bank lenders were to push into the riskier segments of the investment and interest-only mortgage markets to maintain growth, this would pose risks,” Truijens and Yu said.

According to them, non-bank lenders may need to rapidly expand their underwriting teams, and this could compromise the quality of their staff experience and risk controls.

If the banks return to pursue strong investments and interest-only lending, increased competition would make it difficult for non-bank lenders to sustain their rapid growth and this could push them to the riskier segments of the mortgage market.

Moody’s still believes non-bank lenders are generally suited to underwrite and risk-price investment and interest-only loans. But borrowers’ financial situations need to be scrutinised even more for these mortgages than for owner-occupier principal and interest loans. The experience of non-bank lenders in underwriting non-conforming loans enables them to demonstrate such scrutiny.

Risks are further lessened by the legislative amendments made in February 2018 that now allow APRA to regulate non-bank lenders.

Funding of non-bank lenders is not guaranteed, according to Moody’s. These lenders depend on “bank funding via warehouse facilities for the initial organisation of loans and RMBS investors for RMBS issuance”. Both funding sources depend on market confidence and economic conditions.

Non-bank lenders are increasingly getting into the investment and interest-only loan market after APRA released a series of measures in 2014 that limit banks from offering such loans. Non-banks accounted for almost 35% of investment loans originated in 2017, up from around 15% in 2014. Their share of interest-only mortgages was around 25%. However, the report said the non-bank mortgage sector still remains relatively small in Australia despite massive growth, accounting for just under 4% of the $1.7trn mortgage market.

Trade Wars May Drive Rates Lower

As the spot light turns to the emerging trade wars with the USA, the impact may be to push bond rates lower, according to Moody’s. As a result, this may also mean the FED will not raise interest rates in the US as fast as expected. This might therefore in turn act to dampen rate rises in other countries.

A still-positive outlook for operating profits is now marred by considerable uncertainty. What may degenerate into an extended trade war of attrition could preserve financial market volatility indefinitely.

Given the global complexities of modern supply-chain management, a surprisingly large number of U.S.-based businesses may delay capital spending and staffing plans until trade-related uncertainties are sufficiently resolved. As it now stands, tariff-driven increases in material costs have compelled some companies to rein in employee compensation for the purpose of protecting profit margins. In addition, higher materials costs have been weighing on the credit quality of some manufacturers that use steel intensively.

Tariffs explain why year-to-date advances of 40% for the spot price of steel and 21% for the most actively traded lumber futures contract are so much greater than the accompanying 0.5% dip by Moody’s industrial metals price index (which excludes steel’s price). To the degree tariffs increase the costs of materials and inventories, businesses will tighten their control of other costs, the most prominent being employee compensation.

Relaxation of China’s Monetary Policy May Limit Upside for Fed Funds

Any trade war will require the use of all policy weapons. Recently, the Peoples Bank of China adopted a more accommodative monetary policy ostensibly in response to slower than expected domestic spending and a need to enhance systemic liquidity. The latter brings attention to difficulties arising from troubled loans. Though not specifically mentioned, one of the intentions of the latest relaxation of China’s monetary policy is to allow China to better withstand any loss of economic activity to a trade war.

Not to be overlooked is how the $521 billion of U.S. merchandise imports from China during the 12-months-ended April 2018 far exceeded the comparably measured $133 billion of U.S. merchandise exports to China.

Worth mentioning is how that imbalance includes billions of dollars of goods that are manufactured in China for U.S.-domiciled businesses. China is unrivaled as far as being a manufacturing platform for companies based in advanced economies. Thus, many American businesses and shareholders are vulnerable to tariffs imposed on imports from China.

In quick response to the relaxation of China’s monetary policy, the U.S. dollar rose to 6.604 yuan. Though the latter was the highest yuan price of the dollar since mid-December 2017, it was still -4.7% under December 2016’s average of 6.929 yuan. Of course, Chinese officials worry that expectations of a weaker yuan might prompt unwanted capital outflows from China.

Nevertheless, a wider interest rate gap between the U.S. and China would favor a cheaper Chinese currency versus the dollar. In turn, a depreciation by China’s currency vis-a-vis the dollar would offset part of any tariff-induced increase in the dollar price of U.S. imports from China.

All else the same, a costlier dollar exchange rate diminishes prospects for U.S. corporate earnings. The recent strengthening of the dollar against a broad array of currencies from both advanced economies and emerging market countries will reduce (i) the global price competitiveness of goods and services produced in the U.S. and (ii) the dollar value of foreign-currency denominated earnings from abroad.

On the positive side, a stronger dollar will lessen the risk of faster consumer price inflation. As a result, a stronger dollar can substitute for Fed rate hikes.

Ten-year Treasury Yield Is Less Likely to Have an Extended Stay Above 3%

In view of how recent rate hikes and a nearly 3% 10-year Treasury yield disrupted financial markets outside the U.S., the Federal Open Market Committee’s latest median projection of a 2.375% midpoint for fed funds by the end of 2018 may prove to be too high.

Recognizing the risks implicit to a possible trade war and the disinflationary effect of further dollar exchange rate appreciation, the futures market disputes the FOMC’s median projection for fed funds and recently assigned only a 44.2% probability to a year-end midpoint for fed funds that exceeds 2.125%. If other central banks pursue policies that facilitate dollar appreciation, the Fed may have no choice but to stretch out its planned normalization of U.S. monetary policy.

Just prior to the latest outbreak of trade-related stress, the 10-year Treasury yield closed at June 14’s 2.94%. Since then, the benchmark Treasury yield eased to a recent 2.83%. From the perspective of the accompanying 3.0% drop by the market value of U.S. common stock since June 14, the decline by the 10-year Treasury yield has not been especially deep.Nevertheless, a downwardly revised outlook for Treasury yields has prompted a 5.8% advance by the Dow Jones Utility index since June 14.

However, despite the possibility of lower than earlier expected mortgage yields, an index of housing-sector share prices has sunk by 5.1% since June 14. The latter brings attention to how trade related uncertainties and financial market volatility may force businesses to show restraint when it comes to staffing and employee compensation.

In turn, the upside for home sales may continue to be limited by the subpar financial condition of many lower- and middle-income households. The pitifully low 3.1% personal savings rate of the 12-monthsended April 2018 highlights the well below-average financial flexibility of many Americans. Implicit to such a very low average for the personal savings rate is the likelihood that 33% to 40% of U.S. households save an imperceptible, if any, amount of their after-tax income.

When a financially stronger middle class provided a hospitable breeding ground for the persistently rapid consumer price inflation of 1972-1981, the personal savings rate averaged a much higher 11.4%. Yes, consumer price inflation may spurt higher every now and then, but today’s average American consumer may lack the financial wherewithal necessary for the establishment of stubbornly rapid price inflation.

VIX and Baa Yield Spread Imply High-Yield Bond Spread Is Unsustainably Thin

Though a composite high-yield bond spread has widened from June 14’s 345 basis points to the 370 bp of June 27, the latter still remains well under the spread’s post September 2003 median of 460 bp. However, a recent VIX of 18.0 points was noticeably above its accompanying median of 15.9 points. In the event the VIX remains above 16.5 points, the high-yield spread is likely to widen to at least 425 bp.

A recent long-term Baa-grade industrial company bond yield spread of 198 bp that well exceeds its post September 2003 median of 178 bp reinforces the negative outlook for high-yield bonds. As inferred from the historical record, a 198 bp spread for the long-term Baa industrials has typically been associated with a 544 bp midpoint for the high-yield spread, which is much wider than the recent 370 bp. It was in 2007 that a well below trend high-yield spread was joined by a significantly above average Baa yield spread.

Since late 1987, the high-yield bond spread shows a very strong correlation of 0.92 with the long-term Baa industrial company bond yield spread.

Norway Maintains Stricter Oslo-specific Mortgage Regulations

Household debt in Australia is around 190%, which is high by any standard, but Norway wins the award for the most indebted households at 224% and this is a structural risk for Norway’s Banks. So its interesting to compare the measures taken there with Australian regulation, which appears to be several years behind the pace….

Last Tuesday, the Norwegian Ministry of Finance extended until 31 December 2019 its strict regulations on mortgage underwriting standards, introduced in January 2017 and scheduled to expire on 30 June 2018. In addition, the ministry decided to maintain the stricter Oslo-specific measures regarding loan-to-value (LTV) ratios on secondary homes of 60%, rejecting the Norwegian Financial Services Authority’s (FSA) March 2018 proposal to remove the Oslo-specific measures.

Extending these measures past their scheduled expiration will dampen house price inflation and contain borrower leverage, a structural risk for Norway’s banks, both credit positive says Moody’s.

The proposal maintains the maximum LTV for home equity credit lines at 60%, the 85% LTV cap on mortgages, and the limit on borrowers’ aggregate debt at 5x gross annual income. It caps the portion of mortgages that do not comply with the national applicable LTV ratio limit at 10%. However, the ministry decided against the FSA’s suggestion of eliminating the existing LTV limit of 60% for secondary homes located in Oslo as well as applying nationwide the Oslo-specific cap on the portion of mortgages non-compliant with the LTV ratio of 8% (see exhibit). By maintaining the 8% cap on the portion of non-compliant mortgages only in Oslo and not extending it nationwide, the ministry has reduced the possibility that exceptions to the LTV rule for national lending would become concentrated in Oslo, a credit positive for cover pools that have concentrations in Oslo loans.

Norwegian banks are retail focused, with mortgages accounting for almost 50% of their total lending. The extension of the regulation until December 2019 is a step toward improving mortgage underwriting standards by containing borrower leverage. Household debt reached a record 224% of disposable income in December 2017, far above that of other Nordic countries, and we expect it to remain close to those levels over the next 12-18 months. Substantial household debt remains a structural risk for Norway’s banks. However, a preliminary analysis by Norway’s central bank has shown that the introduction of a maximum debt-to-income ratio requirement in 2017 has resulted in lower debt growth, particularly in municipalities with a high share of highly leveraged homebuyers.

The ministry’s extension of the regulation will also support the quality of mortgage loans in the cover pools of Norwegian covered bonds by suppressing LTV ratios and reducing the risk of cover pool losses as a result of borrower defaults and falling house prices. Requirements on loan amortization also support reduction of LTV ratios in more seasoned loans, although many cover pools continue to have material levels of interest-only loans and flexi loans that have delayed amortisation provisions.

Maintaining Oslo-specific measures in combination with our expectation of interest rate hikes will limit retail credit growth in the Oslo metropolitan area, particularly as it relates to investment properties and highly leveraged individuals. We expect DNB Bank ASA, which has the largest share of Oslo’s retail market, to be most affected by the extension.

During 2018, house prices have grown 4.5% after falling 4.2% in 2017 from a peak in March 2017. However, the extension of stricter underwriting measures along with our expectation of higher interest rates after seven years of cuts and the completed construction of a large number of new dwellings by this fall will likely restrain house price inflation over the next 12-18 months.

ASIC Scrutiny Good for Fintechs – Moody’s

The close attention of ASIC that prompted Prospa to scuttle its IPO will ultimately work out well for the fintech small business lending sector, says ratings agency Moody’s via Fintech Business.

In a note published on Friday, Moody’s Investors Service senior analyst John Truijens said ASIC’s focus on Australian fintech lenders will be a “credit positive” for the sector over the long term.

Ultimately, Mr Truijens said, closer regulation of fintech small business lenders will result in improved transparency and governance in the sector.

The comments come after Prospa indefinitely delayed its planned IPO on June 6 with minutes to spare following queries from ASIC about the terms of its loans.

Regulators (and the royal commission) are reviewing unfair loan contract terms, said Moody’s – and the fintech sector is working on a new code of conduct to “lift transparency” on the sector.

Because most small business loans are unsecured, lenders will have less incentive to safeguard their position by acting on non-monetary default clauses, said Moody’s.

“We therefore expect that any adjustment required to contract terms to address any of these unfair terms will have a muted impact on the credit quality or commercial value of such loans,” said the note.

“Unfair contract term law gives courts a power to find that a term is ‘unfair’. If a contract term is found to be unfair, it will be void, which means it is not binding. The rest of the contract will continue to bind the parties if it is capable of operating without the unfair term,” said Moody’s.

The fintech small business lending sector, which has already pushed for self-regulation, is in the process of creating a code of conduct with a target date of 30 June 2018.

“In light of the development of the code of conduct, we expect that the disclosure of interest rates implicit in loan contracts will be adopted by the industry as the standard practice in the future,” said Moody’s.

“Greater transparency around the cost of loans and the improved governance resulting from an industry code of conduct will enhance the sustainability of the sector.

“There is therefore reduced risk that a borrower’s obligation to pay their loan will be waived due to any of the non-monetary default clauses under review,” said the note.

Bank of Ireland announces a credit-negative shift toward growth and away from deleveraging

Last Wednesday at an investor day, Bank of Ireland announced a challenging growth strategy for the next three years that moves the bank to a growth phase from a restructuring phase according to Moody’s.

BOI plans to increase its loan book by 20%, or €14 billion, by 2021 (20% on the retail Irish portfolio, 10% on its retail UK portfolio and 50% on its corporate portfolio), with a 4.7% compound annual growth rate. It expects to achieve growth mainly by financing new house building and increasing residential mortgages and small and midsize enterprise (SME) lending in both Ireland and the UK, where it operates through subsidiary Bank of Ireland (UK) Plc. The bank’s new strategy follows years of deleveraging.

BOI’s plan is credit negative because its restructuring is still ongoing and presents many challenges. Additionally, the announced shift towardgrowth is focused on corporate loans and in particular on the construction and real estate sectors, which we consider high-risk sectors. We believe that BOI’s new strategy increases its exposure to downside risks, and particularly increases its UK operation’s vulnerability to macroeconomic uncertainties related to Brexit and a potential slowdown or downturn in the Irish property market.

Even though BOI’s stock of problem loans diminished to €4.0 billion at year-end 2017 from €6.2 billion at year-end 2016, one-third of its Irish buy-to-let loans are classified as nonperforming and about 15% of the Irish non-property SME portfolio is nonperforming. The property and construction portfolio, to which the bank plans to increase its exposure, remains the worst performer, with 19% of total loans classified as nonperforming at year-end 2017. BOI has a large portion (€4.6 billion) of vulnerable restructured loans that we consider as having a high probability of falling back into nonperformance in the event of macroeconomic headwinds.

The new strategy primarily aims to boost the bank’s profitability (target return on tangible equity above 10% by 2021 versus 6.9% in 2017) through higher loan volume and stronger operating efficiency (the bank aims to reduce its cost base to €1.7 billion in 2021 from €1.9 billion in 2017, with a target cost/income ratio of 50% by 2021). The bank also plans to expand its wealth management and insurance businesses, and has increased the planned investment in its digital and commercial transformation to €1.4 billion from €900 million previously budgeted.

BOI expects sound GDP performance in both Ireland and the UK to support its growth strategy. The bank also expects rising employment and increasing population that increases housing demand, particularly in the main Irish cities, where, despite the past five years of recovery, the housing undersupply problem has remained. BOI CEO Francesca McDonagh, who was appointed in May 2017, set the new strategic plan and moved away from the bank’s previous strategic focus on deleveraging and asset de-risking

What The Ratings Agencies Are Saying

Ratings Agencies are a funny breed, and I am not going to enter the debate as to whether they are ahead of the curve – some will say their track record around the time of the GFC was appalling – and whether they are truly independent; but they are taken seriously by the markets, which reacts when they publish their reports. So today we look at Moody’s assessment of Australia, and Standard and Poor’s Mortgage Delinquency Reports.

So first, to Moody’s who confirmed their rating of Aaa and which puts Australia in an exclusive club alongside United States, Switzerland, Sweden, Norway, Denmark, Netherlands and New Zealand.

They just reviewed the rating (some other agencies still have a negative watch on Australia, meaning they are more concerned about the outlook, given our exposure to foreign trade and debt) and Moody’s concluded that thanks to good GDP numbers, relatively low (on an international basis) Government debt – at only 42% of GDP, though up from 26.5% five years ago and strong institutions (RBA and APRA), the rating is confirmed. The bonus income from higher resources prices also helped.

This rating is important because it directly translates to the cost of government debt, and is a signal to the international community of the economic strength of the country.

Now Moody’s did highlight some concerns about the Government needing to control spending in order to bring the budget back into balance as forecast, against a fraught political background – by which I assume they mean the independents in the Senate and their perchance for blocking the passage of legislation; and also the risks from high levels of household debt in a flat wage environment.  But they make the point that on a relative basis Australian Households are still enjoying a high per capital income ($50,334 in 2017) is in line with other Aaa economies, and this they say, offers capacity to absorb income shocks, and a base to support taxes as needed.

They suggest that household income growth will be lower than government forecasts, but they are still looking for GDP growth around 2.75%. They also suggest that Government spending will remain under pressure given the expected 6% rise in social welfare programmes including health and NDIS.

In terms of risks, they see two first is rising household debt, which they say exposes the economy and government finances. Second is Australia’s reliance on overseas funding, which may be impacted by changes in internal investor sentiment. Rate rises abroad might lift the cost of government and bank borrowing, adding extra pressure on the economy. But their judgement is, these risks are not sufficient to dent the prized Aaa ratings.

But, now square this with S&P Global Ratings RMBS Performance Watch to 31st March 2018.  They revised arrears data for February and March 2018 to reflect an originators’ revisions to arrears data for these months. As a result, the prime 30 day SPIN including noncapital market issuance was 1.37% in Q1 2018, up from 1.07% the previous quarter.

They say that loans more than 90 days in arrears were at a historically high level at the end of Q1, indicating that mortgage stress has increased for some borrowers.

In addition, the major banks which account for around 43% of total prime RMBS loans outstanding recorded the largest movement in arrears during Q1 and are now trending above the prime SPIN. On the other hand, nonbank financial institutions saw their loans more than 30 days in arrears fall to 0.50% in Q1 2018 from 0.60% in Q4 2017.

Arrears for nonconforming RMBS increased to 4.19% in Q1 2018 from 4.08% in Q4 2017. Some of this increase is off the back of a decline in outstanding loan balances. Arrears on investment loan arrears reached 1.19% in Q1. Owner-occupier loan arrears were 1.56% at the end of Q1.

Half of all interest-only loans in Australian RMBS transactions will reach their interest-only maturity date by 2019. We expect this transition to be more pronounced for investor loans, of which 46% have an interest-only period compared with 12% of owner-occupier loans underlying RMBS transactions.

Prepayment rates are declining. The average prepayment rate for March is 19.58% and they believe some borrowers could be facing refinancing difficulties in the face of tougher lending conditions. A slowdown in refinancing activity can precipitate a rise in arrears, particularly in the nonconforming sector because borrowers have fewer options available to manage their way out of financial difficulty.

Across the states, the Australian Capital Territory in Q1 2018 again had the lowest arrears of all the states and territories, at 0.68%. Western Australia meanwhile again recorded the nation’s highest arrears, at 2.71%. Arrears rose during Q1 in most parts of the country. South Australia recorded the biggest year-on-year improvement in arrears, with loans more than 30 days in arrears declining to 1.48% in Q1 2018 from 1.63% in Q1 2017.

Nine of the 10 worst-performing postcodes in Q1 2018 are in Queensland and Western Australia. These included Butler, and 6036, Byford 6122, both in Western Australia, Blenheim 4341 and Bungil 4455 in Queensland, Beechboro 6063, Kensington 6151 and Blythewood 6208 in Western Australia, Barkly 4825 in Queensland, Eaton in Western Australia and Beelbangera 2680 in New South Wales.

They called out some important risk factors around interest rate rises and debt servicing.

Household indebtedness in Australia is high, particularly by international standards. This does not provide much headroom if the economic situation deteriorates or when interest rates start rise. Low interest rates and improving employment conditions are keeping mortgage arrears low in the Australian mortgage sector, but Australian borrowers’ sensitivity to rate rises has increased. A rapid ratcheting up of interest rates, as occurred between September 2009 and October 2011, when rates went up by around 2 percentage points, would see arrears go beyond their previous peaks, given household indebtedness has continued to increase during the past five years.

Debt serviceability issues are exacerbated in more subdued economic climates when refinancing opportunities are limited, particularly for borrowers of a higher credit risk, because lenders invariably tighten their lending criteria. In this scenario, some borrowers will find it harder to manage their way out of their financial situation, leading to higher arrears and potential losses. In our opinion, self-employed borrowers, nonconforming borrowers, and borrowers with high LTV loans are more likely to face greater refinancing difficulties in more subdued economic climates.

Property prices affect the level of net losses in the event of borrower default. From an RMBS perspective, the strong appreciation in property prices has increased borrowers’ equity for well-seasoned loans, and this helps to minimize the level of losses in the event of a borrower default. While property price growth is slowing, most loans underlying Australian RMBS transactions are reasonably well insulated from a moderate decline in prices. Given the high seasoning of the Australian RMBS sector of around 64 months, most borrowers have built up a reasonable degree of equity, as evidenced by the sector’s weighted-average LTV ratio of 60%. This provides a buffer against a moderate property price decline. Higher LTV ratio loans are more exposed to a decline in property prices because they have not built up as much equity to absorb potential losses. Around 14 % of total RMBS loans have high LTV ratios of more than 80%.

They conclude that arrears to trend higher if interest rates rise. Improving employment conditions and historically low interest rates will keep defaults low in the short to medium term, however. Economic headwinds such as softening property prices, rising interest rates, and tougher refinancing conditions will create cash-flow pressures for some borrowers.


So, two agencies with different perspectives. Personally, based on the data we have from our surveys, and as we discussed in our recent posts on both mortgage stress and household financial confidence, we suspect the SPIN data is closer to the mark – but bear in mind that RMBS mortgage pools are carefully selected, and many not contain higher risk loans. So even this may be understating the real state of play.

And in a way that nicely highlights the uncomfortable juxtaposition between the top level macroeconomic picture, and real life among Australian households.  The trouble is, the state of the latter is very likely to impinge on the former as mortgage debt grinds on. And this could certainly lead to more issues down the track

Italy’s proposal to ring-fence banks’ investment banking operations will have limited effects

From Moody’s

Last Wednesday, Italian Prime Minister Giuseppe Conte announced that the newly formed government will seek to separate investment banking operations from other commercial operations, similar to the recently implemented ring-fencing in the UK.

Although the government’s goal is to protect retail depositors, we believe that ring-fencing, if implemented, would have a limited effect on the operations of Italian banks because only a handful of banks have material capital markets operations that could drive losses to retail clients.

Unlike other European banks, Italian banks’ investment banking operations have not produced large losses because of their focus on more traditional commercial banking activities. Additionally, a large share of Italian banks’ investment banking activities are already booked in separate legal entities, requiring only minor structural changes.

UniCredit S.p.A. already books a large portion of its corporate and investment banking division at its wholly owned German subsidiary UniCredit Bank AG. Intesa Sanpaolo S.p.A. books its capital market operations at its wholly owned subsidiary Banca IMI S.p.A. Banco BPM S.p.A.  and Banca Monte dei Paschi di Siena S.p.A. have very limited capital market operations, and conduct most of their capital market activities through fully owned subsidiaries: Banca Akros for Banco BPM and MPS Capital Services S.p.A. for Montepaschi. Mediobanca S.p.A. already carries out its retail and investment banking activities in different legal entities.

We believe the portion of assets that would be transferred to non-ring-fenced banks would be limited for two reasons. The first is that Italy’s ring-fencing regulations will likely follow the UK model of applying only to large banks. The second is based on our calculation using the percentage of so-called Level 2 assets (whose values can be approximated using observable prices as parameters) and Level 3 assets (whose values banks estimate themselves because of a lack of observable prices) as a proxy for capital market operations, which leads us to estimate that Italy’s large banks’ Level 2 and 3 assets comprised less than 7% of their total assets as of December 2017, as shown in the exhibit.

These amounts are close to the 7% of assets that Lloyds Banking Group plc  recently transferred to the newly established non-ring-fenced bank Lloyds Bank Corporate Markets plc. For Lloyds, before the implementation of ring-fencing, we had noted that the new framework was unlikely to materially affect the bank’s strong fundamentals; since Italian banks and Lloyds have similar business models focused on retail activities with little capital market operations, we believe that ring-fencing will also not materially affect Italian banks’ fundamentals.

Italy’s proposal to unwind mutual-bank reform is credit negative

In addition, Italy’s Prime Minister Giuseppe Conte announced that the newly formed government would seek to reverse the previous government’s reforms to consolidate the fragmented mutual-bank sector, without providing a specific rationale. If adopted, mutual banks would not be required to become affiliated with a group with shared cross-guarantees — an attempt to consolidate Italy’s highly fragmented banking system. The proposal, if enacted, would be credit negative for mutual banks because these small institutions will remain exposed to a fragile operating environment, with limited product diversification and economies of scale, and will not reap the benefits of being part of a large and cohesive group.

Mutual banks are savings banks in which each shareholder has one vote irrespective of the number of shares held. In December 2017, Italy had 295 mutual banks, which in aggregate comprised a material portion of the Italian banking system, accounting for a 7.8% market share for retail funding (deposits and bonds) and a 7.2% market share for loans. With the reform to consolidate mutual banks, the previous government wanted to improve financial stability in Italy by creating larger and more solid mutual banking groups. Doing so would have created banks with sufficient scale to access the international equity and debt markets and face challenges from the operating environment, reducing the risk of weaker banks failing.

On a standalone basis, single mutual banks are generally small, averaging 14 branches, 100 employees and around €400 million in loans and retail funding. If they were combined into a single group, mutual banks would be the third-largest banking group in Italy, with €131 billion loans after UniCredit S.p.A. and Intesa Sanpaolo S.p.A. And, although some have performed well, several have been put under administration by the Bank of Italy or required rescue by other mutual banks.

Currently, mutual banks have a certain degree of independence and can decide at their discretion the level of integration within Italy’s mutual bank network. This structure leaves them exposed to daunting challenges including competition, low profitability from traditional mortgage and savings business in the low interest rate environment, large investments in digitalisation to meet changing customer behaviour and

US Ratio of Debt to GDP Climbs Ever Higher

From Moody’s

Perhaps the speed at which GDP grows relative to debt matters more than the ratio of debt to GDP. The faster GDP grows relative to debt, the lower might be the risks surrounding the repayment of debt obligations.

Expressed differently, the greater the return from debt capital, the lower should be the incidence of delinquencies, charge offs, and defaults. When productively employed, debt capital can more than pay for itself.

The U.S.’ ratio of private and public nonfinancial-sector debt has soared from 1968’s 131% to 2017’s 253% of 2017. Nevertheless, the 10-year average annualized growth of U.S. real GDP decelerated from the 4.9% of the span-ended 1968 to the 1.4% of the span-ended 2017. Over time, higher ratios of U.S. nonfinancial-sector debt to nominal GDP failed to prevent a deceleration by U.S. real GDP’s 10-year average annualized growth rate. Additional debt may have warded off hard times, but it apparently fell considerably short of lifting the underlying pace of business activity.

Just as the velocity of money (or the ratio of GDP to the M2 money supply) has slowed over time so has the velocity of debt (or the ratio of GDP to nonfinancial-sector debt). Today each dollar of nonfinancial-sector debt is accompanied by only $0.40 of GDP. By contrast, in 1968, each dollar of debt was joined by $0.76 of GDP. Each additional dollar of debt may now add considerably less to GDP than it did 50 years ago.

The Productivity of Debt Varies Across Business Cycle Upturns

Similar to how the relationship between M2 growth and GDP growth varies over time, the relationship between nonfinancial-sector debt growth and economic growth is far from constant. The 37% cumulative increase by nonfinancial-sector debt of the current business cycle upturn has been joined by a cumulative 38% increase in nominal GDP. In stark contrast, during the previous economic recovery of 2002-2007, the cumulative 37% increase by nominal GDP lagged far behind the 65% expansion of nonfinancial-sector debt. The imbalance of 2002-2007 reflects an excessive increase in home mortgage debt that outran personal income by enough to ultimately spark a mortgage repayment crisis.

Though 1991-2000’s upturn had the cumulative 73% increase by nominal GDP outpacing debt’s 69% increase, the high-yield default rate trended higher from 1998’s second half into the start of 2001’s recession. However, the late payment rates of household debt were relatively well behaved.

Treasury Bond Yields Decline Amid Rising Ratio of Debt to GDP

Despite how nonfinancial-sector debt moving 10-year average has increased from 1978’s 132% to 2017’s 245% of nominal GDP’s moving 10-year average, the 10-year Treasury yield’s accompanying moving 10-year average fell from 7.22% to 2.59%. The declining trend of the 10-year Treasury yield amid a rising ratio of debt to GDP seems counterintuitive. After all, shouldn’t an increase in the supply of debt relative to overall economic activity lower the price of credit market instruments and, thereby, put upward pressure on interest rates?

In all likelihood, expectations concerning core consumer price inflation and real economic growth wield more influence over interest rates than the amount of outstanding debt relative to GDP. It may be nonsensical to expect interest rates to decline as outstanding debt rises relative to GDP all else being the same. Nonetheless, a high ratio of debt to GDP may create a repayment burden that heightens the economy’s sensitivity to higher interest rates. If each percentage point increase by interest rates slows business activity more quickly as the ratio of debt to GDP climbs higher, the upside for benchmark interest rates may be lower than otherwise as an economy’s debt leverage steepens.

Nominal GDP’s Underlying Growth Rate Leads Treasury Bond Yields

The record shoes that the growth of nominal GDP tends to lead the path taken by the 10-year Treasury yield. When nominal GDP’s 10-year average annualized growth rate accelerated from the 5.1% of the span-ended 1963 to its 10.6% zenith of the span-ended 1981, the 10-year Treasury yield’s moving 10-year average would increase from 1963’s 3.56% to 1981’s 8.69% and would not crest until reaching the10.69% of 1988.

Note how nominal GDP’s 10-year average annualized growth rate exceeded the 10-year Treasury yield’s moving 10-year average through 1981. Thus, there is no guarantee that the 10-year Treasury yield will be equal to or greater than nominal GDP growth.

By 1988, the 10-year average annualized growth rate of nominal GDP had slowed to 8.3%. A subsequent deceleration by nominal GDP’s 10-year annualized growth rate to 2017’s 3.0% was joined by a drop for the moving 10-year average of the 10-year Treasury to 2017’s 2.59%.

According to the recent trend and the latest Blue Chip consensus forecasts, nominal GDP’s 10-year average annual growth rate bottomed in 2017 and is likely to rise to 3.3% in 2018. Thereafter, the 10-year growth rate is expected to inch higher until peaking at the 4.3% of the span-ended 2027. By 2027, the 10-year Treasury yield’s moving 10-year average is expected to have reached 3.69% and is projected to extend its climb to 3.85% by 2029.

Apparently, the Treasury bond yield forecasts of the Blue Chip consensus make no allowance for the likelihood of a recession by 2029. After climbing up from 2017’s 2.33% to 3.0% in 2018 and 3.4% in 2019, the consensus has the 10-year Treasury yield remaining at 3.8% from 2020 through 2024 and then averaging 3.9% during 2025 through 2029. To the contrary, when the next recession arrives most likely well before 2029, the benchmark Treasury bond yield will probably temporarily sink under 2%.

Federal Debt Accelerates as Debt Growth Elsewhere Is Unchanged

On June 7, the Federal Reserve released its first-quarter 2018 estimates of outstanding private and public nonfinancial-sector debt via the Financial Accounts of the United States. In a manner that helps to explain 2018’s upswing by interest rates, the year-to-year growth rate of the U.S.’ private and public nonfinancial-sector debt quickened from Q1-2017’s 3.7% to Q1-2018’s 5.1%. However, that acceleration was the offshoot of a jump by the annual increase of U.S. government debt from Q1-2017’s 3.3% to Q1-2018’s 7.4%. The remaining nonfinancial-sector debt grew by 3.9% yearly for both Q1-2017 and Q1-2018.

The year-to-year growth rate for U.S. nonfinancial-corporate debt edged higher from Q1-2017 5.0% to Q1-2018’s 5.2%. First-quarter 2018’s $5.426 trillion of outstanding U.S. nonfinancial-corporate bonds increased by 4.3% annually, while the $5.396 trillion of outstanding nonfinancial-corporate debt excluding bonds and mortgages advanced by 7.1% annually. In 2017’s first quarter, the annual increases were nearly identical at 5.2% for bonds and 5.3% for debt excluding bonds and mortgages.

The simultaneous slowing of bond growth and acceleration by the outstandings of variable-rate business loans and commercial paper suggest companies do not expect an extended and large increase by benchmark Treasury bond yields.

The much faster growth of Treasury debt vis-a-vis corporate bonds helps to explain why the average 10-year Treasury yield jumped up from Q1-2017’s 2.44% to Q1-2018’s 2.76%, while corporate bond yieldspreads over Treasuries narrowed from 167 bp to 153 bp for the long-term Baa industrial company bonds and from 397 bp to 353 bp for high-yield bonds.

ANZ’s regulatory capital will increase with OnePath Life NZ sale to Cigna

Last Wednesday, Australia and New Zealand Banking Group Limited  announced that it had agreed to sell its New Zealand life insurance business OnePath Life NZ Limited to Cigna Corporation, a global healthcare services organization with an established New Zealand specialist insurance business. The planned sale is credit positive for ANZ because it will lift the group’s Level 2 Common Equity Tier 1 (CET1) ratio by approximately 15 basis points, says Moody’s.

Total consideration for the sale is NZD700 million and the company expects to generate a gain of approximately NZD50 million. As part of the agreement, ANZ will enter a 20-year strategic alliance with Cigna to offer life insurance products through ANZ’s distribution channels. ANZ expects to complete the sale during its 2019 fiscal year, which ends September 2019.

The sale follows ANZ’s announcement in December 2017 that it had agreed to sell its Australian insurance business to Zurich Insurance Company Ltd. (financial strength Aa3 stable) for a total consideration of AUD2.85 billion.

The sale comes as capital requirements for Australian banks are increasing. The Australian Prudential Regulation Authority announced in July that it is increasing the minimum capital requirements for ANZ and domestic peers Commonwealth Bank of Australia, National Australia Bank Limited  and Westpac Banking Corporation to 9.5% by 2021 from 8% currently, including a capital conservation buffer and a domestic systemically important bank charge. Although the higher capital requirements will take effect in early 2021, the regulator said it expects banks to exceed the new requirement by 1 January 2020 at the latest.

ANZ’s sale of OnePath Life NZ, combined with the previously announced sale of its Australian life insurance business and it pension, investments and aligned dealer groups’ business, will boost ANZ’s CET1 ratio by approximately 95 basis points. That includes 65 basis points from the sale and reinsurance of its Australian life insurance business, 15 basis points from the sale of pensions, investments and aligned dealer groups’ business and 15 basis points from the sale of OnePath Life NZ). The transactions will significantly raise ANZ’s CET1 ratio well above the future minimum requirement of 9.5%.

Consequently, we expect that ANZ will continue to return surplus capital to shareholders in line with its announced AUD1.5 billion on-market share buyback. ANZ had completed AUD1.1 billion of share buybacks as of 31 March 2018. The additional capital generated by these business sales may provide capacity for future share buybacks. Despite these capital distributions, ANZ remains highly capitalized, with excess capital above the higher future minimum requirements of AUD 5.7 billion, assuming it completes the full AUD1.5 billion on-market share buyback.