Investment Property Lending Sucking Finance From Business

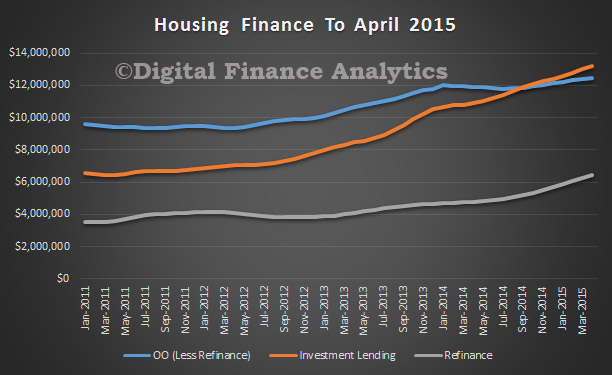
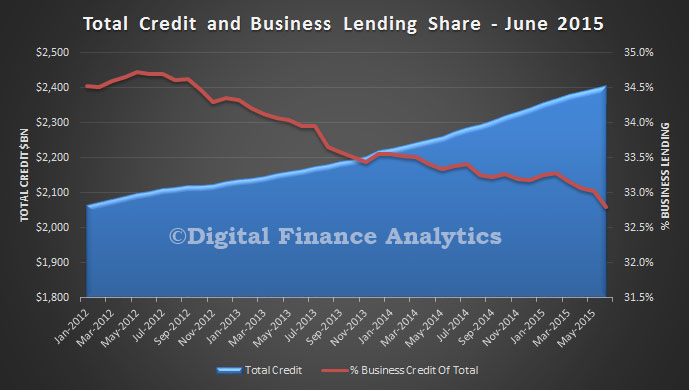
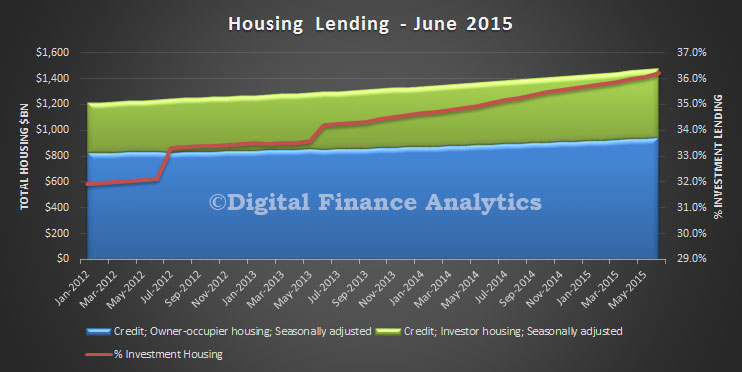
The latest data form the RBA on credit aggregates to June 2015, tells the continuing story of growing investment property lending, and a relative reduction in lending to business. The data on total loans outstanding (stock) shows there was a fall in lending to business in the month of 0.36%, which translates to a growth of 4.3% for the year to $789 bn. On the other hand, lending for housing rose 0.6% in the month, and 7.3% for the year, (higher than last year at 6.4%) to $1,481 bn. Owner occupied housing rose 0.47% to $945 bn, whilst investment lending grew 1.10% to $536 bn. Other personal lending rose 0.15% to $137 bn.

RBA-Credit-June-2015
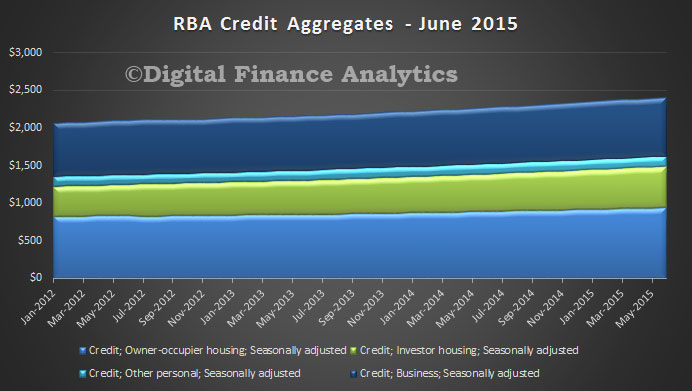
Total lending to business as a share of all lending fell again to 32.8%, this is not healthy as productive growth comes from business investing in their futures. This is not as strong as we need to sustain the economy.

RBA-CreditBusiness-June-2015Looking at the mix of lending for housing, investment lending was up to 36.2%. It has never been higher. This inflates house prices, and banks balance sheets, but the wealth is artificial, and unproductive.

RBA-CreditHousing-June2015 Finally we think there are some funnies in these numbers, which when we have completed the analysis of the APRA monthly banking statistics, we will comment on further. Suffice it to say, it seems maybe some loans were reclassified last month from owner occupied to investor loans, so might be distorting the data.

Housing Finance Up In April Is Investment Driven

The ABS released their Housing Finance Statistics to April 2015 today. The trend estimate for the total value of dwelling finance commitments excluding alterations and additions rose 1.4% to $32,109 m.

Investment housing commitments rose 1.4% and owner occupied housing commitments rose 1.3%. This is a strong result, and ahead of expectations. We suspect investors are bringing purchase decisions forwards ahead of possible anticipated lending tightening later. Further evidence that the dial needs to be turned back.

Looking at the trends, more than half of new loans (excluding refinance were for investment purposes, and the value of refinancing continued to track higher as borrowers move on to the new lower rate offers.

HousingFinanceTrendsApril2015In trend terms, the number of commitments for owner occupied housing finance rose 0.7% in April 2015. In trend terms, the number of commitments for the purchase of new dwellings rose 1.1% and the number of commitments for the purchase of established dwellings rose 0.8%, while the number of commitments for the construction of dwellings fell 0.2%

HousingFinanceApril2015In original terms, the number of first home buyer commitments as a percentage of total owner occupied housing finance commitments rose to 15.2% in April 2015 from 15.1% in March 2015. However, in NSW it was lower, at 11%, in an environment where investment lending is hot.

FTBApril2015However, the true first time buyer picture is more complex with a continued lift in FTB investors, as shown in the DFA adjusted picture. More than 4,000 FTB investors joined the ranks this month, a record, compared with about 7,000 OO FTB. If this continues, we expect investors to overtake OO FTB by the end of the year.

FTBAdjustedApril2015

March Monthly Banking Stats Update

APRA published their monthly banking statistics for March. Overall housing lending was $1.336 trillion by the banks (the RBA number of $1.45 trillion includes the non banks). This was a rise of  0.59% in the month, with owner occupied loans lifting 0.46% and investment loans 0.84%. Investment loans accounted for 35.1% of all loans in the month. Looking at the individual bank data, there was little change, with CBA holding the largest share of owner occupied loans, and Westpac, investment loans. Macquarie continues its growth path.

MortgageMarketShareMarch2015Looking at the portfolio movements, ING and Suncorp both lost portfolio share, whilst Macquarie continues to expand at pace. Members Equity and Bendigo/Adelaide also grew well above the market average.

MovementsMortgageMarch2015Looking at the annual growth rates, for owner occupied loans, Macquarie led the way (partly thanks to acquisition) and ANZ was the major with the largest growth.

YOYOOMovwementsMarch2015On the investment lending side, where there is more interest in not exceeding the 10% “alert” level, we see that ANZ and Westpac were at 10%, whilst CBA and NAB were above the 10% mark. Macquarie and Members Equity continue to grow their investment lending book well above system. No doubt the regulators are having a quiet word! As APRA said, “strong growth in lending to property investors — portfolio growth materially above a threshold of 10 per cent will be an important risk indicator for APRA supervisors in considering the need for further action”

YOYInvetsmentMortgagesMarch2015Talking about APRA, their supervisory lens also includes serviceability buffers – “loan affordability tests for new borrowers — in APRA’s view, these should incorporate an interest rate buffer of at least 2 per cent above the loan product rate, and a floor lending rate of at least 7 per cent, when assessing borrowers’ ability to service their loans. Good practice would be to maintain a buffer and floor rate comfortably above these levels”. So how come we do not get any reporting on this dimension? As discussed before, this should be addressed.

Deposits grew at 0.47%, so slower than lending, indicating that some banks are relying more on other funding avenues to support growth. Deposits rose by $8.6 billion to a total of 1.8 trillion. There was little relative movement amongst the major players in terms of share, though we do see deposit repricing in hand, with rates continuing to falling.

DepositShareMarch2015 Individual movements are charted below for selected banks.

ShareMovementsDepositsMarch2015     Finally, the credit card portfolio grew by $169 million in the month, and sits at $41,6 billion. Little change in the market shares reported this month.

CardsSharesMarch2015