Housing Finance Leaps Higher

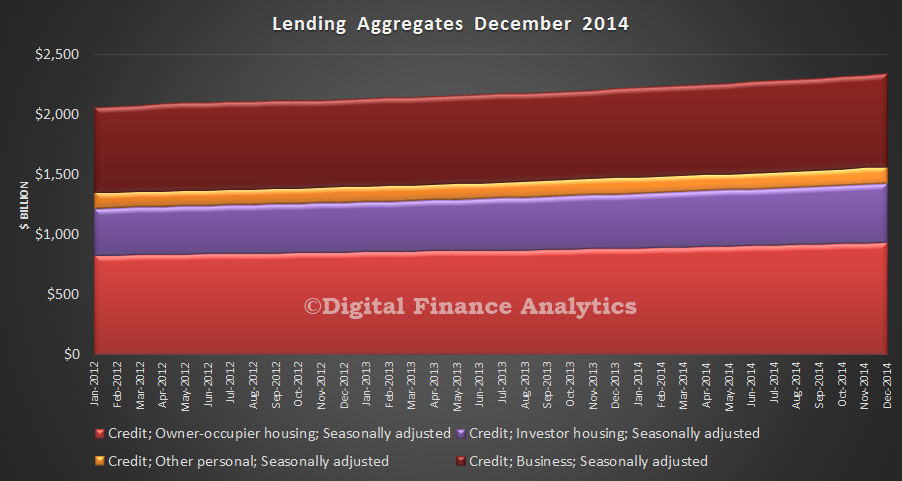
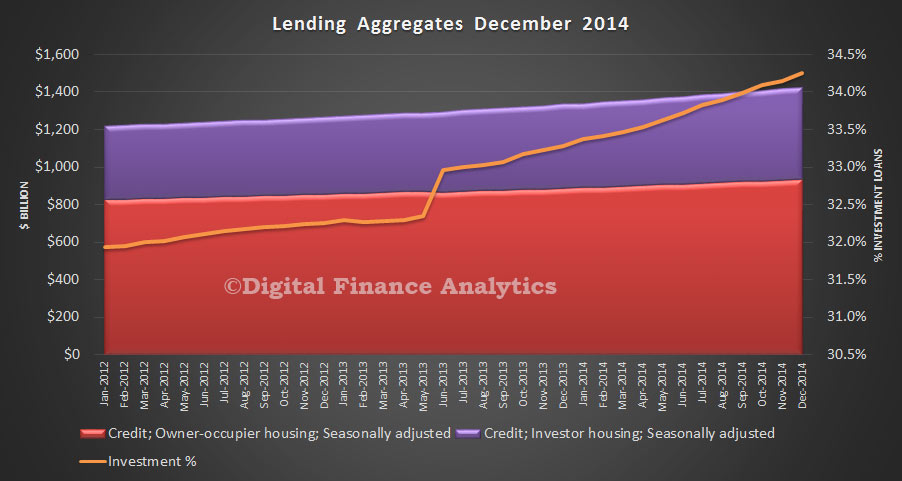
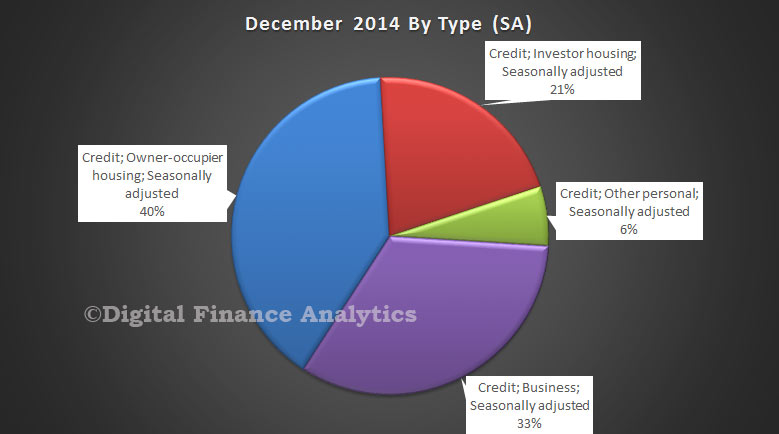
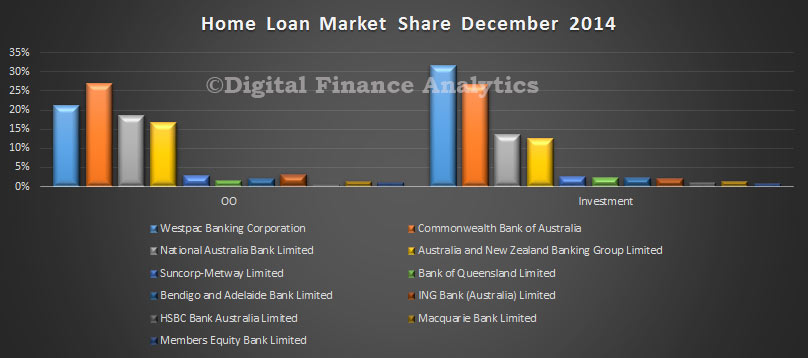
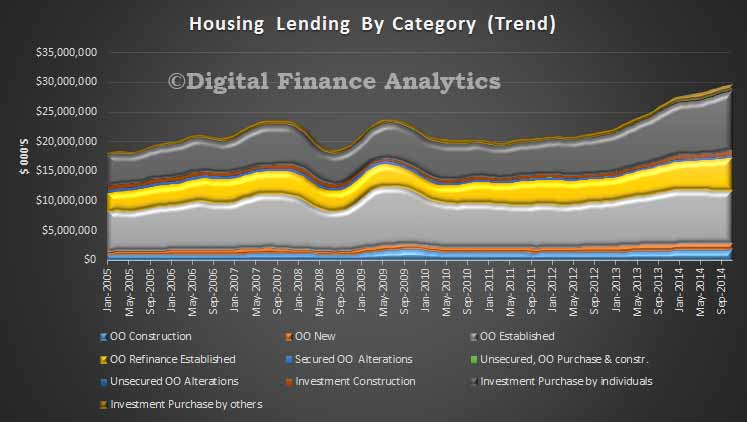
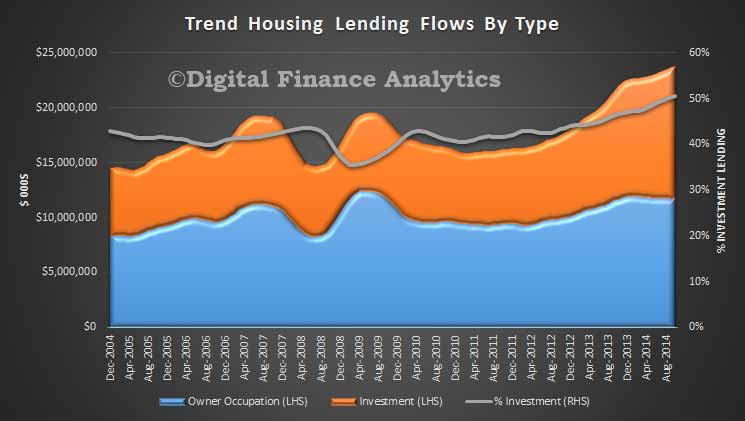
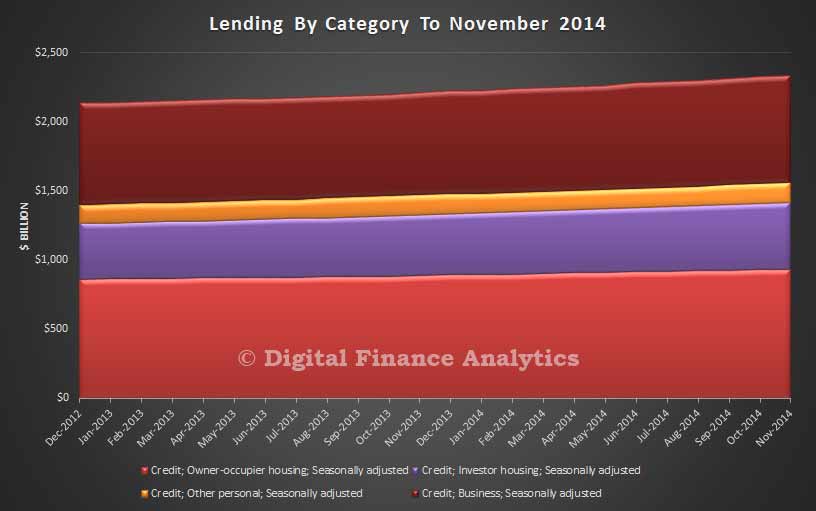
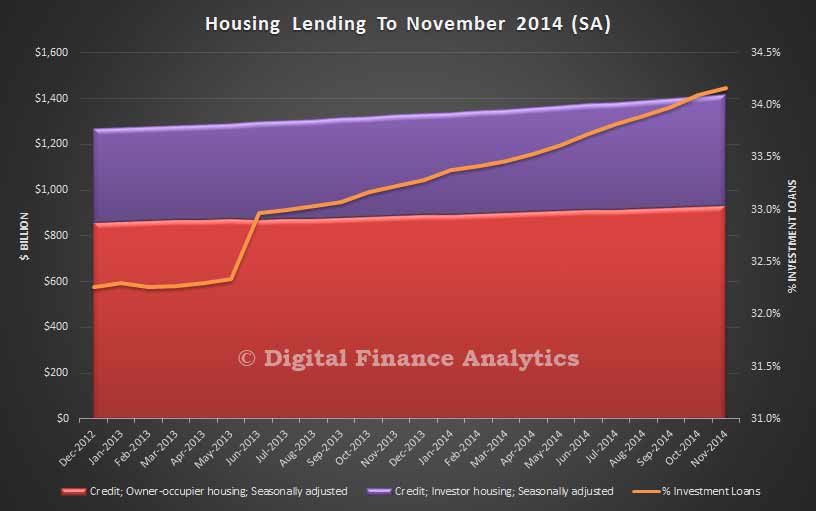
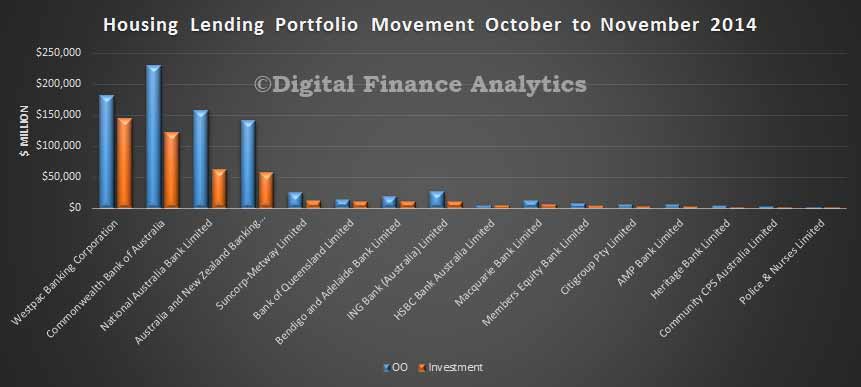
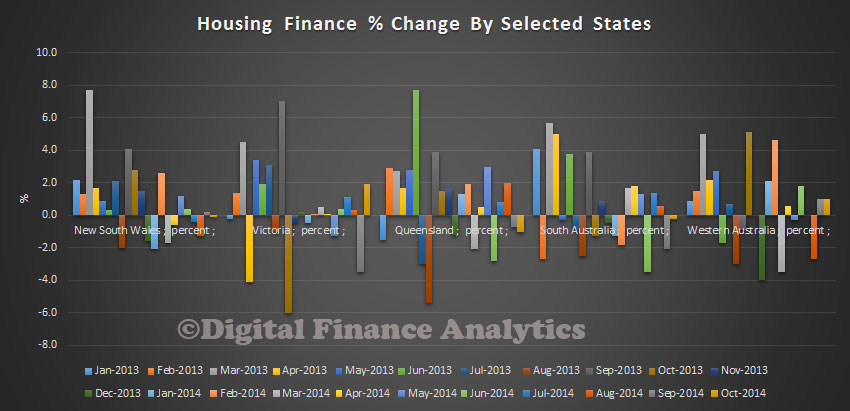
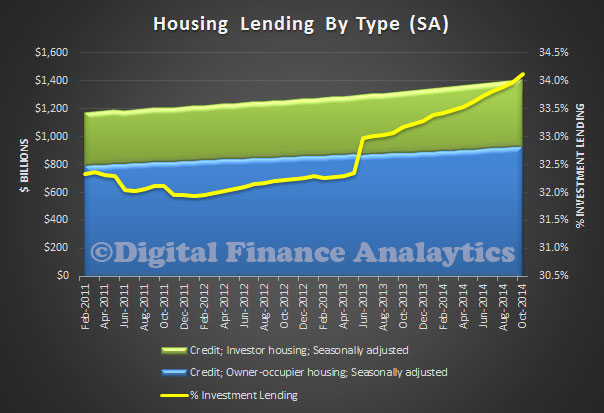
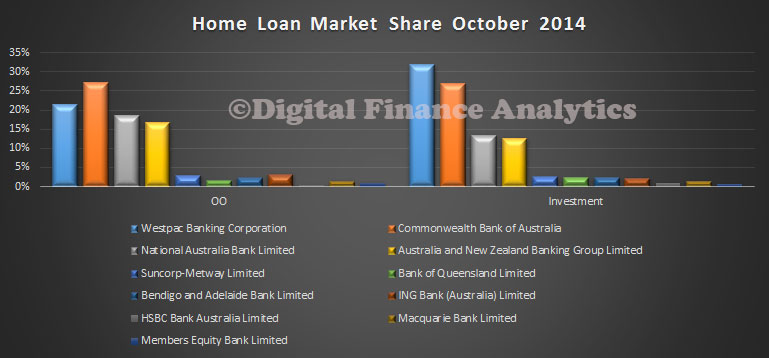
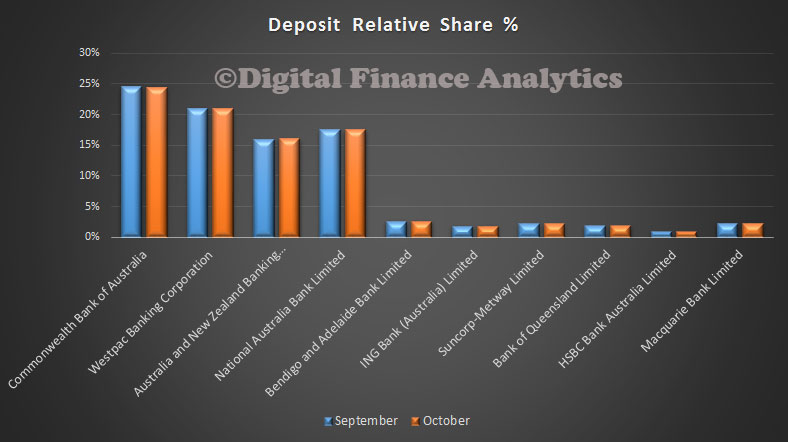
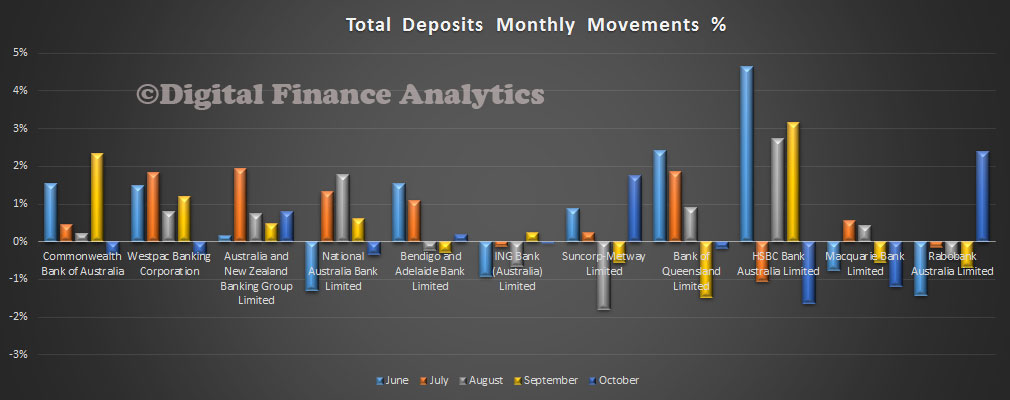
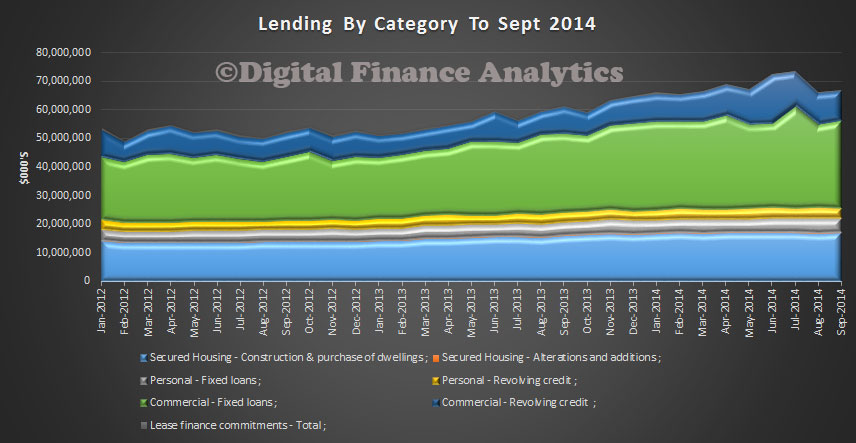
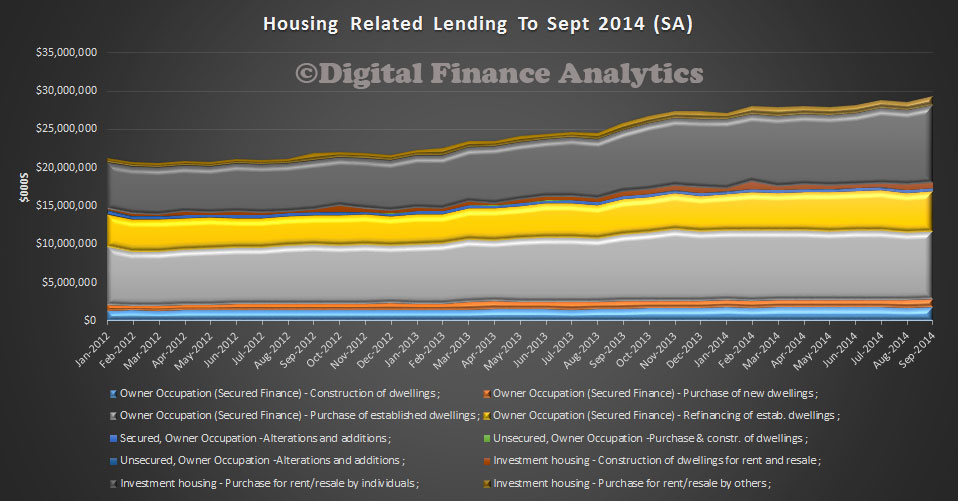
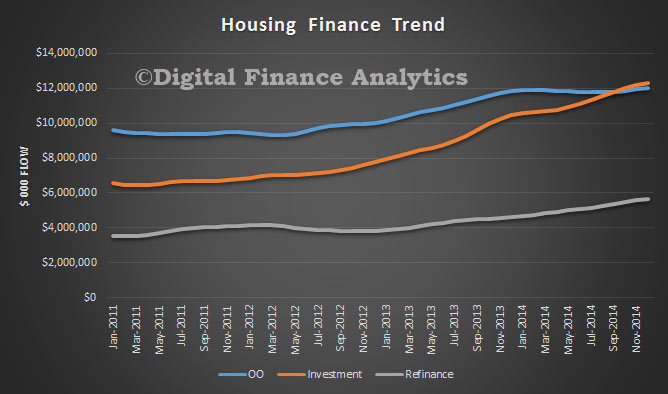
Data from the ABS today shows a further lift in home lending in December, driven hardest by the investment sector, but with owner occupation lending also in play. The trend estimate for the total value of dwelling finance commitments excluding alterations and additions rose 1.0%. Investment housing commitments rose 1.2% and owner occupied housing commitments rose 0.9%. Investment lending comprised more than 50.6% of new loans, excluding refinance, another record. Refinancing remains strong in the current low rate environment. In seasonally adjusted terms, the total value of dwelling finance commitments excluding alterations and additions rose 4.7%. However, DFA is now using the trend series in our modelling, as we think the SA series are suspect (according to the ABS, trend series reduces the impact of the irregular component of the seasonally adjusted series and is derived by applying a 13-term Henderson-weighted moving average to all but the last six months of the respective seasonally adjusted series, whilst the last six months are estimated by applying surrogates of the Henderson moving average to the seasonally adjusted series.)

HousingFinanceTrendDec2014In trend terms, the number of commitments for owner occupied housing finance rose 0.5% in December 2014. In trend terms, the number of commitments for the purchase of established dwellings rose 0.6%, while the number of commitments for the purchase of new dwellings fell 1.1% and the number of commitments for the construction of dwellings was flat.

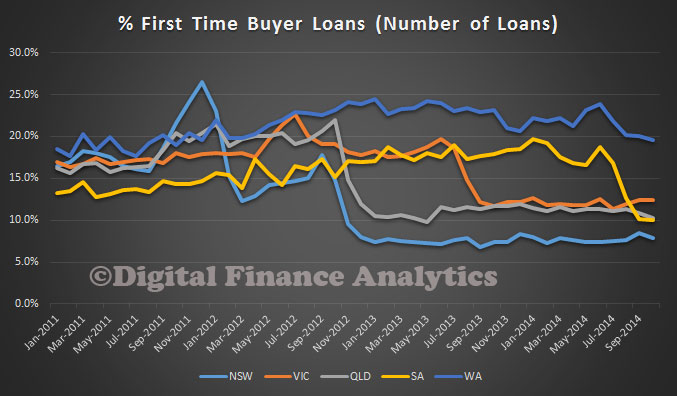
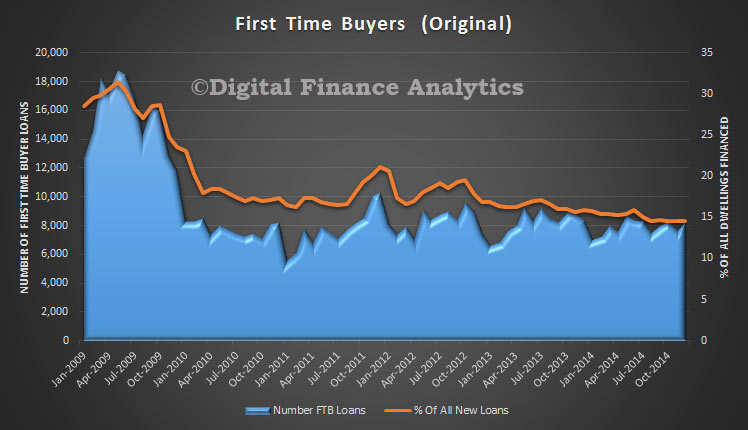
Turning to First Time Buyers, on the revised new method of calculation and in original terms, the number of first home buyer commitments as a percentage of total owner occupied housing finance commitments fell to 14.5% in December 2014 from 14.6% in November 2014. The fall in First Time Buyer activity remains a feature in the current climate.

FirstTimeBuyersDec2014-Dec
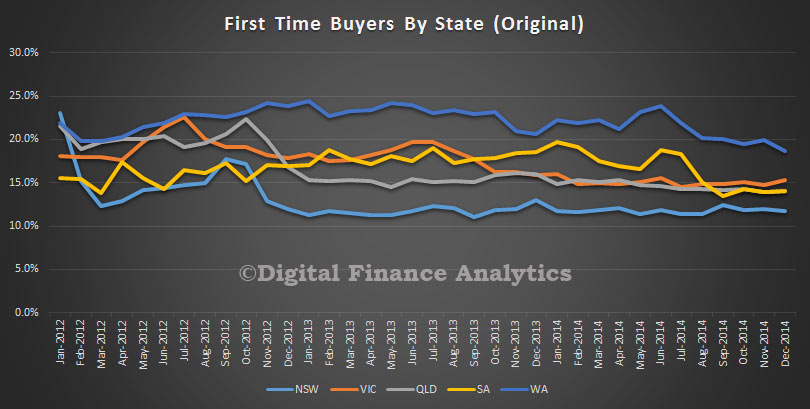
The state by state data reflects the revised First Time Buyer data, with NSW up by one third from 8% to 11% following the ABS revisions, compared with a national uplift of one quarter. We still see WA leading the way, though falling from the June 2014 peak. The other states are now more closely aligned. Given the size of the adjustment, we hypothise that at least one of the majors was not correctly recording first time buyer data.

FirstTimeBuyers-StatesDec2014

Home Lending Up To A Record $1.42 Trillion In December

The RBA released their credit aggregates for December 2014 today. Total credit grew by 5.9%, with housing recording 7.1%, Business 4.8% and Personal Credit 0.9% in annual terms. In the last month, housing lending grew 0.6% and business 0.5%.

Lending-Aggregates-Dec2014Looking at the breakdown, we see that housing lending grew apace, powered by further significant investment lending. Total housing lending reached a record $1.42 trillion, thanks to growth of $3.5 billion in owner occupied loans (up 0.38%) and investment lending of $4.2 billion (up 0.87%) in the month. Investment loans  now make up 34.3% of home lending, another record.

HousingLendingDec2014RBAOverall, only 33% of all lending is productive finance for business purposes. Household and consumer debt continues to rise strongly. Household debt is at a record. This is one good reason (or should that be 1.42 trillion reasons?) why the RBA should not be cutting the cash rate.

SplitsDec2014The difference between the RBA numbers, which covers all lending for property, and the APRA data, which covers banks only, is explained by the non-bank sector. There has been little growth here in recent times.

Another Bumper Month For Home Loans

APRA just released their monthly banking statistics, which provides a view of lending and deposit portfolios from the banks (ADI’s). Overall home lending by the banks rose $9.12 billion to $1.315 trillion. Owner Occupied loans grew by 0.59% and Investment Loans by 0.9%, with Owner Occupied Lending now accounting for 65.1% of the loan book (down from 65.2% last month). Looking in more detail at the individual bank data, we see that CBA maintains its leading position in the Owner Occupied sector, whilst WBC leads the Investment Property Lending.

HomeLendingSharesDec2014Looking at the trend data, we see stronger investment lending growth at WBC, and to a lesser extent at the other majors.

HomeLendingTrendsDec2014In portfolio percentage terms, Members Equity registered 3% growth, with Macquarrie at 2% and Suncorp and AMP at 1.8%, all above system growth.

HomeLendingMOMPCDec2014Turning to deposits, we saw growth of 1.37% in the month, to $1.8 trillion. CBA holds the largest share of deposits, with WBC and NAB following.

DepositsShareDec2014Looking at the monthly portfolio movements, we see CBA recorded portfolio growth of 1.6%, whilst WBC was 0.29%. Rabbobank grew their portfolio by 1.69%, whilst Macquarie and ING both grew their portfolios by 1.55%. We suspect some players are actively managing their deposits preferring to use wholesale funding alternatives, as we have discussed before.

DepositsMonthyMovementsDec2014Looking at credit cards, balances rose 1.9% to $41.8 billion. There was little overall change in portfolio mix amongst the main players, and Citigroup maintained in position at number 5.

CardsShareDec2014

Lending For Housing Investment Higher Still

The ABS published their finance statistics today to November 2014. It appears to me we have an unbalanced economy, where more and more lending is flowing into property, stoked by investment demand (and encouraged by negative nearing). As a results, house prices rise, inflating the bank’s balance sheets, and personal assets. But there is less lending for productive commercial purposes.

HouseLendingByCategoryNov2014

  • The total value of owner occupied housing commitments excluding alterations and additions rose 0.5% in trend terms, and the seasonally adjusted series fell 0.2%.
  • The trend series for the value of total personal finance commitments rose 0.2%. Fixed lending commitments rose 0.5%, while revolving credit commitments fell 0.2%. The seasonally adjusted series for the value of total personal finance commitments fell 2.2%. Revolving credit commitments fell 3.1% and fixed lending commitments fell 1.4%.
  • The trend series for the value of total commercial finance commitments fell 2.8%. Revolving credit commitments fell 7.7% and fixed lending commitments fell 1.2%. The seasonally adjusted series for the value of total commercial finance commitments fell 2.6%. Fixed lending commitments fell 4.6%, while revolving credit commitments rose 3.8%.
  • The trend series for the value of total lease finance commitments fell 2.3% in November 2014 and the seasonally adjusted series fell 4.4%, following a fall of 4.6% in October 2014.
Oct 2014
Nov 2014
Oct 2014 to Nov 2014
$m
$m
% change

TREND ESTIMATES
Housing finance for owner occupation(a)
17 169
17 248
0.5
Personal finance
8 729
8 746
0.2
Commercial finance
39 471
38 357
-2.8
Lease finance
428
418
-2.3
SEASONALLY ADJUSTED ESTIMATES
Housing finance for owner occupation(a)
17 309
17 282
-0.2
Personal finance
8 922
8 730
-2.2
Commercial finance
39 011
37 992
-2.6
Lease finance
421
402
-4.4

Looking at the data in more detail, we see that commercial lending represent 59% of lending.

AllFinanceNov2014PieHowever, within commercial lending, we have lending for investment property. Cross matching the data. we see that of all commercial lending, more than 30% directly relates to residential investment property. Lending for other purposes has dropped.

CommercialAndInvestmentNov2014Looking specifically at the housing sector, the growth in investment lending stands out.

HouseLendingByCategoryNov2014In fact in trend terms half of all lending was for investment purposes, a record.

HousingLendingTrendInvNov20142015 should be the year when Government recognizes that it is time to act. The current settings will continue to risk financial stability and economic growth.

Latest Banking Statistics

Last week saw the release of the November data from both the RBA and APRA. Looking at the overall summary data first, total credit grew by 5.9% in the year to November 2014. Housing lending grew at 7.1%, business lending at 4.6%, and personal credit by 1.1%.

LendingNoiv2014Looking at home lending, in seasonally adjusted terms, total loans on book rose to $1.42 trillion, with owner occupied loans at $932 billion, and investment loans at $483 billion, which equals 34.2%, a record.

HomeLendingNov2014From the APRA data, loans by ADI’s were $1.31 trillion, with 34.82% investment loans, which grew at 0.84% in the month. Looking at relative shares, CBA continues to hold the largest owner occupied portfolio, whilst WBC holds the largest investment portfolio.

HomeLendingSharesNov2014Looking at relative movement, WBC increased their investment portfolio the most in dollar terms. CBA lifted their owner occupied portfolio the most.

HomeLendingPortfolioMovementsNov2014Turning to deposits, they rose 0.39% in the month, to 1.78 trillion.

DepositSharesNov2014There was little change in relative market share, though we noted a small drop at nab, which relates to their cutting deposit rates from their previous market leading position.

DepositChangesPortfolioNov2014Finally, looking at the cards portfolios, the value of the market portfolio rose by $627 billion, to $41,052 billion. There were only minor portfolio movements between the main players.

CardsShareNov2014

Investment Loans 50.8% Of Mortgages

The ABS released their finance data to October 2014. The total value of owner occupied housing commitments excluding alterations and additions rose 0.2% in trend terms, and the seasonally adjusted series rose 1.0%.

LendingFinanceOct2014

The trend series for the value of total personal finance commitments rose 0.7%. Fixed lending commitments rose 1.1% and revolving credit commitments rose 0.1%. The seasonally adjusted series for the value of total personal finance commitments rose 6.5%. Revolving credit commitments rose 11.2% and fixed lending commitments rose 3.0%.

The trend series for the value of total commercial finance commitments fell 2.6%. Revolving credit commitments fell 7.9% and fixed lending commitments fell 0.6%. The seasonally adjusted series for the value of total commercial finance commitments fell 2.2%. Revolving credit commitments fell 11.5%, while fixed lending commitments rose 0.9%.

The trend series for the value of total lease finance commitments rose 0.8% in October 2014 and the seasonally adjusted series fell 4.7%, following a fall of 0.9% in September 2014.

The housing lending data shows another record was achieved last month with 50.8% of mortgages for investment purposes. Another record.

HousingFinanceOct2014This is starkly show by plotting the flows of owner occupied versus investment loans over the past few years.

OOVSINVOct2014

Is Housing Lending Growth Topped Out?

The latest ABS data, housing finance for October 2014, for ADI’s, shows that the trend estimate for the total value of dwelling finance commitments excluding alterations and additions rose 0.8%. Investment housing commitments rose 1.8% and owner occupied housing commitments rose 0.2%. In seasonally adjusted terms, the total value of dwelling finance commitments excluding alterations and additions rose 1.0%. In stock terms, the percentage of loans for investment purposes increased to 34.2% of all ADI housing loans.

HousingFinanceStockADIOct2014In percentage terms, banks still dominate compared with credit unions and building societies.

HousingFinanceADIPCTypeOct2014However, the number of dwelling committments for owner occupied housing finance fell 0.2% in October 2014.In trend terms, the number of commitments for the purchase of established dwellings fell 0.3% while the number of commitments for the construction of dwellings rose 0.8% and the number of commitments for the purchase of new dwellings rose 0.1%. In original terms, the number of first home buyer commitments as a percentage of total owner occupied housing finance commitments fell to 11.6% in October 2014 from 12.0% in September 2014. In state terms, the proportion of first time buyers fell in every main state, other than a small rise in VIC.

FTBByStateOcr2014Overall lending across the states fell slightly in NSW, QLD and SA, and rose in WA and VIC.

HousingFinancePCCHangeOct2014Are there signs the demand for housing finance is beginning to ease?  The latest DFA survey results suggest this could be the case.

Housing Lending Above $1.4 trillion

The RBA statistics released today reveals that housing lending has now reached a new milestone, overall reaching $1.4 trillion.In seasonally adjusted terms, owner occupied housing grew 0.44% and investment lending 0.99%. Investment lending accounted for more than 34% of all loans, a record (and is understated because owner occupied lending includes refinancing). Overall it is likely more new investment loans than owner occupied loans were written in the month. We will need to wait for the detailed figures to confirm this.

HousingLendingOct-2014Looking at the monthly growth data, we see the continued relative momentum in investment lending, and this underscores the concerns of the OECD and other observers.

HousingLendingMonthlyGrowthOct-2014In 12 month terms, housing lending grew 7%, Personal Credit by 1.0% and business credit grew 4.3%.

LendingAnnualGrowthOct-2014Here is the RBA summary:

RBAOCT2014Aggregates

Investment Lending Burns Bright

APRA released their monthly banking statistics for October 2014 today. The total value of housing lending rose to $1.298 trillion, from $1.288 in September, up 0.81%. Of this however, Investment lending rose 1.03% by $4.59 billion and Owner Occupied Lending rose 0.69% by $5.79 billion. This data relates the the banks (ADI’s) excluding the non-bank sector. This is normally about $110 billion.

Looking in detail at the bank by banks analysis, we see a familiar set of trends.

HomeLendingOctober2014ByADIWestpac leads the pack on investment mortgage lending, with a 31.8% share, whilst CBA leads with owner occupied lending with 27.1% share.

HomeLendingSharesOctober2014ByADILooking at the movements, only ING Bank recorded a fall in value in their portfolio. Macquarie grew the strongest. This relates to the $1.5 billion portfolio of non-branded mortgages they purchased from ING in September.

HomeLendingMovementsOctober2014ByADILooking in percentage terms, we see that Macquarie and AMP grew well above system, and ING below in October.

HomeLendingPCMovementsOctober2014ByADITurning to deposits, they fell by 0.06% in the month, to a value of $1.76 trillion. There was little movement between players, though given the growth in loans above, it is clear that wholesale funding is being accessed now, and this explains the continued fall in deposit interest rates.

DepositTotalsOctoberCBA maintains its position as the largest deposit holder, with 24.5% of the market.

DepositSharesOct2014

Looking at movements, we see Rabobank growing their deposits in percentage terms the strongest in the month, a reversal from previous recent months. Other than ANZ, the majors all lost a little share. Suncorp grew its book also.

DepositMovementsOctoberIn cards, balances rose by about $50 million, to $40.4 billion.

CardBalancesOct2014CBA continues to hold the largest cards share with 27.8% of the market.

CardSharesOct2014

Property Finance Continues To Lift In September

The ABS released their lending finance data today for September 2014. When compared with August,

Housing Finance For Owner Occupation

  • The total value of owner occupied housing commitments excluding alterations and additions rose 0.1% in trend terms and the seasonally adjusted series rose 1.4%.

Personal Finance

  • The trend series for the value of total personal finance commitments rose 0.4%. Fixed lending commitments rose 0.9%, while revolving credit commitments fell 0.3%.
  • The seasonally adjusted series for the value of total personal finance commitments fell 5.5%. Revolving credit commitments fell 7.7% and fixed lending commitments fell 3.7%.

Commercial Finance

  • The trend series for the value of total commercial finance commitments fell 1.6%. Revolving credit commitments fell 4.3% and fixed lending commitments fell 0.5%.
  • The seasonally adjusted series for the value of total commercial finance commitments rose 2.4%. Fixed lending commitments rose 4.9%, while revolving credit commitments fell 4.1%.

Lease Finance

  • The trend series for the value of total lease finance commitments rose 1.2% in September 2014 and the seasonally adjusted series fell 1.0%, after a rise of 9.3% in August 2014.

Total-Lending-Sept-2014Housing finance made a significant contribution, mainly thanks to significant investment sector demand. Overall it rose 2.3% from last month. Refer our earlier discussion on investment lending for more details.

Total-PropertyLending-Sept-2014Were it not for the hot house prices, and unconstrained investment sector demand, the next movement in official interest rates would most likely be down thanks for contained business lending. The real question is how to redirect lending support away from unproductive investment in established dwellings, to new construction, and the commercial sector. Changes to negative gearing and capital buffers across lending categories should be on the table. However, economic sense is being blunted by the fear of political backlash. Nevertheless, we think think the time has come for a dose of reality as the blunt interest rate lever will just not cut the mustard.