Consistent with the DFA surveys on household financial confidence the latest survey via ME Bank says:
Australian households are feeling overall worse about their net
wealth, jobs, income and living expenses with further significant
residential property price falls over the past six months and a
weakening labour market, ME’s latest Household Financial Comfort Report has revealed.
Consulting Economist for ME, Jeff Oughton, said that despite
remaining a little above the report’s seven-year average, financial
comfort across most of the 11 drivers that make up the Index fell, with
net wealth in particular seeing the largest drop, falling 3% to 5.54 out
of 10 during the six months to June 2019.
“The financial comfort of Australian households eased over the past
six months, with a significant fall seen in comfort with wealth. Despite
lower mortgage loan rates, expected cuts in personal income tax and
higher local and global equity prices, this is largely a consequence of
continued decreases in the value of residential property in many parts
of Australia,” said Oughton.
“Comfort with wealth would have fallen much more if it wasn’t for
record bond prices and rebounding share markets as well as the
Government’s retention of negative gearing on investment properties and
cash refunds for franking credits that saw household comfort with
investments increase.”
Financial comfort with investments (in financial assets, such as
shares and super, and property) was the only driver across the index to
improve (up only 1%), but was largely accrued by households with high
incomes. Households with incomes of $200k+ per annum and large
superannuation balances (above $1 million) reported increases to overall
financial comfort by 10% to 7.45 and 11% to 8.3, respectively, during
the six months to June 2019.
A weakening labour market and subdued income growth weigh on comfort
Financial comfort among households also eased as a consequence of a
weakening job market, which resulted in subdued wage growth, falling
comfort with income and high levels of both underemployment and job
insecurity.
In particular, financial comfort among working Australians
significantly deteriorated, with full-time workers recording a 3%
decrease to 5.86, part-time workers decreasing 4% to 5.1, casual workers
decreasing 1% to 5.02 and self-employed workers down 3% to 5.57.
Oughton said: “It’s clear from the latest Report that there are
increased concerns around job availability and underemployment. The
number of workers who felt it would be difficult to find a new job
increased by 16 percent to over 1 in 2 employees, which is the highest
recorded since late 2016.”
In June 2019, 35% of part-time and casual workers said they would
prefer to work more hours – seeking an additional 23 hours per week.
Meanwhile, 26% of all workers said they felt insecure in their current
job.
Households’ comfort with their incomes also fell by 1% to 5.69 in the
latest survey. Only 36% of Australian households reported an increase
in their annual income during 2018/19, falling 2 points from December
2018, and there were fewer income gains recorded across households in
general. Higher income households also continued to be much more likely
to report increased incomes during the past year.
Living costs and a lack of savings are household’s biggest financial ‘worries’
In net terms of the greatest financial ‘worries’ and ‘positives’,
cost of necessities was the most commonly cited worry in ME’s latest
report, nominated by 44% of households. This was followed by worries
about level of cash savings on hand (34%), ability to maintain lifestyle
in retirement (31%) and impact of legislative change (19%).
Looking more closely at savings, Oughton said that overall, comfort
with cash savings remained steady at 5.09 during the six months to June.
“Since the latest Federal Budget was announced, households, on
average, have slightly increased their precautionary savings. However,
this saving behaviour was predominantly among those with a smaller
amount of cash savings, and in contrast, those 10% of households
reportedly spending more than their monthly income are overspending by
more each month (up 18% in dollar terms).”
Oughton also noted that about 40% of households continued to spend all their monthly income.
When asked about retirement, the anticipated standard of living in
retirement has eased, falling 1% to 5.2, and notwithstanding a rise in
the comfort of households expecting to self-fund their retirements (up
to 7% to 7.31).
Furthermore, of all 11 components that make up the financial comfort
index, Australians still felt the least comfortable with their ability
to cope with a financial emergency, which fell slightly by 1% to only
4.77 out of 10. Indeed, 20% of households said they didn’t think they
could raise $3,000 in an emergency.
Residential property price correction a drag, but most households increasingly optimistic for 2019/20
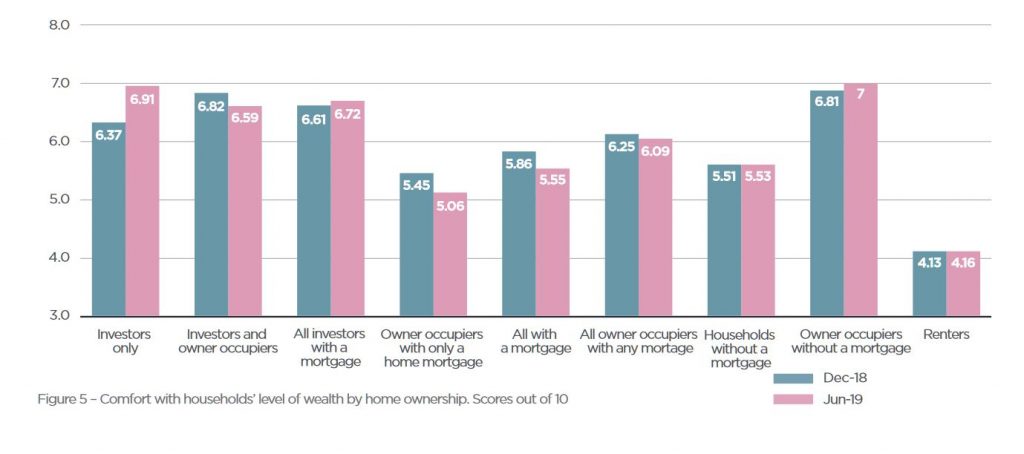
While the residential property price correction has negatively
impacted wealth, comfort by housing tenure has been mixed over the past
six months. The Report reveals that comfort has lessened among both
homeowners with a mortgage and renters, which could be attributed to
tightening in the availability of credit, continued housing
unaffordability, and high housing debt and rental payment stress. In
contrast, comfort has risen amongst those who own their home outright
and geared property investors post-Federal election, with negative
gearing retained on investment properties.
Oughton said: “It’s evident that despite the latest monetary policy
changes, there remains high levels of housing debt worry and actual
payment stress among Australians.”
“The number of households contributing more than 30% of their
disposable income towards paying off a mortgage has remained steady at
about 43%, while the corresponding figure for renters has risen to 62% –
partly reversing the improvement reported in the previous two surveys.”
In contrast to the actual fall in dwelling prices during the past 12
months, the majority of households living in their homes and investment
property investors are feeling even more positive than six months ago
about the 12-month outlook for dwelling prices.
In fact, over 41% of households living in their homes expect their
dwelling prices to rise during 2019/20, while only 11% expect the value
of their home to fall (including only 3% who are expecting a large
fall).
However, the expectations of higher home values amongst
owner-occupiers varies significantly across major capital cities, with a
significant rise in Brisbane (46%), Sydney (45%) and Melbourne (42%) –
in comparison to Perth (25%).
Investors are relatively more optimistic than owner-occupiers, albeit
less so than six months ago: 46% of investors expect the value of their
investment properties to rise during the next 12 months, while only 9%
anticipate a fall (including 2% who anticipate a large fall). Investors
in Sydney are the most optimistic about property values (with 54% of
investors expecting rises and only 6% expecting a fall), followed by
investors in Brisbane (50%) and in Melbourne (44%).
Oughton summarised the key winners and losers from ME’s 16th Household Financial Comfort Report:
Winners:
Households not reliant on the government aged pension in their retirement
Households with super balances (greater than $1 million) – financial comfort up 11% to 8.3
Young and middle-aged singles/couples with no children
Geared investors in residential property markets – financial comfort up 8% to 6.9
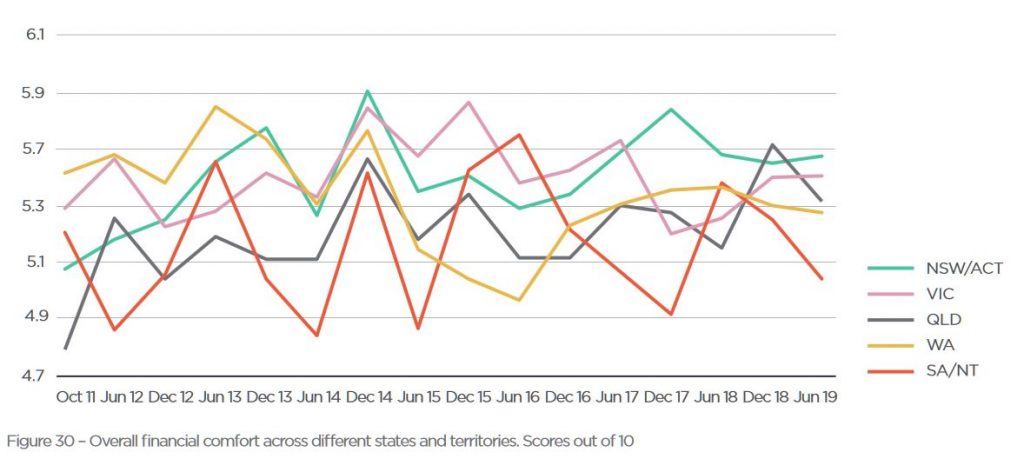
NSW/ACT and VIC – the highest levels of financial comfort was found in NSW/ACT (5.64), followed by Victoria (5.55)
Losers:
QLD, TAS and SA/NT – overall comfort fell in these states
Brisbane, Perth and Adelaide residents – comfort in these cities
dropped to match the low levels of comfort reported in regional
Australia
Working Australians – comfort significantly deteriorated among
workers, with full-time workers recording a 3% decrease to 5.86,
part-time workers decreasing 4% to 5.1, casual workers decreasing 1% to
5.02 and self-employed workers down 3% to 5.57
WA workers – this state reported as being the most difficult job
market, with over 60% expecting it would be difficult to get a new job
in WA
Renters – rental payment stress was reported by 62% of renters, up 11 points during the six months to June 2019.
The biannual survey released Monday asked 1500 people to rate their household comfort for the first half of 2018, showing short-term cash savings to be the biggest area of decline.
A bright spot in the otherwise gloomy findings came for renters, who reported a lessening in financial stress, thanks largely to a cooling housing market and falling rents.
The report’s Household Financial Comfort Index, which surveys how ordinary Australian perceive their own financial wellbeing, saw a 3 per cent drop on the February results to 4.93 out of 10 for the first half of 2018 – “its lowest level in a couple of years”.
Living expenses were the biggest reason for using short-term savings, the survey found.
In the past year, 17 per cent of households could not always pay their utilities bills on time, 19 per cent sought financial help from family or friends and 15 per cent pawned or sold something to buy necessities, the findings showed.
“Australians generally can dip into their savings to get by,” consulting economist for ME Jeff Oughton said.
“However some households may get to a point where there’s no more savings to draw from,” Mr Oughton said.
“Currently, around a quarter of Australian households have less than $1000 in cash savings,” he added.
The report said the worst-affected demographic was young singles and couples under 30 with no kids.
This group reported falls across all areas of comfort, including in their ability to handle a financial emergency.
Meanwhile, ‘baby boomers’ continued to report the highest financial comfort of all generations.
The report revealed housing stress was still broadly unchanged for households with mortgages.
Some 45 per cent of mortgage holders reported to they contributed more than 30 per cent of their disposable income toward their home loans the past six months.
“The good news for renters is that financial stress has lessened somewhat during the past six months, thanks to the housing market cooling and rents falling,” Mr Oughton said.
“While almost three-quarters (72 per cent) of renters were previously contributing over 30 per cent of their disposable income towards rent, this number dropped significantly to two-thirds (67 per cent in the most recent survey,” he added.
Despite improved job conditions and households reporting healthier financial buffers, the overall financial comfort of Australians is not advancing, according to ME’s latest Household Financial Comfort Report.
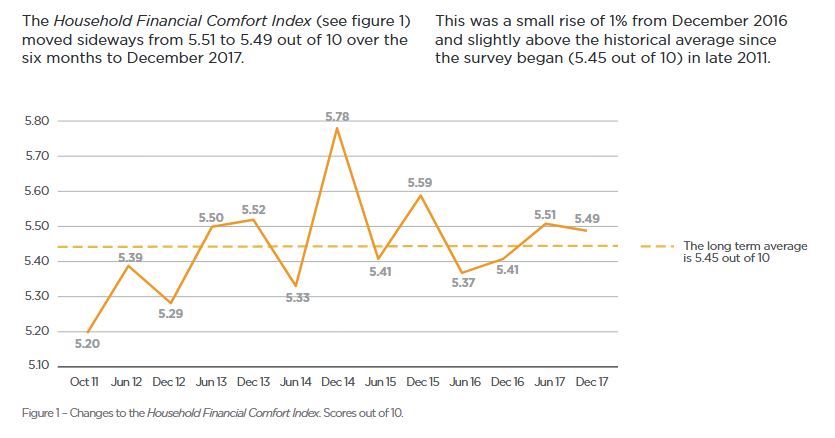
In its latest survey, ME’s Household Financial Comfort Index remained stuck at 5.49 out of 10, with improvements in some measures of financial comfort linked to better employment conditions – e.g. a greater ability to maintain a lifestyle if income was lost for three months – offset by a fall in comfort with living expenses.
“Households’ comfort with paying their monthly living expenses fell 3% to 6.40 out of 10 during the six months to December 2017, the lowest it’s been since mid-2014,” said Jeff Oughton, ME consulting economist and co-author of the report.
“In fact, ME’s latest report shows many households’ financial situation is getting worse and again the culprit is living expenses, with 40% reporting this as a key reason their situation is worsening.
“Around 46% of households surveyed also cited the cost of necessities such as fuel, utilities and groceries as one of their biggest worries.
“It’s unsurprising households are still feeling the pinch, given subdued income growth and the rising costs of energy, childcare, education and health.
“If it wasn’t for a decline in comfort with monthly living expenses, the report’s overall Household Financial Comfort Index would’ve likely increased,” said Oughton.
“The rising cost of necessities is currently holding Australians back when it comes to their finances.”
Oughton said that over the past year, 16% of households were not always able to pay their utility bills on time, while 19% sought financial help from family or friends and 13% pawned or sold something to buy necessities – a clear illustration of bill stress, particularly for those on lower incomes.
In other findings from the ABS, childcare costs have doubled in the past six years, while the cost of primary and secondary education has increased by 50%.
But Oughton said one household group of Australians is bucking the trend.
“Households under 35 years old without children – commonly dubbed the ‘avocado generation’ − many of whom have benefited from improved employment conditions without the burden of childcare costs or potentially a mortgage, are not as worried. Their financial comfort rose by 8%, and their comfort with living expenses increased 2% during 2017.”
Oughton said the report’s most encouraging result was households’ improved ability to maintain a lifestyle, if income was lost for three months, which rose 3% to 4.82 out of 10 in the past six months to December 2017 – its highest outcome since 2015. This finding reflects stronger labour market conditions, although mainly among full-time workers.
Victorians’ comfort plummets, while NSW’s rises
Household financial comfort in Victoria dropped significantly below New South Wales’ financial comfort for the first time since the survey began in 2011.
New South Wales improved by 3% in the past six months to 5.83 out of 10 in December 2017, the highest in three years, while Victoria fell 7% to 5.30 out of 10, its lowest level in the past six years.
“New South Wales’ superior financial comfort can be linked to greater confidence in handling a financial emergency (loss of income for three months) – a reflection of healthier employment conditions in the state,” said Oughton.
“Meanwhile, Victoria’s decline can be attributed to falls across most key drivers of financial comfort, including lower confidence in handling a financial emergency (loss of income for three months) and less comfort with investments.
“The discrepancy between the two states is significant given both have traditionally felt similar levels of comfort in the past,” added Oughton.
High levels of mortgage payment stress – set to worsen
More than half of households (56%) renting or paying off a mortgage reported they are contributing over 30% of their disposable household income towards this cost – a common indicator of financial stress – with 72% of renters spending 30% or more of their disposable income on rent and 46% of those paying off a mortgage putting 30% or more of their disposable income towards this.
Furthermore, the proportion of households who ‘worried about their household’s level of debt over the last month’ increased by 1 point to 38%. This proportion increased to 51% among mortgage holders, compared to 27% with no mortgage and 23% who own their own home outright.
“Seven per cent of households reported they could not always pay their mortgage on time during the past year, and 7% could not pay their rent on time.”
“Mortgage defaults may escalate if interest rates increase, particularly among vulnerable low-income households already dealing with the rising cost of necessities,” said Oughton.
The gap between Australia’s rich and poor continues to widen
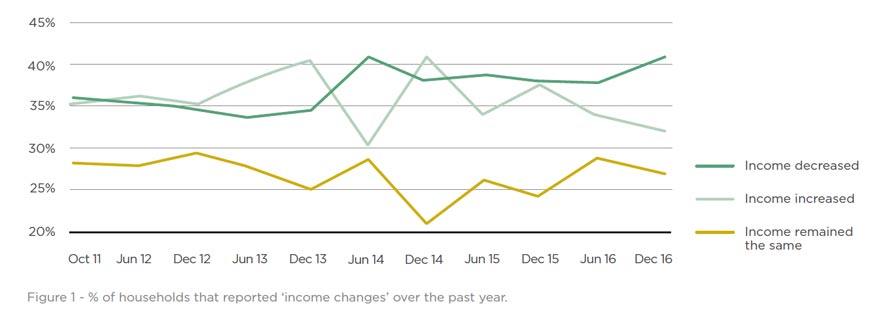
A disparity in financial comfort between some household groups remain, with 30% of households reporting their financial situation worsened in the past year, while 35% reported it remained the same and 35% reported it improved.
“Around 61% of households with ‘low levels of comfort’ reported a significant worsening in their overall financial situation during 2017, while almost 70% of households on ‘high levels of comfort’ reported that their financial comfort improved during 2017. In other words, the rich are getting richer and the poor are getting poorer,” said Oughton.
Hardest hit were households with incomes below $40,000, 45% of which said their financial situation had worsened, as well as single parents and baby boomers, 36% of which reported their situation had worsened.
For the third consecutive report, disparity was also evident in household income improvements, with more than 50% of those earning over $100,000 reporting income gains while only 29% of those earning between $40,001 and $75,000 reporting income gains.
“Despite continued improvement in the labour market and general economic conditions, the benefits are not trickling down to many households. For these households it will only get worse as the cost of necessities keeps going up,” added Oughton.
Other findings
SA still feeling the pinch: Household financial comfort in South Australia fell by 4% to 5.00 out of 10 during the past six months, to remain the lowest of the mainland states.
WA and QLD continue to trend higher: Comfort in both Western Australia and Queensland remained broadly unchanged at 5.49 and 5.39 out of 10 respectively. Both resource-dominated regions are recovering from the mining downturn to be more in line with the level of household financial comfort reported across Australia as a whole.
The Household Financial Comfort Report is based on a survey of 1,500 Australians conducted by DBM Consultants in December 2017. The Report is produced every six months, with the first survey conducted in October 2011.
Income cuts, record-high job insecurity and high rates of underemployment are putting stress on households’ financial comfort, according to ME’s latest Household Financial Comfort Report.
The Report shows a marked long-term deterioration in Australian households’ ‘comfort with income’, which remains at its lowest level since the Report began in 2011, at 5.55 out of 10.
Record low income gains highlight widening gap between rich and poor
ME consulting economist and Report co-author, Jeff Oughton, said the reasons for income worries were clear.
“Only 32% of households reported ‘income gains’ over the past year – one of the lowest levels since the first survey in 2011 and down from the corresponding figure of 38% 12 months ago,” said Oughton.
Oughton said income gains were more likely to be reported by those with higher incomes and wealthier Australians.
Almost one in two (or 46%) of households with incomes over $100,000 reported ‘income gains’, compared to 17% of households earning under $40,000. Conversely, 41% of households earning less than $40,000 reported income losses, compared to only 13% of those earning over $100,000.
“The rich appear to be getting richer, while the rest of Australia is struggling – there’s a divide across households,” said Oughton.
Households earning an annual income above $200,000 reported very high overall financial comfort of 7.10 out of 10 in December, compared with ME’s overall household financial comfort index (5.41 out of 10).
“We’re seeing a shift in the composition of jobs as the economy moves away from mining and manufacturing with many employees leaving longer-term jobs and taking up lower-paying less-permanent jobs, which is having a negative impact on their financial comfort,” said Oughton.
“ABS data shows wage growth at historical lows over the past two years to the September quarter. ME’s Report supports this, highlighting low wage growth continued in the whole of 2016 and is causing financial discomfort for many households, exacerbated by job insecurity and underemployment.”
Job insecurity and underemployment
In addition to income cuts, high levels of underemployment and record high ‘job insecurity’ were also contributing to households’ historically low comfort with income.
“One in three Australian households (34%) reported ‘job insecurity’ – a record high and an increase of 9 points over the year to December 2016,” said Oughton.
“Furthermore, 56% of households felt that they would ‘struggle to find a new job within two months if they became unemployed’, an increase of 3 points over the past year, while only 37% said it would be ‘easy to find a job’, down 3 points in the past 12 months.”
“Despite Australia’s relatively low official unemployment rate of 5.8% in December 2016, ME’s Report shows 60% of part-time employees would like to ‘increase the hours they work’ and 70% of casual workers want to ‘change from casual to permanent employment’,” said Oughton.
Tighter purse strings
The proportion of households saving increased 3 points to 51%, with these households saving an extra $58 each month on average.
“Arguably reflecting tougher labour market conditions outweighing the impact of rising (net) wealth, households tightened their purse strings over the six months to December, saving more where they could and overspending less.
“It’s an increased conservatism that will be contributing to a drag on growth as Australia’s economic transition continues,” said Oughton.
Meanwhile, those households ‘spending more than they earn each month’ (9% of households) also cut back, reducing their overspending by an average of $55 less each month. Consistent with these findings, overall household comfort with cash savings rose by 3% to 4.94 out of 10 in the latest Report.
Other findings:
‘Single parents’ doing it the toughest: ‘Single parents’ reported the lowest levels of financial comfort the Report has seen (4.34 out of 10) – a 3% decrease in the six months to December 2016.
‘Gen X’ down in the dumps: ‘Gen X’s’ financial comfort decreased by 5% to the lowest level on record (4.92 out of 10), reflecting lower comfort across all key drivers with the biggest falls in comfort around debt (down 8% to 5.21) and incomes (down 6% to 5.19).
‘Retirees’’ financial comfort on the up: ‘Retirees’’ household financial comfort rose by 8% to 6.23 out of 10. Likely due to current majority of retirees not being faced with pending superannuation and pension changes, and having ridden the continued wave of growth in the property market and renewed strength in equity markets. Retirees’ ‘comfort with both their investments and wealth’ rose by 11% in the last six months, and their ‘ability to cope with a financial emergency’ is the highest of all household cohorts.
WA rebounds, at least temporarily: Financial comfort in WA increased by 6% to 5.34 out of 10, reversing the record low results seen in the previous Report (5.02 out of 10). Many key drivers of financial comfort rose, with double-digit gains in ‘investments’ and ‘cash savings’.
South Australians feeling the pinch: South Australians experienced an 8% decrease in financial comfort during the six months to December 2016. Many key drivers of financial comfort fell, with recent adverse weather and energy disruptions potentially weighing, at least temporarily, negatively on household comfort.
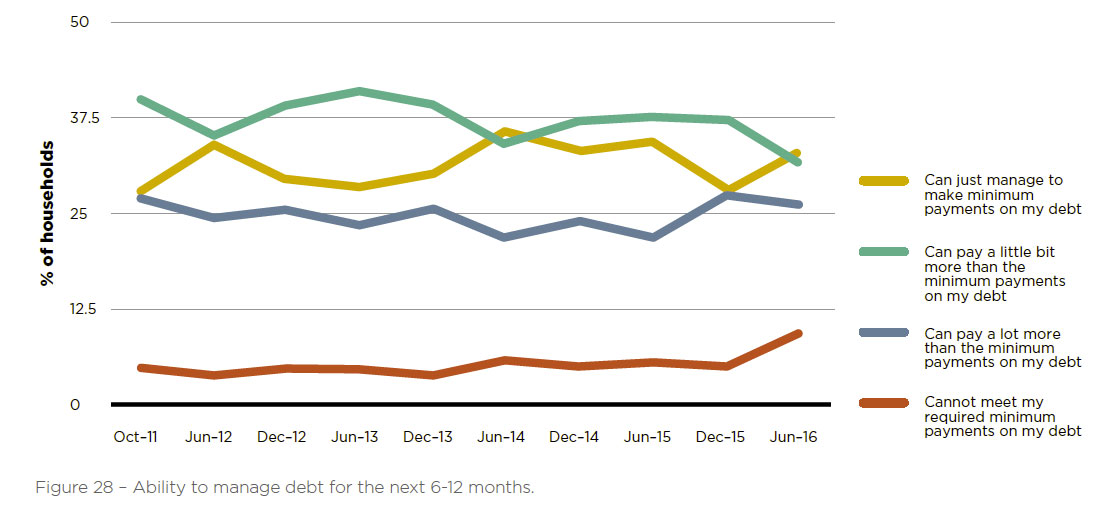
ME’s tenth biannual Household Financial Comfort Report shows
marked deterioration in Australian households’ confidence in their
‘ability to manage debt over the next six to 12 months’, doubling from
about 5% over the past few years to 10% as at June 2016.
‘Single parents’ reported the highest levels of concern in their ‘ability to meet minimum debt repayments over the next six to 12 months’ (19%), followed by ‘couples with young children’ (15%) and ‘young singles/couples’ (12%). Consistent with an expected rise in debt stress, more households ‘paying off or owning a home’ reported to be drawing on their home equity to ‘pay off debt’ (up 4 points to 11%) and ‘to make ends meet’ (also up 4 points to 10%) during the first half of 2016.
There is a marked increase in households feeling vulnerable to income shocks associated with wage cuts, fewer hours worked and a lack of suitable jobs as well as lower dwelling prices in some parts of Australia, all of which increases debt stress. With a lack of cash savings or equity buffer in their home, there’s a notable increase in households expecting to be unable to service their debts, despite record low borrowing costs.
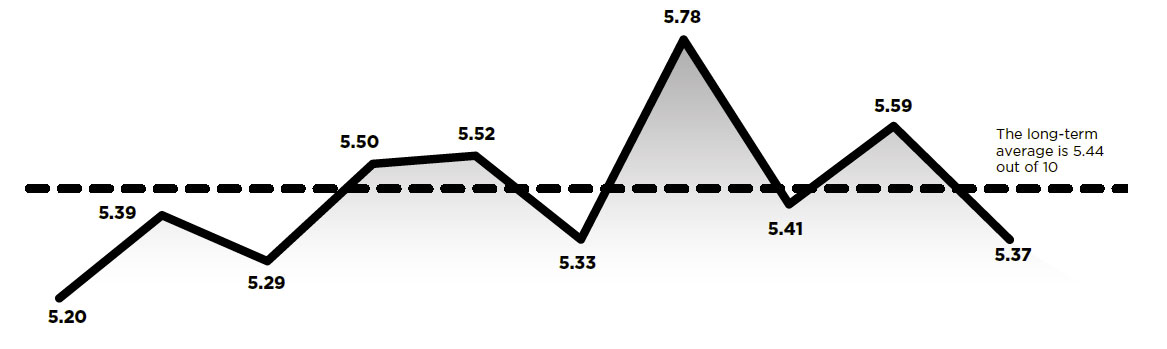
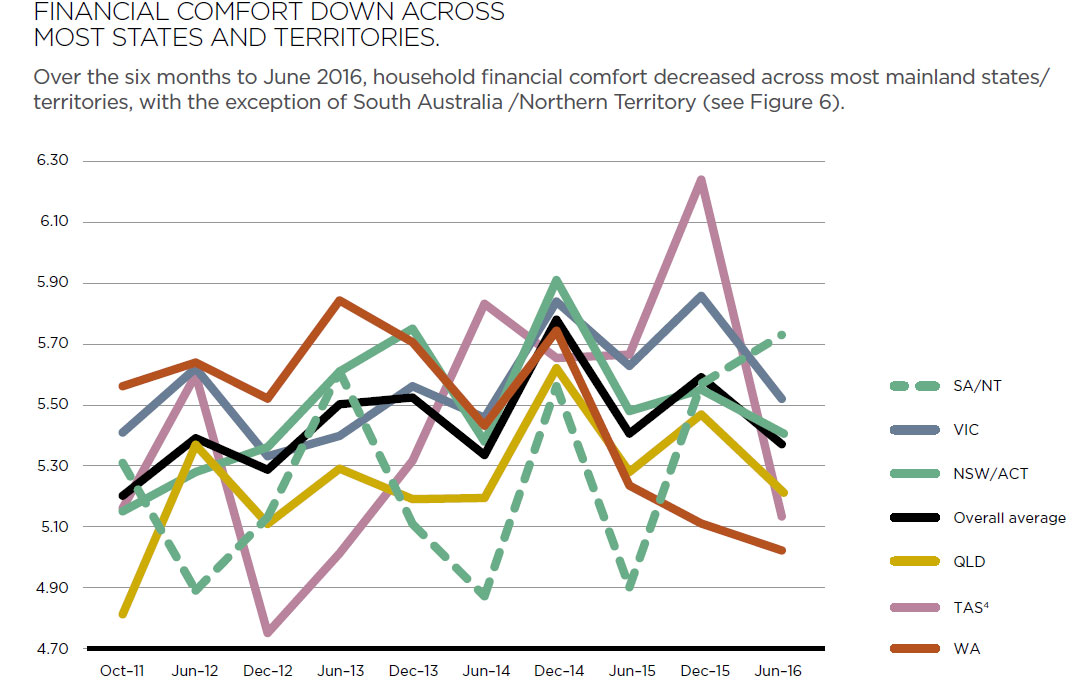
As for the overall finding, ME’s overall Household Financial Comfort Index – a measure of households’ perceptions of their financial comfort − dropped significantly by 4% to 5.37 out of 10 in the six months to June 2016.
This result means about 90% of Australian households reported low-to-mid financial comfort, with only 10% reporting high comfort. The result reverses the increase in comfort reported in December 2015, and is the fourth lowest financial comfort level since ME commenced the survey in late 2011.
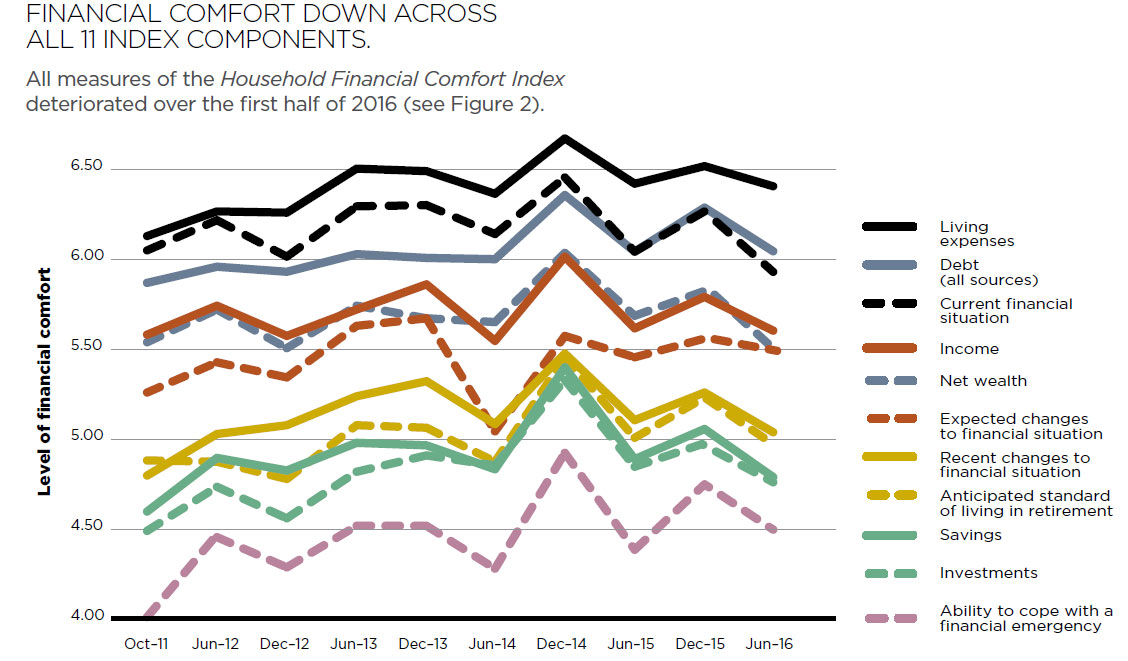
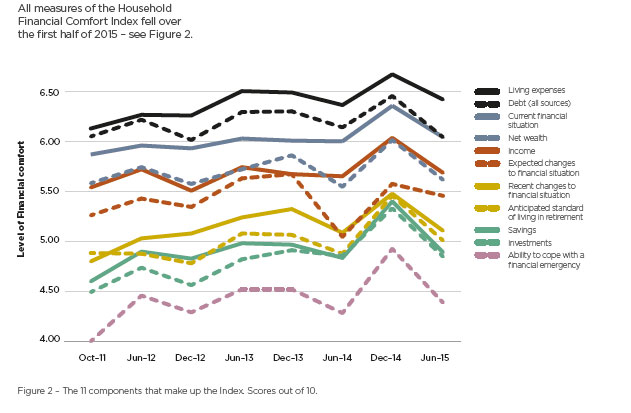
All 11 index components deteriorated, with the largest falls seen in ‘net wealth’, ‘income’, ‘cash savings’ and ‘investments’ as well as households’ ‘ability to handle short-term income loss’ and ‘anticipated standard of living in retirement’. The Report identified a number of factors contributing to the significant deterioration in perceived financial comfort.
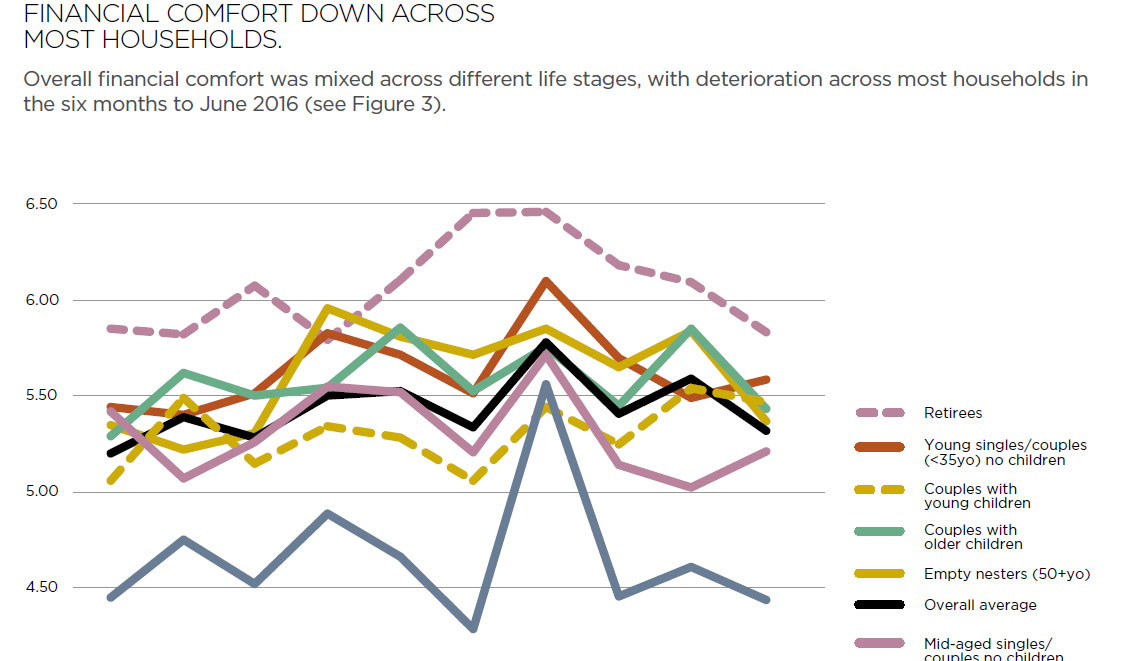
South Australia was the most financially comfortable mainland state in Australia, rising 2% to a historical high of 5.74 out of 10, while all other mainland states experienced a fall. Comfort levels in Western Australia fell 2% to a record low of 5.02 out of 10. While financial comfort in Victoria as a whole experienced a 6% drop to 5.52, Melbourne reported the highest comfort level of any city at 5.80 out of 10 – down only 2%, and still well ahead of Sydney, which reported a 4% drop to 5.58 out of 10.
The findings clearly indicate heightened concerns around the adequacy of income, the cost of necessities, lack of job availability and security as well as deterioration in expectations about meeting minimum debt payments and maintaining a standard of living in retirement.
In terms of generations1, the comfort of ‘baby boomers’ fell the most of any generation (down 7%) to the lowest level reported for that age cohort in the past couple of years (5.42 out of 10) – lower than ‘Gen Y’ (down only 2% to 5.46), but still above ‘Gen X’ (steady at 5.18).
‘Baby boomers’ reported greater perceived stress with ‘income’, ‘cash savings’ and ‘net wealth’ in the past six months to June 2016, despite continued gains in actual income and net wealth across households on average. ‘Baby boomers’ also reported greater worries with the ‘cost of necessities’ and the ‘ability to maintain lifestyle in retirement’ as well as the ‘level of government assistance available’ and ‘impact of legislative change on their financial situation’.
The findings add to a number of recent policy debates such as changes to superannuation. As many as 45% of ‘baby boomers’ said they ‘expect to be worse off after the recent Federal Budget’. Furthermore, ‘retirees’ reported their lowest levels of comfort since the survey began, although they’re still the most financially comfortable of any household life stage.
Household confidence in coping with a financial emergency (loss of income) fell 11% in the six months to June 2015, largely contributing to a 6% fall in overall household financial comfort, according to ME’s latest Household Financial Comfort Report. The findings are similar to DFA’s Household Finance Confidence Index, which fell to a new low in June.
Linked to the fall in financial emergency-preparedness are big falls in comfort with cash savings(down 9%) and income (down 6%) in the six months to June 2015. A lack of comfort about cash savings and the ability to cope with a financial emergency is particularly evident among single parents whose overall financial comfort fell 20% to 4.46 out of 10 during the first half of 2015. Decreased comfort with cash savings is likely to be caused by weak income growth – with only a third of respondents reporting household income gains in the past year – together with increased concerns about the job market. While job-security has remained steady at 71%, job availability fell 9 points with 56% of the workforce indicating it would be difficult finding another job within two months if they became unemployed, compared to 47% six months ago. Concern about savings and incomes has also resulted in a rise in the number of households citing ‘the cost of necessities’ as their biggest worry, up 3 points to 50% of households. Other major worries for households were ‘having enough cash on hand’, rising 3 points to 37% and ‘being able to make ends meet’ rising 5 points to 34% of households.
Renters feeling the financial pinch. Overall financial comfort is down 12% among renters to 4.35 out of 10, to remain well below the comfort of home-owners (down5% to 6.52) and households paying off mortgages (down 3% to 5.28). The fall in comfort among renters may be a reflection of the financial difficulty first home buyers are experiencing getting into the property market, coupled with a continued rise in rents across many states, particularly in some major capital cities.
A tale of two generations. The latest data also tells a tale of two generations, with Gen Ys (aged 18-34) and pre-retirees (aged 50-59) reporting the biggest falls in overall financial comfort (both down 10%), but for very different reasons. While Gen Ys (and single parents) are more concerned about their available cash savings, at the other end of the age spectrum, pre-retirees are most concerned about their expected standard of living in retirement as well as their investments. Falling financial comfort for older generations is also linked to falls in comfort with investments (down 9% on average, with the largest fall of 13% for Builders (aged 75+)) and increased risk aversion in the current low interest environment. A corollary of this is a fall in financial comfort in anticipated standard of living in retirement, down across all households by 8% to 5 out of 10, but by 16% to 4.5 among pre-retirees, with very high levels of comfort expected by self-funded retirees (7.14 out of 10) and significantly lower comfort levels reported among those totally/partly dependent on government pensions (3.38 and 5.15 out of 10 respectively).
Other findings include:
The labour-force: Self-employed workers reported the biggest fall in financial comfort (more than 20%) to the lowest level seen for this group since the survey commenced in late 2011, compared to a drop of 7% among full-time employees.
Regional variations: Comfort across all mainland states fell with relatively bigger falls in SA (down 10%), WA (down 9%) and NSW (down 8%). After a relatively small fall of 4%, comfort in Victoria was highest of the mainland states reflecting relatively higher levels of comfort across a range of drivers and in particular the ability to handle a financial emergency and comfort with cash savings.
Metro vs regional: After a fall of 9%, those living in regional areas continue to report significantly lower comfort (index of 5.18 out of 10), than city households (down 5% to an index of 5.52), with the highest comfort households located in Melbourne and Sydney.
Risk adverse: There has been a significant increase in financial risk aversion – with those people avoiding risk (39%) exceeding those willing to take risk (17%) by 22 percentage points – equal to its previous highest level in recorded in December 2012.

 Blog")