As the Royal Commission’s third round of public hearings casts the spotlight on Big Four banks and SME lending, Fintech Moula says another spotlight is cast on fintechs who have stepped up to address the gap in market left by banks and traditional lenders.
Moula CEO Aris Allegos said: “SMEs make up over 97% of Australian businesses, but have been neglected for so long. The big banks haven’t been able to cater to this market, which is why we’ve tailored our product to the specific needs of business owners. Our process focuses on eliminating the hurdles and lengthy application processes, delivering decisioning within 24 hours.”
“Moula has listened to the unique needs of a business providing funding relevant to their specific needs and circumstances.”
Banks’ underwriting still hasn’t adapted to the new lending landscape: applications involve cumbersome submissions, and documentation requirements are often prohibitive. The bulk of applications are reviewed manually, which take 6-8 weeks on average to process.
Notwithstanding, the cumbersome application process doesn’t mean banks are better able to approve a business loan. According to Digital Finance Analytics’ 2017 SME Survey, unsecured business loan applicants now face a 74% rejection rate, up from last year, where businesses had a 67% likelihood of being rejected by traditional lenders.
Responsible lending plays a huge part in Moula’s business model, which focuses on sustainable underwriting.
“At Moula, we’re backing good businesses to help them achieve their ambitions, and the only way to achieve this is through honest, transparent, and responsible lending.
“Transparency is at the core of our business model and a key value at Moula. We’re proud to be leading the market in defining best-practice transparency and disclosure.”
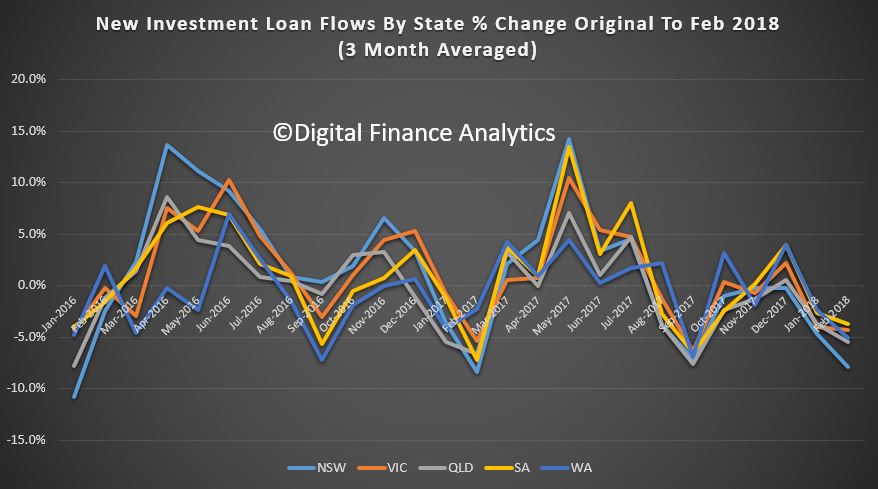
To start at the end of the story, we see significant falls across most states in investment lending flows, with the most significant falls in the Sydney market.
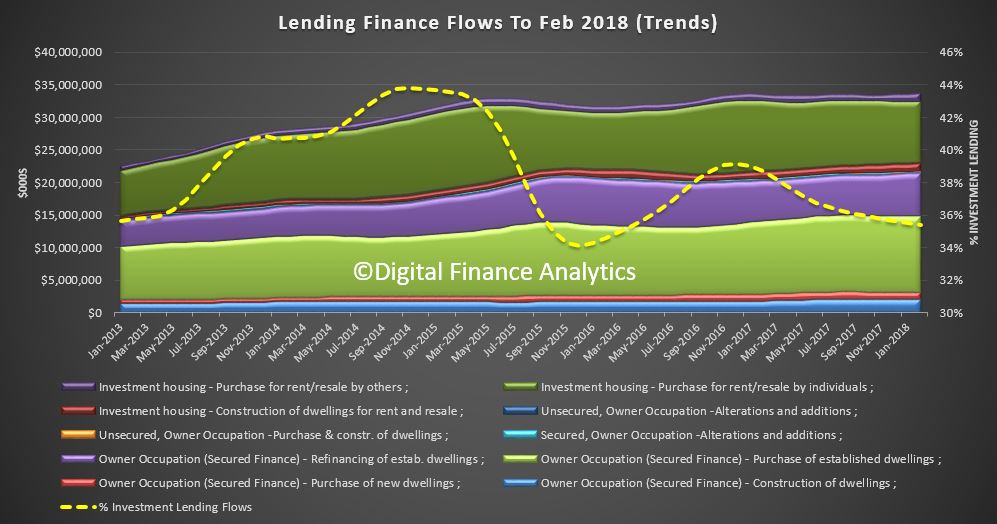
The share of investment flows continues to drift lower, to around 35%. But that is still substantial investment lending!
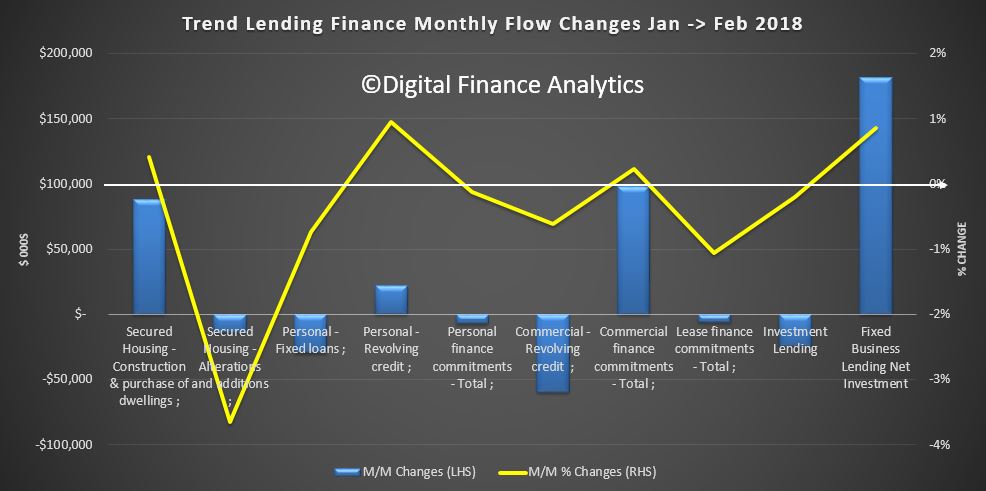
More broadly, the monthly changes from January to February shows the total value of owner occupied housing commitments excluding alterations and additions rose 0.4% in trend terms.
The trend value of total personal finance commitments fell 0.1%. Fixed lending commitments fell 0.7%, while revolving credit commitments rose 1.0%.
The trend value of total commercial finance commitments rose 0.2%. Fixed lending commitments rose 0.5%, while revolving credit commitments fell 0.6%. Within that investment loan flows fell just a little.
The trend series for the value of total lease finance commitments fell 1.1% in February 2018.
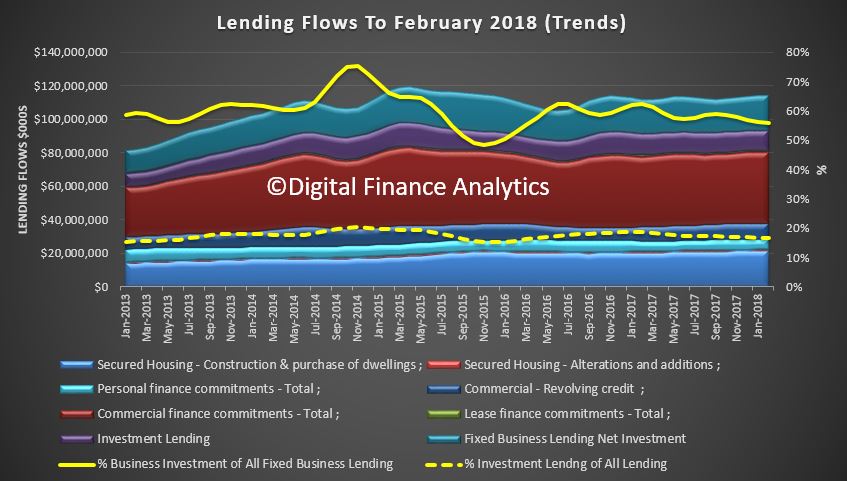
Finally, the percentage of investment lending of all lending flows is below 20%, and shows a small fall. But we also see a fall in business lending to around 55%, excluding investment property lending.
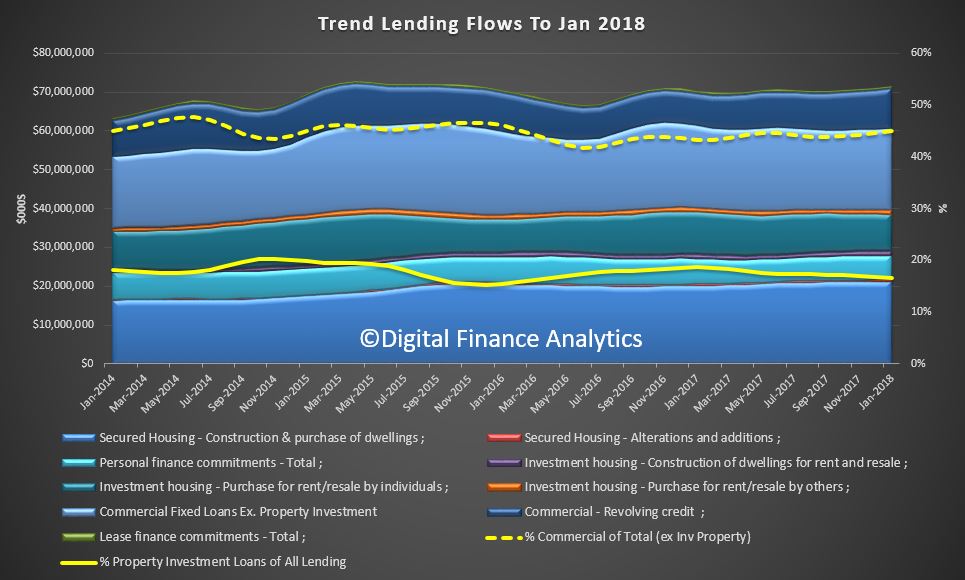
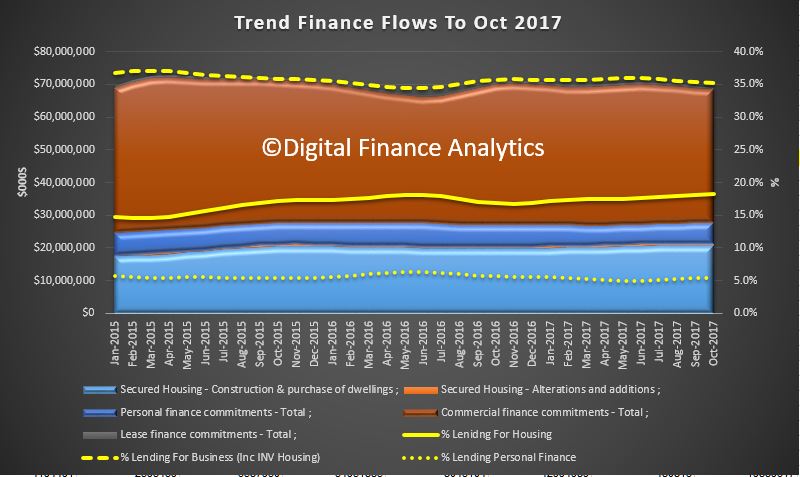
The ABS released their finance series today, which completes the monthly data. As normal we analyse the trend series, which smooths some of the monthly data noise. Overall lending across all categories was up 0.71% to $71 billion in the month. Commercial lending (excluding for investment housing) grew the most.
Within that, in trend terms, the total value of owner occupied housing commitments excluding alterations and additions rose 0.11%, the value of total personal finance commitments fell 0.1%. Fixed lending commitments fell 0.1% and revolving credit commitments fell 0.1%.
The trend series for the value of total commercial finance commitments rose 1.1%. Revolving credit commitments rose 2.5% and fixed lending commitments rose 0.7%. The trend series for the value of total lease finance commitments rose 0.1% in January 2018.
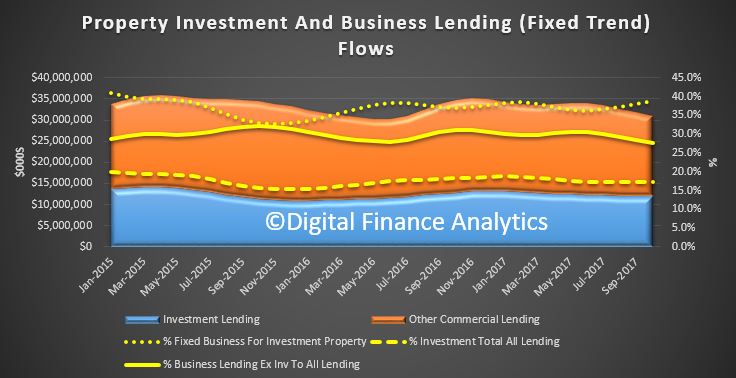
To look at what is really going on we need to back out the housing investment data from the commercial series, and also calculate the % of property investment to all lending, and % of commercial lending of the total.
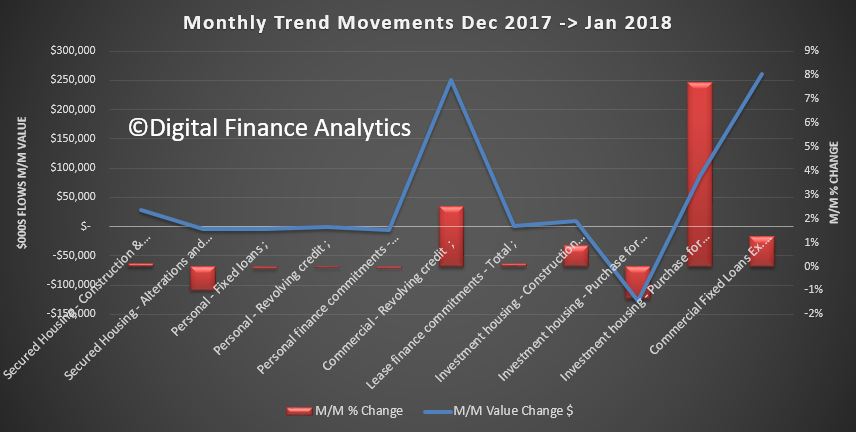
We can look at the movements in monthly flows, by value and percentage change.
Lending for secured housing rose 0.14% or 28.8 million to $21.1 billion. Secured alterations fell 1%, down $3.9 million to $391 million. Fixed personal loans fell 0.1%, down $1.2 million to $4.0 billion, while revolving loans fell 0.06%, down $1.3 million to $2.2 billion.
Investment lending for construction of dwellings for rent rose 0.86% or $10 million to $1.2 billion. Investment lending for purchase by individuals fell 1.34%, down $127.7 million to $9.4 billion, while investment lending by others rose 7.7% up $87.2 million to $1.2 billion.
Fixed commercial lending, other than for property investment rose 1.25% of $260.5 million to $21.1 billion, while revolving commercial lending rose 2.5% or $250 million to $10.2 billion.
The proportion of lending for commercial purposes, other than for investment housing was 45% of all commercial lending, up from 44.5% last month.
The proportion of lending for property investment purposes of all lending fell 0.1% to 16.6%.
So, we are seeing a rotation, if a small one, towards commercial lending for more productive purposes. However, lending for property and for investment purposes remains quite strong. No reason to reduce lending underwriting standards at this stage or other controls.
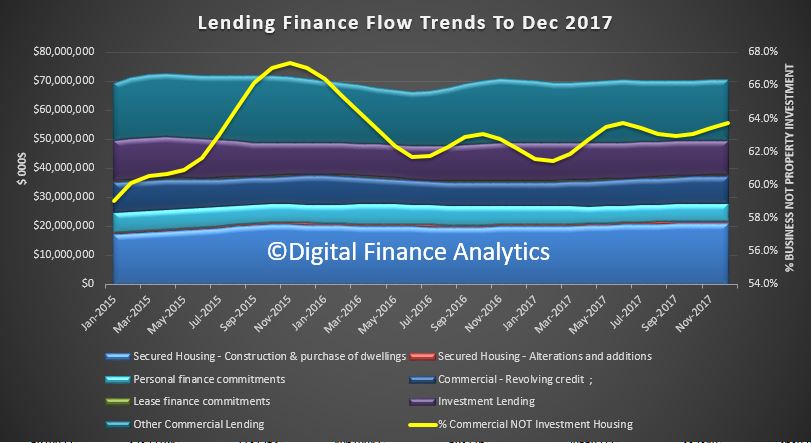
The final release from the ABS on Lending Finance to December 2017 really underscores the slowing momentum in investment property lending, especially in Sydney (though it is still a significant slug of new finance, and there is no justification to ease the current regulatory requirements.)
The ABS says the total value of owner occupied housing commitments excluding alterations and additions rose 0.1% in trend terms, total personal finance commitments fell 0.2%. Revolving credit commitments fell 1.4%, while fixed lending commitments rose 0.5%.
The trend series for the value of total commercial finance commitments rose 0.2%. Fixed lending commitments rose 0.3%, while revolving credit commitments fell 0.3%.
The trend series for the value of total lease finance commitments fell 0.1% in December 2017 and the seasonally adjusted series rose 8.3%, after a fall of 7.6% in November 2017.
The mix of commercial lending tilted away from investment lending and towards other commercial purposes at 64%.
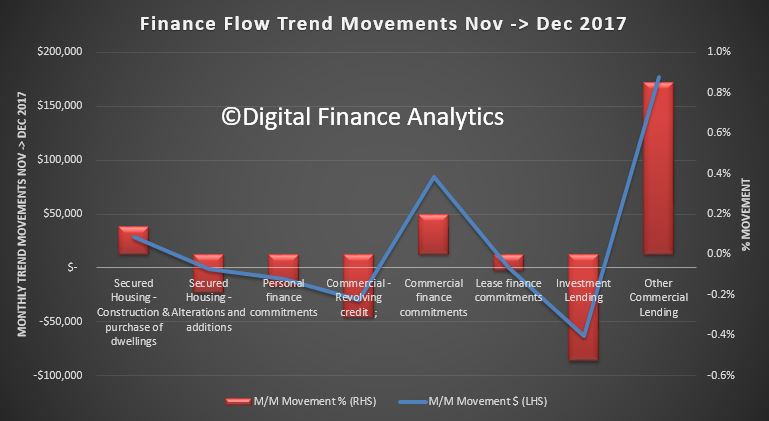
This is demonstrated by the monthly changes in flows, as shown below, with a 0.8% rise in other commercial lending, and a 0.5% fall in investment housing lending.
There was a small rise in lending for housing construction, but overall mortgage momentum looks like it is still slowing.
The ABS notes:
A new publication will soon be released which will see Housing Finance, Australia (5609.0) and Lending Finance, Australia (5671.0) combined into a single, simpler publication called Lending to Households and Businesses, Australia (5601.0).
To enable users to prepare for the new publication, tables of data in the new publication format will be released no less than one month prior to the first release of Lending to Households and Businesses, Australia (5601.0).
REVISIONS
In this issue, revisions have been made to the original series as a result of improved reporting of survey and administrative data. These revisions have affected the following series:
Commercial Finance for the periods September 2017 and October 2017.
Personal Finance for the period November 2017.
Investment housing finance for the period October 2017.
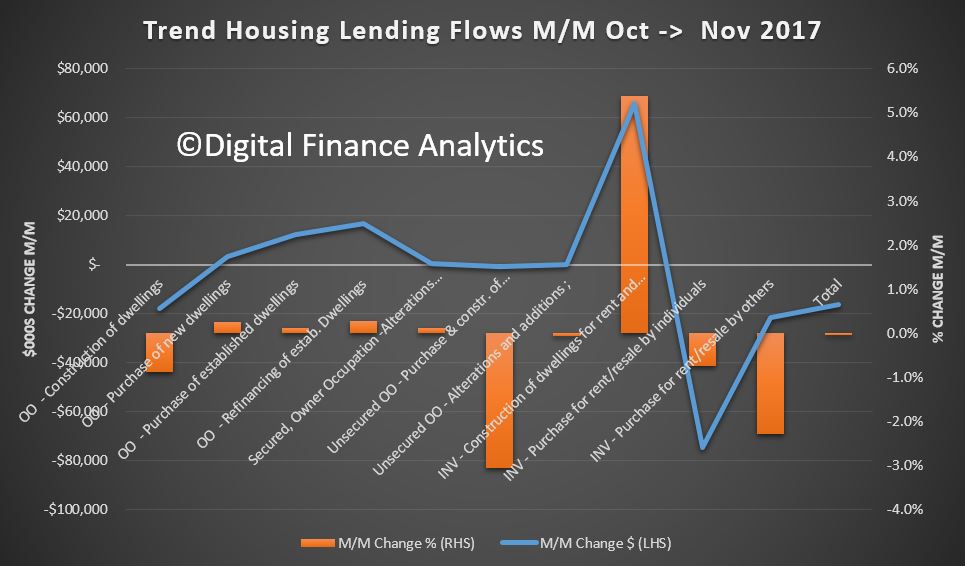
The final set of data from the ABS – Lending Finance to November 2017 highlights again the changes underway in the property sector. They also contain some revisions from last month. As normal we will focus on the trend series, which smooths some of the monthly changes.
Within the housing series, owner occupied lending for construction fell 0.88% compared with the previous month, down $17m; lending for the purchase of new dwellings rose 0.25%, up $3m; and loans for purchase of existing dwellings rose 0.11%, up $12m.
Refinance of existing owner occupied dwellings rose 0.28%, up $16m.
Looking at investors, borrowing for new investment construction rose 5%, up $65m; while purchase of existing property by investors fell $74m for individuals, down 0.75%; and for other investors, down $21m or 2.28%.
Overall there was a fall of $16m across all categories.
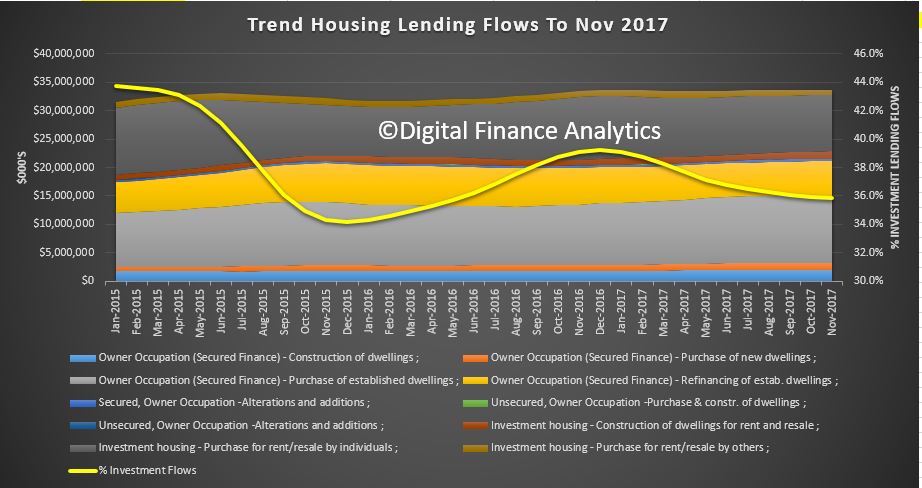
We see a fall in investment lending overall, but it is still 36% of new lending flows, so hardly a startling decline. Those calling for weakening of credit lending rules to support home price growth would do well to reflect that 36% is a big number – double that identified as risky by the Bank of England, who became twitchy at 16%!
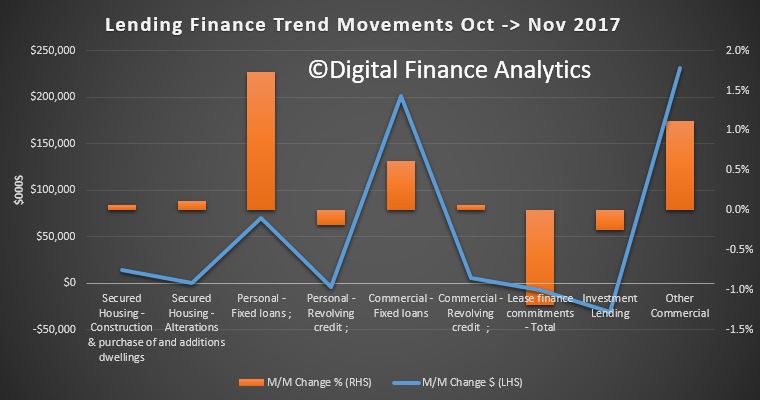
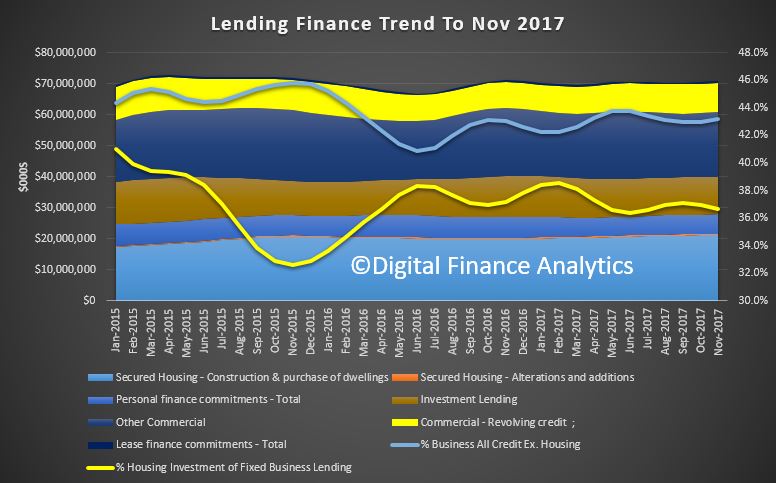
Looking then across all lending categories, personal fixed credit (personal loans rose $70m, up 1.74%; while revolving credit (credit cards) fell $4m down 0.18%. Fixed commercial lending, other than for property investment rose $231m or 1.12%; while lending for investment purposes fell 0.25% or $30m. The share of fixed business lending for housing investment fell to 36.7% of business lending flows, compared with 41% in 2015. Revolving business credit rose $6m up 0.06%.
So, what can we conclude? Investment lending momentum is on the turn, though there is still lots of action in the funding of new property construction for investment – mostly in the high rise blocks around our major centres. But in fact momentum appears to be slowing in Brisbane, Sydney and Melbourne. This does not bode well for the construction sector in 2018, as we posit a fall in residential development, only partly offset by a rise in commercial and engineering construction (much of which is state and federal funded).
The good news is lending to business, other than for housing investment is rising a little, but businesses are still looking to hold costs down, and borrow carefully. This means economic growth will be slow, and potential wages growth will remain contained.
Finally, here is the ABS reporting the data. Note the significant swings between the trend and seasonal adjusted series. You can pick your number, and weave a story to suit, as people are doing.
The total value of owner occupied housing commitments excluding alterations and additions rose 0.1% in trend terms, and the seasonally adjusted series rose 2.7%.
The trend series for the value of total personal finance commitments rose 1.0%. Fixed lending commitments rose 1.7%, while revolving credit commitments fell 0.2%.
The seasonally adjusted series for the value of total personal finance commitments rose 1.1%. Revolving credit commitments rose 2.8% and fixed lending commitments rose 0.1%.
The trend series for the value of total commercial finance commitments rose 0.5%. Fixed lending commitments rose 0.6% and revolving credit commitments rose 0.1%.
The seasonally adjusted series for the value of total commercial finance commitments rose 14.7%. Fixed lending commitments rose 22.0%, while revolving credit commitments fell 8.1%.
The trend series for the value of total lease finance commitments fell 1.2% in November 2017 and the seasonally adjusted series fell 8.0%, after a rise of 4.1% in October 2017.
Christopher Kent, RBA Assistant Governor (Financial Markets), spoke at the 30th Australasian Finance and Banking Conference on The Availability of Business Funding, a subject which was featured in the recent RBA Bulletin.
While his speech covered the gamut of business finance, his comments on small business are important. He acknowledged the need for, and difficulty of getting funding in this sector. Something we have highlighted in our SME Report series, and which are still available. Whilst alternative lenders (Fintechs for example) have a role to play, (and there is massive opportunity in the SME sector in our view), most SME’s still go to the banks, where they have to pay more, for poor products and service. Indeed, if you are a business owner seeking to borrow, without a property to secure against, the options are limited. This is because the banks’ view is, correctly, unsecured risks are higher than secured, and in any case, they prefer to lend to mortgage holders more generally, as the capital required to do so is lower. Therefore many SME’s are at a structural disadvantage, and often end up having to pay very higher interest rates, if they can get finance at all.
There is much to do, in my view, to address the funding needs of SMEs, and this is a critical requirement if we are to seen sustained real economic growth. As Kent suggests, perhaps Open Banking will assist, eventually!
The challenge of obtaining finance has been a consistent theme of the Small Business Finance Advisory Panel. In this context, it is important to distinguish between two types of small businesses. First, there are the many established small businesses that are not expanding. Their needs for external finance are typically modest. Second, there are small businesses that are in the start-up or expansion phase. They are not generating much in the way of internal funding. Accordingly, those businesses have a strong demand for external finance. I’ll focus my comments on the issues relevant to this second group of small businesses.
I should emphasise again that access to finance for small businesses is important because they generate employment, drive innovation and boost competition in markets. Indeed, small businesses in Australia employ almost 5 million people, which is nearly half of employment in the (non-financial) business sector. They also account for about one-third of the output of the business sector.
Compared with larger, more established firms, smaller, newer businesses find it difficult to obtain external finance since they are riskier on average and there is less information available to lenders and investors about their prospects. Lenders typically manage these risks by charging higher interest rates than for large business loans, by rejecting a greater proportion of small business credit applications or by providing credit on a relatively restricted basis.
The reduction in the risk appetite of lenders following the global financial crisis appears to have had a more significant and persistent effect on the cost of finance for small business than large business. After the crisis, the average spread of business lending rates to the cash rate widened dramatically. The increase was much larger and more persistent, though, for small business loans (Graph 9). In part, this increase owed to the larger increase in non-performing loans for small businesses than for large business lending portfolios (Graph 10). It’s not clear, however, whether the increase in interest rates being charged on small business loans relative to those charged on large business loans (over the past decade or so) reflects changes in the relative riskiness of the two types of loans.[11]
Graph 9
Graph 10
Over recent years, there has been strong competition for large business lending, which has resulted in a decline in the interest rate spread on large business loans. Part of the competition from banks for large business loans has been driven by an expansion in activity by foreign banks. Large businesses also have access to a wider array of funding sources than small businesses, including corporate bond markets and syndicated lending.
In contrast, competition has been less vigorous for small business lending. Indeed, some providers of small business finance were acquired by other banks or exited the market following the onset of the crisis. Also, the interest rates on small business loans have remained relatively high. This difference in competitive pressures is evident in the share of lending provided to small business by the major banks, which is relatively high at over 80 per cent. This compares with a share of around two-thirds in the case of large businesses. Small businesses continue to use loans from banks for most of their debt funding because it is often difficult and costly for them to raise funds directly from capital markets.
The RBA’s liaison has highlighted that if small business borrowers are able to provide housing as collateral, it significantly reduces the cost and increases the availability of debt finance. Lenders have indicated that at least three-quarters of their small business lending is collateralised and they only have a limited appetite for unsecured lending. However, there are a number of reasons why entrepreneurs find it difficult to provide sufficient collateral for business borrowing via home equity:
they may actually not own a home, or have much equity in their home if they are relatively young;
similarly, they may not have sufficient spare home equity if they’ve already borrowed against their home to establish a business and now want to expand their business;
and even if they have plenty of spare home equity, using their homes as collateral concentrates the risk they face in the event of the failure of the business.
Many entrepreneurs have limited options for providing alternative collateral, since banks are far more likely to accept physical assets (such as buildings or equipment), rather than ‘soft’ assets, such as software and intellectual property.
Given the higher risk associated with small businesses, particularly start-ups, equity financing would appear to be a viable alternative to traditional bank finance. However, small businesses often find it difficult to access equity financing beyond what is issued to the business by the founders. Small businesses have little access to listed equity markets, and while private equity financing is sometimes available, its supply to small businesses is limited in Australia, particularly when compared with the experience of other countries (Graph 11). Small businesses also report that the cost of equity financing is high, and they are often reluctant to sell equity to professional investors, since this usually involves relinquishing significant control over their business.
Graph 11
Innovations Improving Access to Business Finance
There are several innovations that could help to improve access to finance by: providing lenders with more information about the capacity of borrowers to service their debts, and connecting risk-seeking investors with start-up businesses that could offer high returns.
Comprehensive credit reporting
Comprehensive credit reporting will provide more information to lenders about the credit history of potential borrowers. The current standard only makes negative credit information publicly available. When information about credit that has been repaid without problems also becomes available publicly, the cost of assessing credit risks will be reduced and lenders will be able to price risk more accurately; this may enhance competition as the current lender to any particular business will no longer have an informational advantage over other lenders. It may also reduce the need for lenders to seek additional collateral and personal guarantees for small business lending, particularly for established businesses. Indeed, the use of personal guarantees is more widespread in Australia than in countries that have well-established comprehensive credit reporting regimes, such as the United Kingdom and the United States.
For several years, the finance industry has attempted to establish a voluntary comprehensive credit reporting regime in Australia. Participation has so far been limited.[13] However, several of the major banks have committed to contribute their credit data in coming months. The Australian Government has announced that it will legislate for a mandatory regime to come into effect mid next year.
Open banking
The introduction of an open banking regime should make it easier for entrepreneurs to share their banking data (including on transactions accounts) securely with third-party service providers, such as potential lenders. When assessing credit risks, lenders place considerable weight on evidence of the capacity of small business borrowers to service their debts based on their cash flows. For this reason, making this data available via open banking would reduce the cost of assessing credit risk. A review is currently being conducted with a view to introducing legislation to support an open banking regime.
Large technology companies
Technology firms can use the transactional data from their platforms to identify creditworthy borrowers, and provide loans and trade credit to these businesses from their own balance sheets. This could supply small innovative businesses that are active on these online platforms with a new source of finance. Amazon and Paypal are providing finance to some businesses that use their platforms. For example, Amazon identifies businesses with good sales histories and offers them finance on an invitation-only basis. Loans are reported to range from US$1 000 to US$750 000 for terms of up to a year at interest rates between 6 and 14 per cent. Repayments are automatically deducted from the proceeds of the borrower’s sales.
Alternative finance platforms
Alternative finance platforms, including marketplace lending and crowdfunding platforms, use new technologies to connect fundraisers directly with funding sources. The aim is to avoid the costs and delays involved in traditional intermediated finance.
While alternative financing platforms are growing rapidly, they are still a very minor source of funding for businesses, including in Australia. The largest alternative finance markets are in China, followed by the United States and the United Kingdom. But even these markets remain small relative to the size of their economies (Graph 12).
Graph 12
Marketplace lending platforms provide debt funding by matching individuals or groups of lenders with borrowers. These platforms typically target personal and small business borrowers with low credit risk by attempting to offer lower cost lending products and more flexible lending conditions than traditional lenders. Data collected by the Australian Securities and Investments Commission indicate that most marketplace lending in Australia is for relatively small loans to consumers at interest rates comparable to personal loans offered by banks (Graph 13).
Graph 13
It is unclear whether marketplace lending platforms are significantly reducing financial constraints for small businesses. Unlike innovations such as comprehensive credit reporting, which have the potential to improve the credit risk assessment process, marketplace lenders do not have an information advantage over traditional lenders. As a result, they need to manage risks with prices and terms in line with traditional lenders. Nevertheless, these platforms could provide some competition to traditional lenders, particularly as a source of unsecured short-term finance, since they process applications quickly and offer rates below those on credit cards.
Crowdfunding platforms have the potential to make financing more accessible for start-up businesses, although their use has been limited to date. Crowdsourced equity funding platforms typically involve a large number of investors taking a small equity stake in a business. As a result, entrepreneurs can receive finance without having to give up as much control as expected by venture capitalists. Several legislative changes have been made to facilitate growth in these markets, including by allowing small unlisted public companies to raise crowdsourced equity.
Owner occupied housing lending excluding alterations and additions fell 0.1% in trend terms. Personal finance commitments rose 1.3%. Fixed lending commitments rose 2.2%, while revolving credit commitments fell 0.1%.
Total commercial finance commitments fell 1.1%. Fixed lending commitments fell 2.5% (which includes mortgage lending for investment purposes), while revolving credit commitments rose 3.7%.
The trend series for the value of total lease finance commitments fell 0.7%.
Here is the summary with the relative percentage for owner occupied housing and personal finance rising (so putting more pressure on household debt ratios in a flat income, rising cost market). Overall lending to business, relative to all lending fell again.
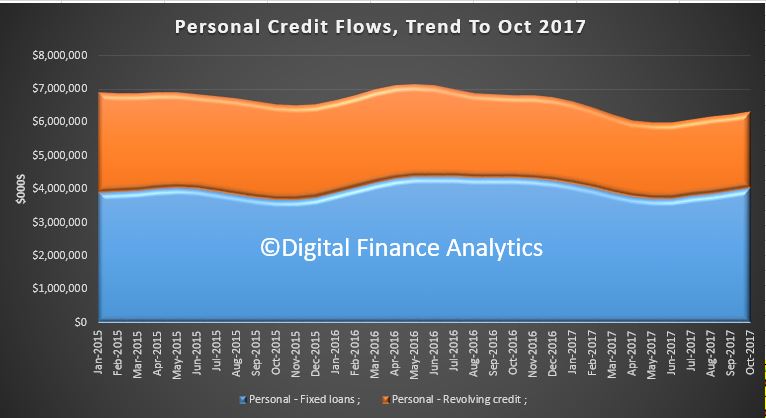
Personal credit is rising, now, as households find their cash flow is under pressure, many are now seeking fixed loans to help bridge the gap left by falling savings. In prior years there was a fall at this time of year, before the Christmas binge, but that is different this year. This does not bode well for Christmas spending, and we see signs of the New Year sales already underway!
Then finally, if we look at the fixed business lending, and split it into lending for property investment and other business lending, the horrible truth is that even with all the investment lending tightening, relatively the proportion for this purpose grew, while fixed business lending as a proportion of all lending fell.
These a clear signs of a sick economy (in the sense of unwell!), with business investment still sluggish, still too much lending on property investment, and as we showed above, too much additional debt pressure on households.
I will repeat. Lending growth for housing which is running at three times income and cpi is simply not sustainable. Households will continue to drift deeper into debt, at these ultra low interest rates. This makes the RBA’s job of normalising rates even harder.
The mid-year economic forecast, later in the week will likely simply underscore the fact the economic settings are not appropriate. And, by the way, tax cuts, even if they could be paid for, will not help.
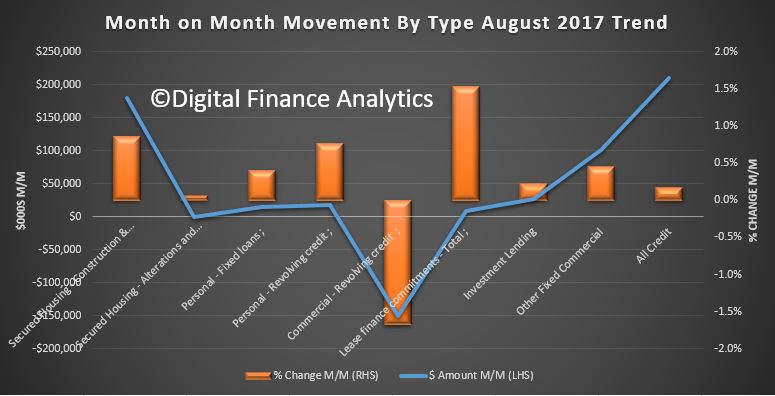
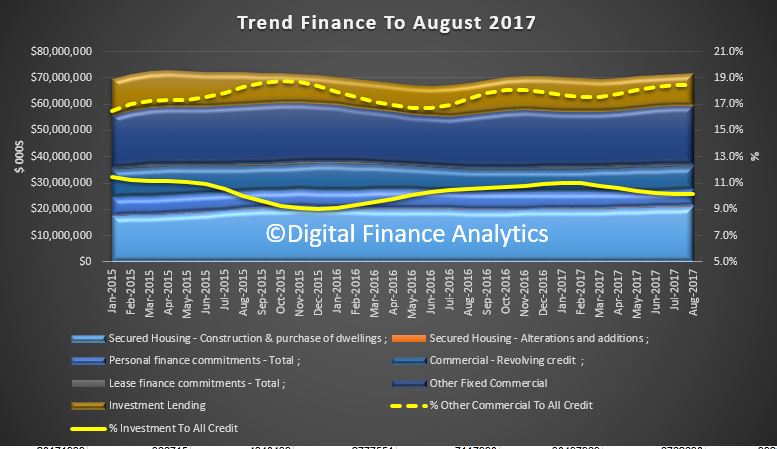
The ABS released their final piece of the finance jig-saw today, Lending Finance to August 2017. As normal we look at the trend data, which smooths out some of the statistical bumps.
Total credit lifted again, in flow trend terms, up 0.2%.
Investment mortgage flows were up 0.2% (flat in Sydney, and still rising in Melbourne) and made up 10.2% of all credit, the same as last month. Lending for other commercial purposes rose 0.5% while revolving commercial credit fell 1.7%. Lending for personal finance rose 0.5%, as households reach for more credit to assist their cash flows.
The total value of owner occupied housing commitments excluding alterations and additions rose 0.9% in trend terms.
The trend series for the value of total personal finance commitments rose 0.5%. Revolving credit commitments rose 0.8% and fixed lending commitments rose 0.4%.
The trend series for the value of total commercial finance commitments was flat. Fixed lending commitments rose 0.4% while revolving credit commitments fell 1.7%.
The trend series for the value of total lease finance commitments rose 1.5% in August 2017 while the seasonally adjusted series fell 0.6%, following a 6.8% fall in July 2017.
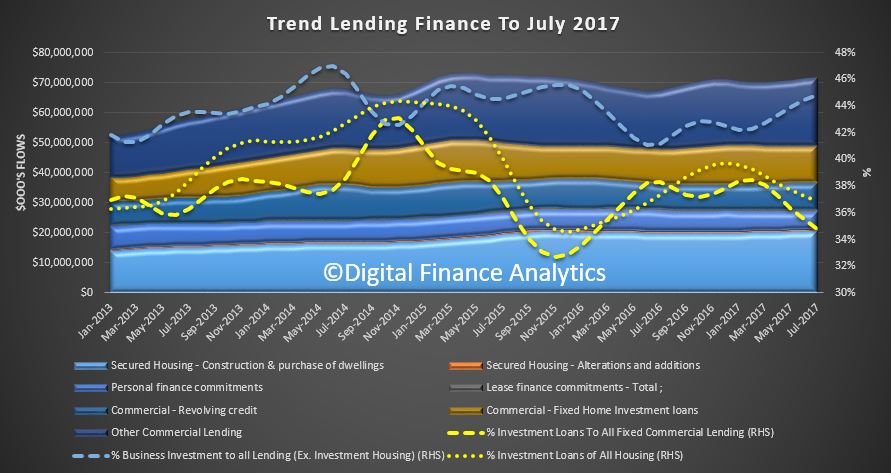
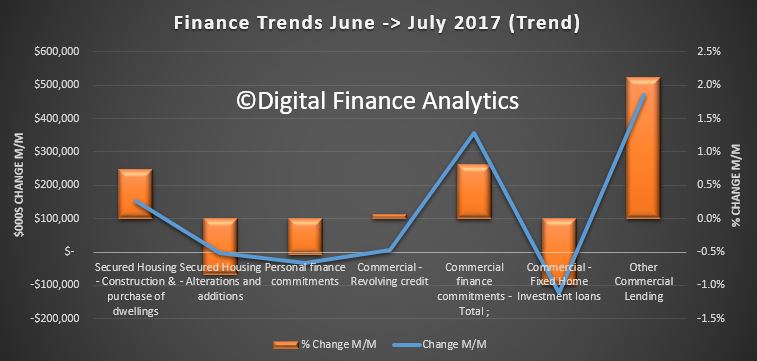
The latest data from the ABS: Lending Finance to end July 2017, is the final piece on the monthly data releases which is the story of finance. Most striking is the rise in commercial lending, other than for investment home investment, up 2%, while lending for property investment fell as a proportion of all lending, and of lending for residential housing. This included significant falls in NSW where it appears investors may be changing their tune.
So, finally some green shoots of business investment perhaps. We really need this to come on strong to drive the growth we need to stimulate wages. The upswing is there, but quite small, so we need to watch the trajectory over the next few months. Overall lending grew 0.64% in the month, (which would be 7.8% on an annualised basis), way stronger than wages or cpi.
The total value of owner occupied housing lending excluding alterations and additions rose 0.7% in trend terms. The trend series for the value of total personal finance commitments fell 0.5% within which fixed lending commitments fell 0.6% and revolving credit commitments fell 0.4%.
The trend series for the value of total commercial finance lending rose 0.8% of which fixed lending commitments rose 1.0% and revolving credit commitments rose 0.1%, while the value of total lease finance commitments fell 4.1% in July 2017.
The ABS made a series of revisions in prior months – without explanation: Commercial Finance for the month of June 2017, Personal Finance for the periods between April 2017 to June 2017 and Investment housing finance for the month of June 2017.
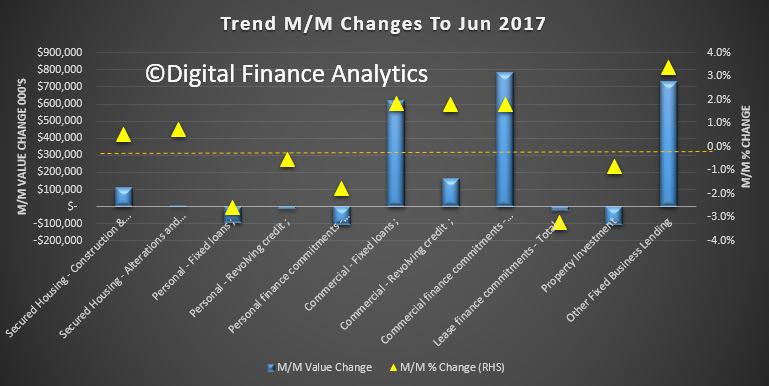
The ABS data on lending finance released today for Jun 2017, provides the last piece of the lending jigsaw puzzle. Here is the overall picture, in one chart.
The key take outs are that proportion of lending for housing is falling, whilst the proportion for business lending is rising. The share of lending for investment property fell slightly.
The total value of owner occupied housing commitments excluding alterations and additions rose 0.5% in trend terms.
The trend series for the value of total personal finance commitments fell 1.8%. Fixed lending commitments fell 2.6% and revolving credit commitments fell 0.5%.
The trend series for the value of total commercial finance commitments rose 1.8%. Fixed lending commitments rose 1.8% and revolving credit commitments rose 1.8%. This includes lending for investment housing purposes. We separate that out in the chart.
The month on month movements, depicted below, show a rise in business lending unrelated to housing by 3%, whist lending for investment housing fell 0.85% month on month. So, perhaps, finally, we see lending by business beginning to gain momentum! This is needed for sustainable growth. The yellow triangles show the % change (reading the scale on the right), whilst the value is shown by the blue bars (reading the sale on the left).
The bulk of lending for investment housing still came from NSW, then VIC, where the markets are still hot.
There were a number of revisions to earlier months data, which the ABS said was a result of improved reporting of survey and administrative data. These revisions have affected the following series:
Commercial Finance for the periods between March 2017 to May 2017.
Personal Finance for the periods between March 2017 to May 2017.
Investment housing finance for the month of April 2017